PEMANFAATAN DATA SATELIT DAN SISTIM INFORMASI GEOGRAFIS (SIG) UNTUK MENENTUKAN DAERAH PERIKANAN PANTAI DI LAUT SELATAN JAWA BARATPEMANFAATAN DATA SATELIT DAN SISTIM INFORMASI GEOGRAFIS (SIG) UNTUK MENENTUKAN DAERAH PERIKANAN PANTAI DI LAUT SELATAN JAWA BA
on
Ecotrophic ♦ 5 (1): 27 - 33 issn: 1907-5626
PEMANFAATAN DATA SATELIT DAN SISTIM INFORMASI GEOGRAFIS (SIG) UNTUK MENENTUKAN DAERAH PERIKANAN PANTAI DI LAUT SELATAN
JAWA BARAT
Hariyadi1 and Ida Bagus Sudana2)
-
1)SMKN Pelabuhanratu
-
2)Master Program of Environment Science Postgraduate Program Udayana University
ABSTRAK
Indonesia adalah negara maritim yang dikelilingi oleh lautan yang luas. Dua musim yang terjadi berpengaruh pada keadaan oseanografi dan perikanan daerah tersebut. Musim-musim tersebut terjadi karena pengaruh angin musim, yaitu Musim Barat, Musim Timur, dan musim peralihan diantara keduanya (Raharjo 2002).
Perikanan menggunakan Sistim Informasi Geografis (SIG) dan Penginderaan Jauh dapat digunakan untuk tujuan spesifik. Aplikasi yang paling pokok adalah untuk dinamika populasi dan distribusi ikan dalam ekosistim. Karakteristik lingkungan seperti: suhu, termo clines, kadar garam, arus, dan kedalaman adalah identifikasi potensi yang menggunakan teknologi data satelit menjadi cara mengidentifikasi secara tidak langsung. Data satelit dapat digunakan untuk mengidentifikasi parameter oseanografi yang berhubungan erat dengan kumpulan ikan atau habitat ikan. Antara parameter oseanografi yang berhubungan dengan kehidupan ikan pelagis adalah suhu air laut dan kesuburan perairan. Peta dari data satelit suhu, klorofil dapat digunakan sebagai informasi tentang fononema spesifik oseanografi dan upwelling sebagai daerah berkumpulnya ikan.
Armada penangkap ikan berangkat dari pangkalan belum tahu secara pasti lokasi penangkapan sehingga selalu dalam ketidakpastian tentang lokasi yang potensial untuk penangkapan ikan, dan hasil tangkapannya juga tidak pasti. Disamping itu, sebagai akibat dari ketidakpastian lokasi penangkapan mengakibatkan kapal penangkap banyak menghabiskan waktu dan bahan bakar untuk mencari lokasi fishing ground.
Keberhasilan operasi penangkapan tidak bergantung dari pengalaman saja tetapi harus mempunyai data dimana terdapat lokasi kumpulan ikan. Dan penggunaan alat tangkap semi aktif juga membantu pendapatan nelayan dan harusnya diikuti oleh nelayan dari kabupaten lain terutama pada waktu musim barat, tetapi penggunaan mata jaring harus dibatasi oleh undang-undang dan peraturan agar ikan kecil tidak ikut tertangkap.
Kata kunci : Daerah Perikanan Pantai, Penginderaan Jauh, SIG, Musim, Data Perikanan, Data Satelit.
ABSTRACT
Indonesia is maritime country surrounding by Wide Ocean. Two seasons that always happened in this area have been influence to the situation of oceanography and fisheries zone. The seasons which happened because influence by wind of monsoon, which are West Monsoon, East Monsoon, and the transition condition among both.
The fishing ground information used Geography Information System (GIS) and remote sensing (RS) software and can be used for specific purpose. The most fundamental application is for dynamics population and distribution of fish in the ocean ecosystem. Environmental characteristics such as: temperature, thermo clines, salinity, ocean currents, and depth is identify potential fishing use technology of image satellite represent the way of identifying indirectly. From satellite data far identified by interconnected oceanography parameters sliver with fish habitation or potential schooling fish. Between oceanography parameter having relation with life of pelagic fish is water temperature go out to sea and fertility of territorial water area. Map of conducive satellite data, sea surface temperature ( SST) and content of chlorophyll-a the can be obtained by information about oceanography phenomena specially front thermal and upwelling representing potency area as fishing indicator.
Fishing vessel usually leave fishing base without exactly knowing location of fishing ground so it always stay in uncertainty potential location of fishing ground, therefore its haul also becoming not surely. Meanwhile, in consequence of uncertainty fishing location, resulted fishing ship passing many time and fuel to looking for location of fishing ground.
Successfully of the fishing operation is not depend by experience of fishing master but there are must be have the data where fishing ground located. And application of semi active fishing gear much help fisherman salary and require following by other sub-province especially at the west season, but having to limit by usage mesh size enabled by law or regulation so that small fish do not follow to be caught.
Key words : Coastal Fisheries Zone, Remote Sensing, GIS, Monsoon, Fisheries Data, Satellite Data.
INTRODUCTION
Background
Indonesia is maritime country surrounding by Wide Ocean, covering more than 2/3 from the area of the country. Oceanographically, Indonesian regions are divided into different bathymetrical conditions consist of shallow and deep sea. Generally, Indonesian fisheries are characterized by traditional and modern fisherman with different kind of fish equipment. Exploitation of fish resource of each region in Indonesia also has specific way of catchments. Therefore, Indonesia fisheries have to managed to avoid over exploited and to develop integrated management system of sustainable fisheries.
Indonesian Sea, which is located in equator area, is representing as a world oceanography indicator in which world climate base on such oceanography parameter. Indonesian tropical climate bring the advantages many kind of fish types and potency of fisheries. There are about 6000 types of fish and almost 3000 types of them have been identified. (Ditjen Perikanan, 1998).
Some of South West Java Territory from Indian Ocean region has a high value of sustainable fisheries. Fishery in this region is characterized by specific fishing gear consist of various types that are: Gill Net, Purse Seine, Trammel Net, Lift Net, and Surrounding Net
The area of South West Java Sea represents by many kind potential of fisheries resources. Fishermen in this area have been exploited this fisheries resource using traditional equipment. Exploitation of Indonesia fisheries in various regions is not flattening.
In some other open territorial water, they have a big opportunity for the development and exploited, while in some region have a solid condition catch or over fish catching. Main problem faced in the optimal fishing effort especially of pelagic and demersal fish is very limited information and data regarding to the condition of interconnected oceanography sliver with potency of fishing area. Fishing boat leave from fishing base is not to catch but to look for fishing ground location, so it is always stay in uncertainty potential location of fishing ground.
RESEARCH METHODS
Location of Research
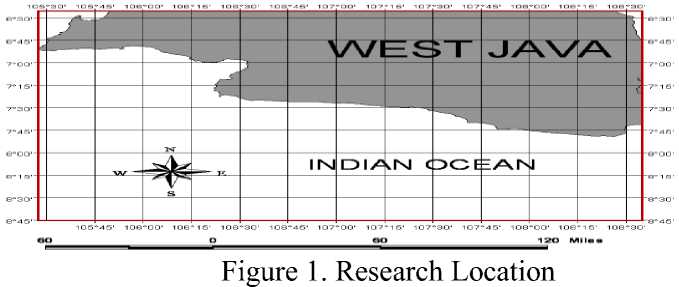
Research location was in the South West Java Sea with position 6° 45' E - 8° 30' E and 105° 30' W - 109° W (Figure 1). The fisheries data are from Sub-Province of Sukabumi, Sub-Province of Cianjur, Sub-Province of Garut, Sub-Province of Tasikmalaya and Sub-Province of Ciamis.
Satellite Data
- Monthly Sea Surface Temperature (SST) 2002 – 2005.
- Monthly Chlorophyll-a (Chl-a) 2002 – 2005
- Ocean current monthly data is from 2001 – 2005.
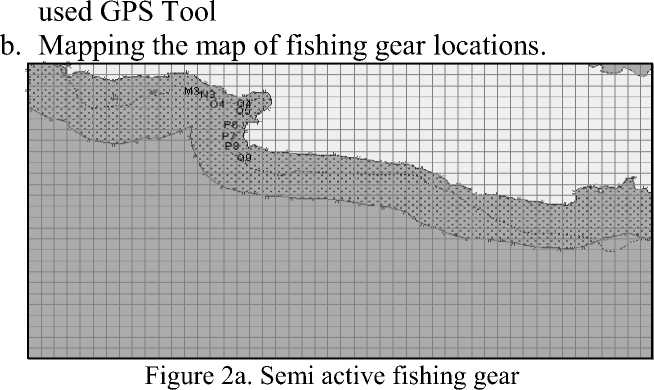
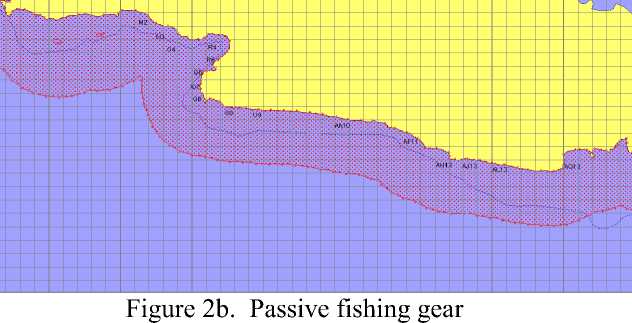
Process of Fishing Gear Data Locations are:
a. Tracking locations of fishing gear by local fisherman
Data Analysis
Validation Satellite data and In Situ data
Validation between in situ data and satellite data in the research location used Person correlation. For r2 ≤ 0.5, data is not valid and for r2 ≥ 0.5, data is valid.
Correlation Between Fisheries Data with Oceanography Condition
Classification of coastal fisheries zone is determined from scoring of Chl-a value, SST, and Ocean Current. Scoring of chl-a, sst and ocean current is to obtain the environment of sardine fishing ground. And it is classification by three categories that are high potential, medium potential and low potential.
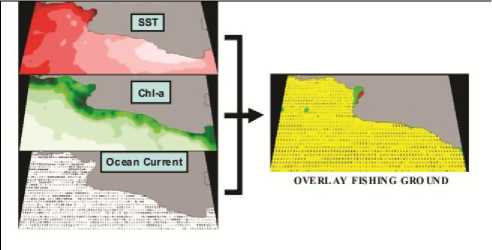
Figure 3. Overlay process 3 spatial data
To combine the data (Figure 3) was used GIS software that is Arc view GIS 3,3. Therefore, it can produce the data map of fisheries potential zone from overlay combination of Chlorophyll-a, Sea Surface Temperature and Ocean Current.
Research Instrument
-
1. Instruments researches that used in the study are:
-
2. A set complete computer, accompanied printer, and digital scanner
-
3. Ermapper, MapInfo, Arc view, Seadas-4 and of Microsoft Excel Software for attribute data analysis and examination of statistic
-
4. Fishing area map with map scale 1: 50.000, as
guidance taking the point of sample in field.
-
5. Global Position System (GPS) Version of Garmin 12 XL, for noted and determined coordinates in the location of research.
RESULT AND DISCUSSION
Oceanography Condition Data
Some of parameter oceanography in this research are ocean color represented by chlorophyll-a, sea surface temperature, and ocean current. These parameters were changed periodically every each monsoon.
Monsoon Condition
South West Java Sea is located in south of Province West Java, nearly with Indian Ocean. Two seasons that happened in this area have been influence the situation of oceanography and fisheries area. The seasons happened because influence of monsoon, which are West Monsoon, East Monsoon, and transition among both.
When relative position of the sun is on the north hemisphere from mid-March to mid-September, relatively dry winds blow over the archipelago from the southeast to the arid continent of Australia, and east monsoon characterizing dry season takes place on a large part of the archipelago. The dry season is generally prevailing from May to September.
-
a. West Monsoon Condition
Indonesia’s climate is changed from year to year as resulted of El Nino or Southern Oscillation (ENSO)
system. This system is associated with changes in sea surface temperature and atmospheric pressure across the tropical Pacific. When the central tropical Pacific to the east of Indonesia is warm (an El Nino phase), the normally abundant rainfall in Indonesia moves eastward, leaving much of the island nation in drought.
-
b. East Monsoon Condition
Dry season in Indonesia is usually become from June to October. The weather is more moderate between monsoons. The northern islands have only slight differences in precipitation during the wet and dry seasons, the southern islands east of Java have more sharply defined dry seasons, which increase in length with proximity to Australia.
Amount of irradiating of the sun at accepted by more summer of the ocean compared between the rains season. Condition of oceanography having the season that is temperature, current, and wind where each season is determines fish production c. Transition Condition
Transition is a time where the condition will be change because oceanography factor moving periodically and influence a climate so give impact to the area which crosses by oceanography factor. In April the first transition is the season from the rains season to dry season and in October, the second transition that is dry season to the rains season where climate change bring positive impact to sea surface temperature and nutrient in the sea, that condition ones is upwelling where determine a schooling fish area.
Satellite Data
Fishing ground map in this research determine by three kind of satellite data as chlorophyll-a, sea surface temperature and ocean current because that factors are very important for environment of sardinella, spp.
-
a. Chlorophyll-a
Five years of ocean color satellite data were also used in this study. The study selected five regions that represent the five edges of South West Java. Average value of chlorophyll-a in South West Java sea presented by Figure 4.
The input of nutrients to the system and resulting primary production may be a necessary condition for fish stock development, but may not be alone sufficient to yield high levels of fish stock productivity.
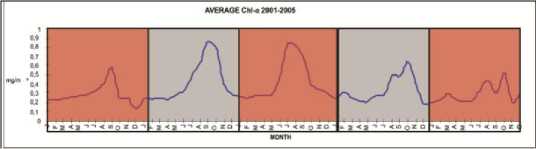
Figure 4. Average Chl-a 2001 – 2005
Average monthly temperature in South West Java is 23.8 °C - 30.2 °C (Figure 5). Which the maximum temperature have a rich nutrient from photosynthesis process of phytoplankton. The low temperature estimated by upwelling process.
AVERAGE SST 200 1-2 OOS
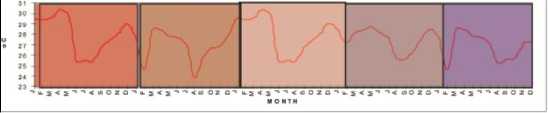
Figure 5. Average SST 2001 -2005
Fluctuation of average SST in 2001 - 2005 is shown in Figure 5. Where almost in April, value of SST is high and lower value in August.
The South Java Current is controlled by the monsoon over the Indian Ocean and Indonesian archipelago. Climatologically means that, situation it flows generally towards south-east along the coast during December -April (the Javanese North West monsoon season) and towards North-West along the coast during June - October (the Javanese south east monsoon season) and goes through periods of transition during two weeks in May and November. Typical current speeds during the two monsoon seasons are about 0.3 - 0.6 m/s (0.6 - 1.2 knots, or nautical miles per hour). Speeds increase to 2 - 3 times these typical values during the transition periods. During the Javanese South East Monsoon Season (June - October) the South Java Current is part of a coastal upwelling system
Fisheries Data
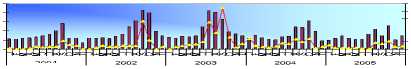
Collected data is on the seasonal variability of fish catches (sardinella,spp), and collected data is relation to around the South West Java Sea. This study uses five years fish-catch records collected at various points around south west Java that were selected from the best-quality harbor records. Data analysis shows that the annual fish-catch pattern is determined by monsoonal activity.
These coastal processes, which different for each region, influence fish catch and fish distribution. The natural fish stock of the entire Indonesian seas (including the Exclusive Economic Zone [EEZ]).
Fishing gear in the some regions not the same like lift net and surrounding net in south west java, sub provinces not all used because they have some reason for each local government. In this case in Pangandaran fishing base at 2003 until 2004 lift net used by fisherman but at 2005 was prohibited because area of coastal use for tourism area, and another case surrounding net not used because cost of one ship is very expensive.
Some environmental factor which influence fish catch area is sea surface temperature and plankton that overflows the sea surface, which is on generally also represent nutrient from small pelagic fish. Some parameter can be perceived directly by taking sample of water from the sea, and prediction of schooling fish then analyzed. Application of Remote Sensing as a means of environmental data compiler of terrestrial qualitative and also is quantitative, for relation of environmental factor elementary map and spatial data is very important to support the information of fishing ground data.
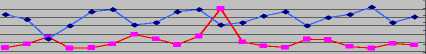
Correlation between SST and Chlorophyll -a By Monsoon
Correlation between SST with Chl-a
Chl-a SST
Jan- Apl- Jul- Okt- Jan- Apl- Jul- Okt- Jan- Apl- Jul- Okt- Jan- Apl- Jul- Okt- Jan- Apl- Jul- Okt-
Mrt Jun Sept Des Mrt Jun Sept Des Mrt Jun Sept Des Mrt Jun Sept Des Mrt Jun Sept Des
2001 2002 2003 2004 2005
Year
31
30
29
28
27
26
25
24
23
Figure 6. Correlation SST and Chl-a 2001 -2005 per three Month
For correlation Chl-a and SST at 2001 - 2005 show in July-September estimated of upwelling condition where temperature down chlorophyll-a up in figure 6 at 2001 and 2003 seen clearly at the east monsoon.
Correlation Between Fishing Effort And Satellite Data
By Monsoon
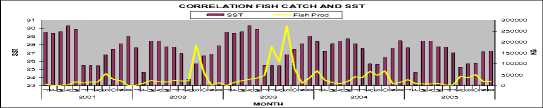
Figure 7. Correlation Fish Catch and SST 2001 -2005
In this research at 2001 - 2005 show that, fish production up when SST down as Figure 7, this condition was prediction influence by upwelling.
Correlation Fish Catch and Satellite Data
Chl-a Fish Prod
0,6
0,4
0,2
0
300000 250000 200000 150000 100000 50000
0
2001
Year
Figure 8. Correlation Fish Catch and Chl-a 2001 -2005
In figure 8 show at 2001 have correlation 0.82, in 2002 correlation is 0.76, in 2003 correlation is 0.78, in 2004 correlation is 0.6, in 2005 correlation is 0.71, from 2001-2005 can seen that, if concentration of chlorophyll-a up fish production up too, so need to more technology and more fishing vessel expected maximum operating in the area of fishing ground. .
CPUE
≡ 2001 □ 2002 □ 2003 □ 2004 ■ 2005
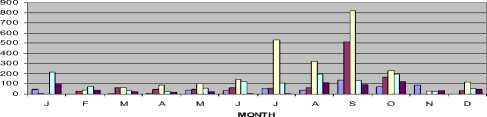
Figure 9. CPUE at 2001 -2005
For CPUE in this research, the high value is in 2003 and decrease in 2005 from another year as Figure 9. That mean fisherman must improve the fishing gear. so that is effective to get the fishing in the area of fishing ground even the low chlorophyll-a concentration and fish production down too. There are most exploitation, but not balancing with sustainable of environment close to the over fishing condition. For exploited sources of fish specially Sardinella, spp only Sub-province of Sukabumi have experience various of fishing gear so if west monsoon semi active fishing gear can operated more wide compare with passive fishing gear. Another Sub province in the South West Java only used gill net and trammel net (rampusan), and Sub-province of Ciamis use life net but not to long only one year at 2002 because the water territory focus to the tourism.
Statement from the production effect is in infrastructure development of fishery, education, training, technological, development processing and government industry are existence of the development fishery result change which initially at coastal fishery and have the character of subsistence, becoming free sea fisher to territorial water of Indonesia EEZ . ( Soepanto, 2001)
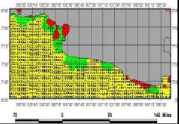
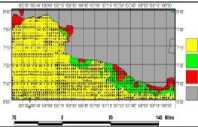
Fishing Ground Map
The factors influence area of schooling fish is the condition of physical ocean like temperature, salinities, ocean current and the other physical factor. Temperature is very important influencing of fish behavior in foraging, laying eggs even in conducting migration. Food is a factor that is easiest to be perceived and it is dominant of its influence at other oceanography factor.
For the reason food factor there have highest scoring in determining fishing ground area. Beside that, second factor is a temperature. Current is the third factor important in fishing gear operating, because there is appliance catch in this area, so the area cannot be told as fishing ground area. (Wudianto, 2001)
Classify of fishing ground started with process:
-
a. Classify of fishing ground from
This process is determination of value each physical as:
-
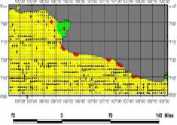
• Very Potential ( red on the map )
This area is very potential for the operating of fishing gear
-
• Potential ( green on the map)
This area is potential for the operating of fishing gear
-
• Low Potential (yellow on the map)
This area is low potential for the operating of fishing gear, included in this category is area which do not fulfill conditions there are fish
-
b. Preparation of physical parameter map
This Process is preparation of image from the parameter of fishing ground.
Table 1. Classify of scoring area fishing ground
|
Value Chl-a |
Code |
Value of SST |
Co de |
Ocean Current |
Co de |
|
≤0,2 mg/m³ |
1 |
≤ 23ºC, ≥ 31 ºC |
a |
≤ 0,2 , ≥0,7 m/sec |
x |
|
>0,2 - <0,7 mg/m³ |
2 |
>23ºC - <27ºC |
b |
>0,4 - <0,7 m/sec |
y |
|
≥0,71 mg/m³ |
3 |
>27ºC - <31ºC |
c |
>0,2 - <0,4 m/sec |
z |
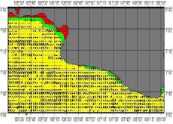
Scoring value of code in overlay map seen from Table 1, value 13 – 15 is Low Potential Zone by yellow color in the map, 16 – 17 is Potential Zone by green color in the map, and 18 – 19 is Very Potential Zone by red color in the map.
After reclass of the oceanography parameter as chlorophyll-a, sea surface temperature and ocean current, than the scoring process is to determine zone potential of operating fishing gear on the fishing ground area
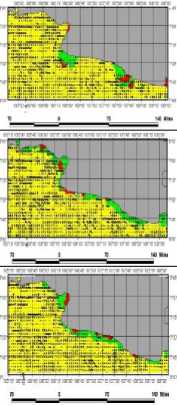
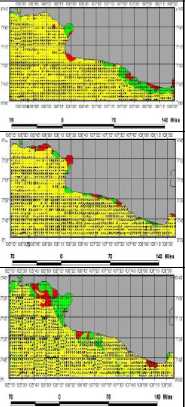
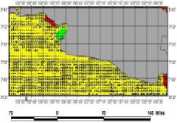
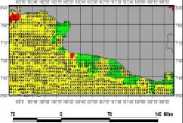
First extracted the oceanic environment of favorable fishing grounds from SST and Chl-a images on 2001-2005. Then extracted time-series changes from SST and Chl-a images obtain during 2001-2005. Finally overlaid the field map of fishing ground formation and the fishing gear operation map of fishing grounds, and masked the areas where all the conditions were overlapped. The image percentage that matches the conditions in Figure.11 is as follows:
-
1. Match up of the image from the total area extracted by fish environment of sardinella, spp.
-
2. When the conditions of locations where fishing grounds formed in the past were added to a): 63% average
match up in 2001-2005
-
3. When the extraction conditions of depth was added to b): 20% in offshore
CONCLUSION AND SUGESTION Conclusion
-
1) Condition of fishing effort influenced by monsoon and have characteristic as:
-
a. West Monsoon : November – March
-
• Ocean Current Strongly v ≥ 0,4 m/sec,average emperature is high, and fish productivity is
lower.
Table 2. Scoring area fishing ground
|
Code |
Scoring |
Code |
Scoring |
Code |
Scoring | |||||||||||||||
|
1 |
a |
x |
8 |
4 |
1 |
13 |
2 |
a |
x |
9 |
4 |
1 |
14 |
3 |
a |
x |
10 |
4 |
1 |
15 |
|
1 |
a |
y |
8 |
4 |
2 |
14 |
2 |
a |
y |
9 |
4 |
2 |
15 |
3 |
a |
y |
10 |
4 |
2 |
16 |
|
1 |
a |
z |
8 |
4 |
3 |
15 |
2 |
a |
z |
9 |
4 |
3 |
16 |
3 |
a |
z |
10 |
4 |
3 |
17 |
|
1 |
b |
x |
8 |
6 |
1 |
15 |
2 |
b |
x |
9 |
6 |
1 |
16 |
3 |
b |
x |
10 |
6 |
1 |
17 |
|
1 |
b |
y |
8 |
6 |
2 |
16 |
2 |
b |
y |
9 |
6 |
2 |
17 |
3 |
b |
y |
10 |
6 |
2 |
18 |
|
1 |
b |
z |
8 |
6 |
3 |
17 |
2 |
b |
z |
9 |
6 |
3 |
18 |
3 |
b |
z |
10 |
6 |
3 |
19 |
|
1 |
c |
x |
8 |
5 |
1 |
14 |
2 |
c |
x |
9 |
5 |
1 |
15 |
3 |
c |
x |
10 |
5 |
1 |
16 |
|
1 |
c |
y |
8 |
5 |
2 |
15 |
2 |
c |
y |
9 |
5 |
2 |
16 |
3 |
c |
y |
10 |
5 |
2 |
17 |
|
1 |
c |
z |
8 |
5 |
3 |
16 |
2 |
c |
z |
9 |
5 |
3 |
17 |
3 |
c |
z |
10 |
5 |
3 |
18 |
2 0
0
1
2
0
0
2
2 0
0 3
2
0
0
4
2 0
0
5
West Monsoon
Transition II
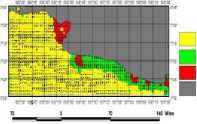
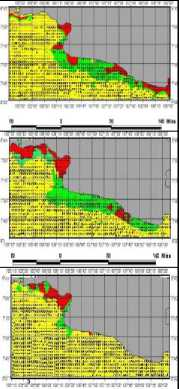
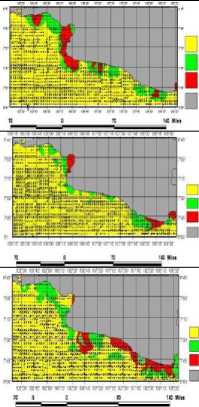
Figure 10. Environment for fishing grounds by overlay
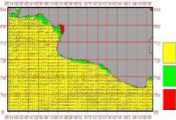

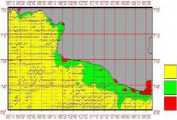
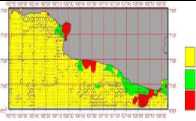
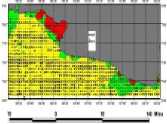
Figure 11. Prediction Map of Fishing Ground Sardinella, spp
Fishing Gear : Passive fishing gear (many fishing gear not operated) Semi active fishing gear ( only a few was operated)
-
b. West Monsoon : May – September
• Ocean Current Normal v ≤ 0,2 m/sec, average
Temperature is low and fish productivity is high Fishing Gear : Passive fishing gear (much fishing gear was operated)
Semi active fishing gear (much was operated)
-
2) Seen from overlay map of fishing ground in the obstetrical South West Java Sea concentration of nutrient from 2001-2005 tend to decrease meanwhile fish production increase, but seen from trend CPUE that condition of coastal fishery not yet maximum exploitation but this condition can be handling by fishing technology like use semi active fishing gear.
Sugestion
-
1) Oceanic environment of the favorable fishing grounds can be obtained with higher accuracy by increasing the number of comparative data between satellite data and fishing ground data, it is important to accumulate such data. The methods of this study should be applicable to other fish species and fishing methods.
-
2) Application of marine fisheries GIS to be expected can assist fisherman, local government and investor to plant exploiting of oceanic resource and fishery in South West Java Sea would be continuation.
REFERENCES
Direktorat Jenderal Perikanan, 1998. Potensi dan Penyebaran Sumberdaya Ikan Laut di Perairan
Indonesia. Komisi Nasional Pengkajian Stok Sumberdaya Ikan Laut. LIPI. Jakarta. 251 hal.
Hasyim. B. 2004..Penerapan Informasi Zona Potensi Penangkapan Ikan (Zppi) Untuk Mendukung Usaha Peningkatan Produksi Dan Efisiensi Operasi Penangkapan Ikan.(online)[cited 2007 Desember 23] available from : URL :
http://tumoutou.net/702_07134/bidawi_hasyim.2004. pdf
Sukresno, B. 2008. Dynamical Analysis of Banda Sea Concerning With El Nino, Indonesian through Flow and Monsoon by Using Satellite Data and Ocean Model. Thesis. UDAYANA University. Bali.
Sutanto, 1994. Penginderaan Jauh jilid I. Gajah Mada University Press. Yokyakarta.
Soepanto. 2001. Pilihan Investasi Sub Sektor Perikanan Menuju Kelestarian Su aya Ikan. dalam
Makalah Seminar Stock A ent di Malang, 28
April 2001.
Wudianto. 2001. Analisa Sebaran dan Kelimpahan Ikan Lemuru (Sardinella Lemuru Bleeker 1853) di Perairan Selat Bali. Kaitannya dengan Opimasi Penangkapan [Disertasi] Bogor.
33
Discussion and feedback