STUDY OF TOTAL SUSPENDED MATTER TRANSPORTATION AND CIRCULATION IN JAKARTA BAY USING NUMERICAL SIMULATION AND SATELLITE DATA
on
Ecotrophic ♦ 5 (1): 51 - 56 issn: 1907-5626
STUDY OF TOTAL SUSPENDED MATTER TRANSPORTATION
AND CIRCULATION IN JAKARTA BAY USING NUMERICAL SIMULATION
AND SATELLITE DATA
Luh Made Suriwati 1), Takahiro Osawa 2), Made Sudiana Mahendra 3)
-
1) Sekolah Luar Biasa-B Sidakarya Denpasar,
-
2) Center For Remote Sensing And Ocean Science,
-
3) Master Program of Environment Science Postgraduate Program Udayana University
ABSTRACT
Jakarta Bay lies in the north of Jakarta and receives freshwater run off from thirteen rivers that run through the Jakarta metropolitan area, a conurbation that is home to some 20 millions people.
Total discharges of organic water pollution have experienced a rapid increase from 214 tones per day in 1980 to over 537 tones per day in 1993. This is resulted to the high nutrient levels and eutrophication of coastal waters. Input pollutant in Jakarta Bay change the natural environment condition. Eutrophication has severe local impacts in the Jakarta Bay (GEF, 2008).
Study of TSM in Jakarta Bay was conducted during September 2008 to June 2009. The aims of this research were to investigate the transportations of TSM in Jakarta Bay MODIS satellite data was used and the current pattern circulation in Jakarta Bay.
Methods applied were MODIS satellite data analyses from 2003 to 2005 and numerical model 2-dimensional, for the insitu data of total suspended matter secondary data from LIPI in September 2004 was applied. To validate the result regression method was used.
Validation research results using MODIS satellite analysis showed the regression coefficient is R=0.72. Vector of current in Jakarta Bay in September 2004 experienced of the change direction and speed at each condition during spring condition at flood tide 1.23 m/s, highest tide 0.77 m/s, ebb tide 0.83 m/s, and lowest tide1.31 m/s and during neap condition at flood tide 0.71 m/s, highest tide 0.69 m/s, ebb tide 0.90 m/s, and lowest tide 0.34 m/s. Transportation of TSM in Jakarta Bay are dynamic, in dry season transportation of TSM higher than rain season.
Key words: Remote sensing, Total Suspended Matter, Jakarta Bay
ABSTRAK
Teluk Jakarta terletak di sebelah utara kota Jakarta dan merupakan muara dari tiga belas sungai yang mengalir melewati kota jakarta, yang memiliki jumlah penduduk sekitar 20 juta jiwa.
Jumlah pencemar bahan organik mengalami peningkatan yang sangat cepat dari 214 ton perhari (1980) menjadi 537 ton perhari (1993). Hal ini menyebabkan meningkatnya kandungan hara dan eutropikasi sehingga mengubah kondisi alami yang berdampak buruk bagi lingkungan Teluk Jakarta.
Studi mengenai total padatan terlarut di Teluk Jakarta dilaksanakan dari bulan September 2008 sampai bulan Juni 2009. Studi ini bertujuan untuk mengetahui transportasi dari total padatan terlarut di Teluk Jakarta dan untuk mengetahui pola arus di teluk Jakarta.
Metode yang digunakan berupa analisis data satelit MODIS tahun 2003 sampai 2005 dan model numerik 2-dimensi, sedangkan untuk data in-situ dari total padatan terlarut menggunakan data sekunder bulan September 2004 (LIPI) dan untuk validasi digunakan metode regresi.
Validasi yang telah dilakukan dengan menggunakan data satelit MODIS diperoleh nilai koefision regresi R=0,72.Arah dan kecepatan arus di Jakarta Teluk pada bulan September 2004 selalu berubah-ubah pada tiap kondisi dan kecepatan pada masing-masing kondisi selama bulan penuh yaitu saat pasang naik 1.23 m/s, pasang paling tinggi 0.77 m/s, pasang menuju surut 0.83 m/s, dan pasang terendah 1.31 m/s dan pada saat bulan mati saat pasang naik 0.71 m/s, pasang paling tinggi 0.69 m/s, pasang menuju surut 0.90 m/s, dan pasang paling rendah 0.34 m/s. Transportasi TSM di Teluk Jakarta selalu berubah, dimana konsentrasi TSM lebih tinggi pada musim kemarau dibandingkan musim hujan.
Kata Kunci: Pengindraan jauh, Total Padatan Terlarut, Teluk Jakarta
INTRODUCTION
Background
Jakarta Bay lies in the north of Jakarta and receives freshwater run off from the thirteen rivers that run through the Jakarta Metropolitan Area, a conurbation that is home to some 20 million people. With the expansion of the Jakarta Metropolitan Area during the second half of the 20th century, the environment of Jakarta Bay has been significantly affected by a range of human activities (Arifin, 2004).
Urban expansion and industrialization in Jakarta Bay have resulted in water pollution from industry, sewage, and contaminated air. Municipal and industrial wastewater is discharged virtually untreated into the waterways causing rapid deterioration of water quality, particularly in the large urban centers. Total discharges of organic water pollution have experienced a rapid increase from 214 tones per day in 1980 to over 537 tones per day in 1993. This is resulted to the high nutrient levels and eutrophication of coastal waters extending over a considerable distance as far as the Java Sea.
Input pollutant in Jakarta Bay change the natural environment condition. Eutrophication has severe local impacts in the Jakarta Bay, where massive blooms of phytoplankton several meters thick are present for several kilometers offshore. Overall, solid waste poses a severe problem, particularly around cities where waste management is unable to keep pace with production. Massive amounts of plastic bags and other waste products flow into Jakarta Bay (GEF, 2008).
The largest proportion of solid wastes released, which is predominantly organic carbon and nitrogen, settles to the seabed in the immediate vicinity of the farm. Organic enrichment of the benthic ecosystem may result in increased oxygen consumption by the sediment and formation of anoxic sediments, with, in extreme cases, out gassing of carbon dioxide, methane and hydrogen sulphide, enhanced demineralization of organic nitrogen and reduction in macro fauna biomass, abundance and species composition. There is evidence of very localized effects of reduced concentrations of dissolved oxygen in bottom and surface waters close to farm sites which are due to the considerable biochemical oxygen demand of released organic wastes and the respiratory demands of the cultured stock.
Change of natural condition in Jakarta bay can make degradation of wetland habitats. Coastal wetlands such as mangrove swamps are amongst the most productive ecosystems sustaining the ecological integrity and productivity of adjacent coastal waters, and are important breeding and nursery grounds for many commercially exploited fish and shellfish species (FAO, 2008). Based on
this description, the writer is interested to do this research with the image satellite data and model of numeric simulation.
RESEARCH METHODS
Research Scheme
This research applies in-situ data and satellite image. Satellite images are obtained from MODIS NASA during 2003 to 2005 and in-situ data of TSM was used secondary data from LIPI in September 2004. The scheme of research is
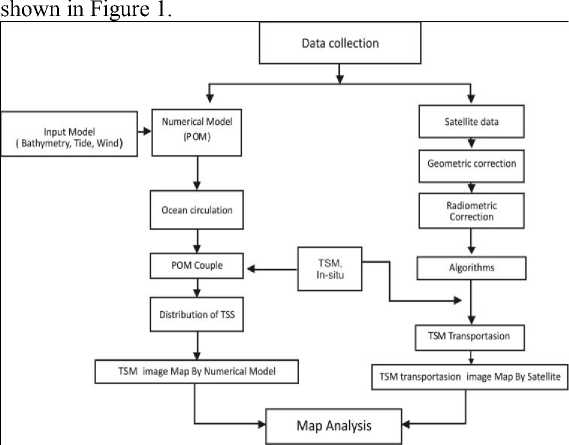
Figure 1. Research scheme
Research Location
This research was conducted in Jakarta Bay, located in the west part of Java Island (106o 20’ and 107o 03’ east longitude, and from 5o 10’ to 6o 10’ south latitude E) 5298.03 Km2. Location of Jakarta Bay is shown in Figure 2.
Data Analysis
Calculation TSM from Satellite Data
Research TSM in Jakarta Bay used data satellite which was verificated with the secondary in situ data on 18 points of samples data. As for calculation phase of image data processing was taken as follows:
-
a. Bowtie correction.
-
b. Image rectification.
-
c. Band Combination.
-
d. Contrast enhancement.
After passing the step hereinafter image data serve the purpose of elementary map and substance analyze to continue (Zhou et al., 2005). For image MODIS-Aqua used algorithm from Tassan,1994 that is :

Figure 2. Location of Jakarta Bay
log( S) = 1.83 + 1.26log( Xs )
Xs = [ R (λ) + R(Λ)][R (λ)/R (A)]-05
Where :
-
λ = spectral. region. green
-
λ = spectral. region. yellow
-
A6 = specral.region .red
S = TSM Concentration
Numerical Simulation of Sediment Distribution
The Hydrodynamics Model
The movement of the water mass in the area of the coast that was generated by the rise, fall tide and the wind generally depicted with the eternity law of the momentum and the eternity of the mass. In the coordinate system kartesian two dimensions, the condition for hydrodynamics could be in the area of the coast depicted with the equality of the continuity: ^ -∣- ⅛∆2 ∣ ⅛⅛ — Q t x y
The equality of the movement in the direction of x and y:
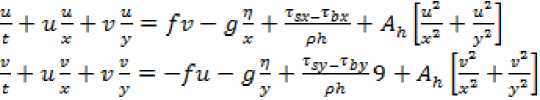
Where :
u = the speed of the flow in the direction of x (m/s)
v = the speed of the flow in the direction of y (m/s)
= sea surface elevation (m)
h = the depth of the total waters (m)
f = coriolis parameter (sec-1)
Ah = eddy's viscosity coefficient horizontal (m2/s)
g = the acceleration of earth gravitation (m/s2)
ρ0 = the density of water (kg∕m3)
τsx and τsy = stress their respective surface for the direction x and
the direction y (N/m2 )
τbx and τby = stress their respective foundation for the direction x
and the direction y (N/m2)
The form of the equality of the basic friction that was used in the model was:
tbx = rrus[^^v^ tby = rrvλ∕(^ + ^)
With the price of the coefficient of the basic friction around r = 3 x 10⁻³.
Eddy's viscosity coefficient horizontal (Ah) stated the level of turbulence of the water body. The value determination was from this coefficient matched with the measurement grid and the model and the depth bathimetry the area of the model.
The horizontal grid is in the Cartesian coordinate system and the staggered grid arrangement for the external mode is depicted in Figure 3.
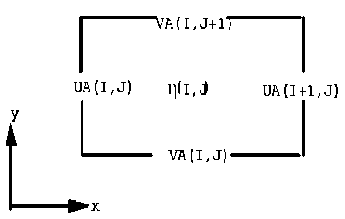
Figure 3. The 2-dimensional external mode grid
In this research, the horizontal grid contained 72 x 110 grid points and value of dx = 500 M, dy = 500M.
RESULTS AND DISCUSSIONS
Results of TSM(3.d1i)stribution in Jakarta Bay during 2003 until 2005 by using MODIS Satellite data, in rainy season and dry season can shown in Figure 4.
The result of research using MODIS satellite data shown that highest concentr.ation of TSM mostly in near coastal area. It’s indicated (t3h.a3t) pollution of suspended mostly near coastal area
Tide
In current process, four point movement periods was selected. Those are flood tide, highest tide, ebb tide and lowest tide. The result is shown as follows:
Current pattern (Spring)

Figure 5.Current Pattern in Flood Tide with Maximum Velocity 1.23 m/s

Rainy Season 2005
Figure 4. Transportation of TSM In Jakarta Bay

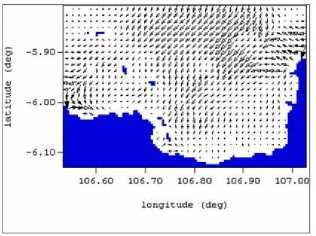
Figure 6. Current Pattern in Highest Tide with Maximum Velocity Figure 7. Current Pattern in Ebb Tide with Maximum Velocity 0.83 m/s 0.77 m/s

Figure 8. Current Pattern in Lowest Tide with Maximum Velocity 1.31 m/s
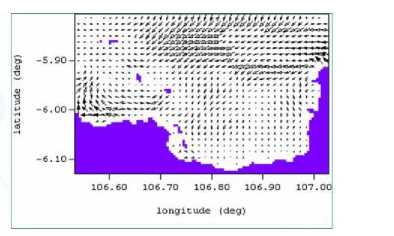
Figure 12. Current Pattern in Lowest Tide with Maximum Velocity 0.34 m/s
The current condition in Jakarta Bay when spring indicated that detection of current mostly from northeast and maximum velocity when spring condition was in Lowest Tide are 1.31 m/s.
Current pattern (Neap)
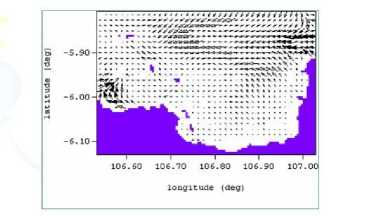
Figure 9. Current Pattern in Flood Tide with Maximum Velocity 0.71 m/s
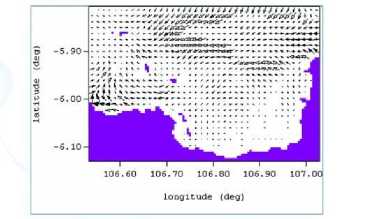
Figure 10. Current Pattern in Highest Tide with Maximum Velocity 0.69 m/s

Figure 11. Current Pattern in Ebb Tide with Maximum Velocity 0.90 m/s
The current condition in Jakarta Bay when neap indicated that detection of current mostly from northeast but the direction different with spring condition and maximum velocity when spring condition was in Ebb Tide with Maximum Velocity 0.90 m/s
Pattern of TSM from Satellite Data
Using MODIS satellite TSM distribution in Jakarta Bay Observed shows that the highest concentration distribution of TSM, accumulate mostly near coastal area because, of many industrial in coastal area and because the river accumulate in coastal area
Result of observation revealed that concentration TSM range from 9.200 mg/L until 37.167 mg/L, in which the tolerant limit of sediment specified by the government is 70 mg/L. The result indicate that TSM concentration in Jakarta Bay in September 2004 were under limitation and still can tolerance
Distribution of TSM using satellite MODIS by comparing result of perception with the satellite and result of secondary data (LIPI, 2004), obtained a relatively good correlation the value of regression coefficient are R=0.72
REGRESSY
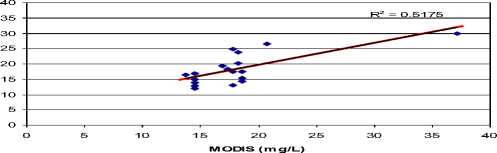
Figure 13. Regression of TSM with In-situ Data
CONCLUSION AND SUGGESTION
Based on the result of this research, the conclusion could be suggested as follows:
Based on the results of this research, the conclusion could be as follows:
-
1. The highest TSM transportation in Jakarta Bay was in
coastal area and the regression coefficient (18 sample
points) was R=0.72. Total suspended matter distribution using modis satellite showed the concentration of TSM was high during dry season ( April-October ) and low during rainy season (October-April).
-
2. Vector of current in Jakarta Bay in September 2004 experienced of the change direction and speed at each condition during spring condition at flood tide 1.23 m/s, highest tide 0.77 m/s, ebb tide 0.83 m/s, and lowest tide1.31 m/s and during neap condition at flood tide 0.71 m/s, highest tide 0.69 m/s, ebb tide 0.90 m/s, and lowest tide 0.34 m/s.
Suggestion
-
1. MODIS Satellite with the resolution of 4 km could examine the environment condition well, but in the narrow area it is not really possible, so for a better and more accurate result the highest satellite accuracy should be used.
-
2. The result of the research is expected to give a contribution to Jakarta government in determining policies about the environmental monitoring and pollution control such us:
-
a. For the further research should be used the latest satellite image, to improve the level of accuracy data.
-
b. Pollutant better be processed before thrown to environment.
REFERENCES
Arifin Zainal, 2004. Condition And Trend Of The Greater Jakarta Bay Ecosystem, Ministry of Environment, Republic of Indonesia, Jakarta.
FAO, 2008. coastal aquaculture and the environment.(serial online), [cited 2008 May. 27].Available from : URL:
http://www.fao.org/docrep/T0697E/t0697e04.htm.
GEF, 2008, Environmental Management for the Seas of East Asia.Dis.(serial online),[cited 2008 May. 27].Available from : URL:http://gefweb.org.
LIPI, 2004. Penelitian Kondisi Lingkungan Perairan Teluk Jakarta dan Sekitarnya, LIPI, Jakarta.
NASA, 2007. About MODIS Design. (serial online), [cited 2008 May. 11]. Available from :URL: (http://terra.nasa.gov/About/MODIS/about _modis.html).
Tassan, S.1994.Applied Optic volume 33.Opical Society of America. America. Page 2369-2379.
Zhou, W., Wang, S., Zhou ,Y. & Troy A. (2005). Mapping the concentrations of total suspended matter in Lake Taihu, China, using Landsat-5 TM data. International Journal of Remote Sensing Volume 27, No. 6, March 2006
57
Discussion and feedback