STUDY OF TOTAL SUSPENDED MATTER DISTRIBUTION USING SATELLITE DATA AND NUMERICAL SIMULATION IN PORONG SIDOARJO, EAST JAVA
on
ECOTROPHIC ♦ 5 (1) :57 - 62
ISSN: 1907-5626
STUDY OF TOTAL SUSPENDED MATTER DISTRIBUTION USING SATELLITE DATA AND NUMERICAL SIMULATION IN PORONG SIDOARJO, EAST JAVA
Herman1), Takahiro Osawa2), and I W Arthana3)
-
1) Senior High School Majene West Sulawesi
-
2) Center of Remote Sensing and Oceanography Udayana University
-
3) Master Program of Environment Science Postgraduate Program Udayana University
ABSTRAK
Sedimentasi merupakan salah satu peristiwa dalam proses pantai yang dinamis. Sedimentasi yang terjadi dalam banjir lumpur di Porong Sidoarjo merupakan peristiwa penting untuk diketahui sebagai referensi mengatasi bencana secara berkelanjutan. Pengamatan terhadap laju sedimentasi pada banjir lumpur, Sidoarjo memerlukan data lapangan dan teknik pengolahan yang teliti, untuk mengetahui secara detail laju sedimentasi dan penyebab dari terjadinya sedimentasi yang mengakibatkan banjir lumpur dalam jumlah besar. Untuk itu dirasakan perlu dipelajari laju sedimentasi dengan menggunakan metode yang relatif cepat dan dengan tingkat ketelitian yang dapat dipercaya. Salah satu teknik yang dapat dipergunakan adalah teknik penginderaan jauh (remote sensing) dibandingkan dengan simulasi model numeric dan pengamatan data lapangan.
Penelitian dilaksanakan di sungai Porong Sidoarjo Provinsi Jawa Timur pada bulan Agustus 2008 dengan posisi 7°30’ S - 7°40’ S and 112° 30’ E - 113°30’ E. Untuk mengetahui pola distribusi TSM dari citra satelit digunakan algoritma yang diperkenalkan oleh Zhou dan Kutser.
Pola TSM dari citra satelit Landsat and Modis memperlihatkan bahwa distribusi TSM yang berasal dari Sungai Porong kemudian akan terakumulasi menuju arah muara. Tetapi konsentrasi akan semakin mengecil pada daerah yang jauh dari muara. Ini diakibatkan oleh adanya pengaruh dari arus pasang surut yang terjadi di Selat Madura.
Dari hasil simulasi model terlihat sebaran sedimen dipengaruhi oleh pola arus yang dibangkitkan oleh pasang surut. Pada kondisi menuju pasang dan pasang tinggi, dimana arus bergerak ke arah hulu, sedimen di muara Porong cenderung tertahan dan mengendap di daerah muara. Sedangkan pada kondisi menuju surut dan surut rendah dimana arus bergerak ke arah hilir angkutan sedimen yang keluar dari muara akan maksimal. Pola arus yang cenderung bergerak ke arah selatan di pesisir Porong mengakibatkan konsentrasi sedimen yang keluar dari muara Porong akan terbawa ke arah selatan. Adanya alur di depan mulut muara Porong kemungkinan merupakan salah satu penyebab mengapa sebaran sedimen cenderung bergerak ke arah selatan.
Kata Kunci : Sedimen, Penginderaan Jauh, Simulasi Model
ABSTRACT
Sedimentation is one of coastal dynamic processes. Sedimentation in the mud volcano of Porong at Sidoarjo is an important phenomena to be known as a reference to find out a good solution in the tragedy of mud volcano eruption. Observation of the sedimentation process in the mud volcano eruption of Porong Sidoarjo needs in situ data and data processing technique to know of more details about sedimentation process and the main cause of the sedimentation and the large mud volcano eruption. Therefore, studying of sedimentation process needs the quick timing and high accuracy method. One of the technique which can be used is remote sensing method compared with numerical model and in situ data oservation.
Study area is in the Regency of Porong Sidoarjo Province of East Java on August 2008 in position of 7°30’ S -7°40’ S and 112° 30’ E - 113°30’ E. The aim of this study is to know the pattern of TSM distribution from satellite image using the algorithm which was introduced by Zhou and Kutser.
The pattern of TSM from the Landsat and Modis satellite images show that the TSM distribution from the porong river, will then accumulate to the estuary. But, the concentration will decrease in the area that is far from the estuary. This is caused by the influence of the tide current in the Madura strait.
From the simulation model was shown that the sediment distribution is influenced by pattern of current generated by tide. High tide where the current move to the upstream sediment in the porong estuary, the sediment was then accumulated in the estuary area. However, at low tide where the current move to the downstream, sediment transportation will move out from the estuary at the maximum level. The pattern of current shows that the moving is to the south direction in the porong coastal that will cause the sediment concentration that out from the porong estuary will
go to to the south direction. The water flow in front of the mouth of porong estuary maybe one of the cause why the sediment distribution tend to move to the south direction.
Keyword: Sediment, Remote Sensing, Model Simulation
INTRODUCTION
Mud volcano eruption in Porong Sidoarjo, is a disaster which is resulted from accident in human industrial activity. To minimalist the impact of this disaster to the environment society some alternative solution is to flood the mud to the Porong River. Porong River flow is a one of significant fluvial outlet carried the mud sediments. And then accumulate it in the Madura Strait and make the Madura Strait shallow than before.
Condition of Madura Strait is complex, because some river which is inlet in there bring material of suspended sediments like mud, smooth sand and microorganism, and most of all caused by erosion process. The Increasing of sediments concentration in most of river which is accumulating in Madura Strait, especially high debit water in the river, will increase sedimentation and turbidity in Madura Strait.
Sedimentation process depends on coastal dynamic. In situ observation for the sedimentation process in Madura Strait is requiring time and high cost. Therefore, to study of sedimentation need the quick timing and high accuracy method.
Remote sensing data is applicable to know the sedimentation level as turbidity level. And using data of satellite image supported by the sea water in situ data and hydro oceanography data (e.g. wave, ebb, and current) are expected to acquired a map of total suspended sediment in Porong River and also manipulate its simulation in the model.
The aims of the research are : a) to detect the pattern of TSM distribution using satellite data; b) to detect the pattern of coastal current using numerical model and c) to validate the pattern of TSM derived from satellite data and pattern of current from numerical model.
RESEARCH METHOD
This research was conducted in Porong Sidoarjo Provinces of East Java with specific location 7°30’ S -7°40’ S and 112° 30’ E - 113°30’ E.
In this research used Secondary data. Secondary data is data that have been compiled ini the form of document (as Seacorm Ministry of Fisheries and Marine, Meteorological and Geophysical Agency).
In this research, secondary data required were : bathmetry data, tidal elevation and wind data.
Instrument to be used in this research were :
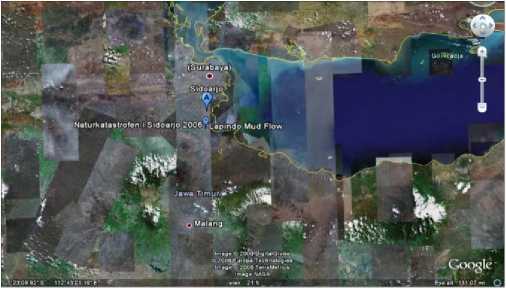
Figure 1. Research Location, Source: Google Earth (2008)
-
a. Hardware, that is in the form of computer, with specification AMD Turion 64 x 2 TL-60, Hard Disk 160 GB, Memory DDR 1 GB.
-
b. Software, there are in the form of Er Mapper 7,0, Arc View 3.3, Fortran 6, Transform version 3.3, Microsoft Office
Data Analysis
Calculation TSM from satellite data
Research TSM in Porong River use the satellite data which verification with the field data (in situ). TSM data from laboratory analysis on 16 stations of sampling data was collected in Porong River Estuary for 2007. As for phase of calculation of image data processing is taken as follows:
-
- Image rectification, is image registration so that information exists in image having the geographical coordinate. Reference used for the rectification of this image is control point residing in study location
-
- Band Combination, is the election of wavelength combination at image appearance so that obtained a more clear appearance
-
- Contrast enhancement, is process the arrangement assess the contrast at image appearance so that obtained a more fair image appearance
After passing the step hereinafter image data serve the purpose of elementary map and substance analyze to continue (Zhou et al, 2006).
TSM = - 40.41 + 1640 TM3
Where :
TSM : Total Suspended Mater (mg/l)
TM3 : The atmospherically corrected TM3 data (Band 3)
Whereas for image Modis-Aqua use algorithm from Kutser (2007) that is :
TSM = 707.95*B1
Where :
TSM : Total Suspended Mater (mg/l)
B1 : MODIS band 1 reflectance (Rrs)
Numerical simulation of sediment distribution The Hydrodynamics Model
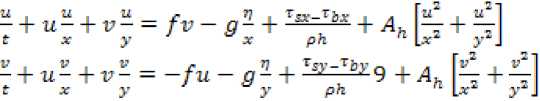
The movement of the water mass could be in the area of the coast that was generated by the rise and fall and the wind generally depicted with the eternity law of the momentum and the eternity of the mass. In the co-ordinate system kartesian two dimensions, the condition for hydrodynamics could be in the area of the coast depicted with the equality along with: the Equality of the continuity:
(1.1)
The equality of the movement in the direction of x and y:
Where :
u = the speed of the flow in the direction ofx
v = the speed of the flow in the direction ofy
h = the elevation of the face of sea water(m)
h = the depth of the total waters (m)
f = coriolis parameter ( det-1 )
Ah = Eddy's viscosity coefficient horizontal ( m2/det )
g = the acceleration of earth gravitation ( m/det2)
ρ0 = the density of water ( kg/m3)
τsx and τsy = stress their respective surface for the
direction x and the direction y (N/m2 )
τbx and τby = stress their respective foundation for the
direction x and the direction y (N/m2)
The distribution model of sedimentation
After getting the pattern of the flow of being based on the hydrodynamics model, the further step was to count the concentration of sediment in waters. The equality of the organiser adveksi-diffusion that was used in the transport model of this sediment was the form of the public from the equality of the transport adveksi-diffusion 2 horizontal dimensions, that is:
Where :
C = the concentration of local sediment (mg/l)
u and v =the speed of the fluid in the direction of x and y (m/det)
Kx and Ky =the dispersion coefficient in the direction of x and y (m2/s)
ϕ = fluks the resuspension that was regarded as the erosion (kg
m-2 det-1)
ϕs =fluks the sedimentation that it was considered as deposisi (kg m-2 det-1)
h = the depth of total waters (h = ho + η) (m)
RESULT AND DISCUSSION
Pattern of TSM from Satellite Data
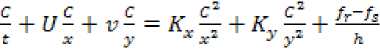
Image sediment interpretation can be done after correction process and the others steps. Image presentation after it is processed, can be shown in Figure 2 below:
a. Landsat Satellite b. Modis Satellite
Figure 2. TSM Dis.tribution From Satellite Image
In Figure 2a, the blue line indicates the river position, and dark yellow, yellow, light yellow and green are successively as high(1, .3m)edium and low water sediment concentration. Concentrations of TSM in research location vary with the fluctuation of 65 mg/l to 200 mg/l. Maximum concentration was located at the estuary of Porong River. The minimum concentration was separated in the center of Porong area or far from the river. In the estuary of Porong River area, TSM was 68.24 mg/l to 76.53 mg/l meanwhile at the location that far from river estuary varied of 44.31 to 53.86 mg/l.
Meanwhile the result of Modis image data processing was shown at figure 2b. From processed MODIS-Aqua, the concentration of TSM in mouth of Porong River, southward and northward of Porong River were almost similar at the range of 31.67 mg/l – 71.74 mg/l, meanwhile at Madura strait was characterized by low concentration of TSM about 22.2 mg/l.
TSM from the Landsat satellite shows that the distribution from the Porong River then accumulates to the estuary. But, the concentration be lower in the area that far from the estuary. Because influence from the tide current in the Madura strait.
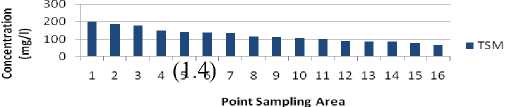
Figure 3. TSM Condition In Porong River
From the figure 3 above shows that the contain of TSM concentration from the upstream was lower to the estuary. TSM concentration in the research location has variation with the fluctuation from the 65 mg/l to 200 mg/l. This condition is correlated to in situ data with similar value TSM concentration. This reason was supported by Lubis (2006) that porong mud eruption is a
usual natural phenomenon in the earth. Naturally, the muds enter the bottom of sea trough the water slowly.
Generally the tide in the Madura strait have similar pattern to the tide in the java sea. In the porong estuary, this tide current factor is a factor that produces the current which moved in and moves out the estuary. This Current movement influence sedimentation zona smooths to the river. When the condition to the flood tide the current moved in the estuary, this current endures the sedimentation from the land. Therefore, mud sedimentation is sedimentated along the river. According to Ilahude (2006) estimated some mud flows of sediment moved around coast sidoarjo beach after mixing in the estuary caused by turbulence of wave activity and current in the porong estuary.
Pattern TSM from Numerical Simulation
Tidal Data Processing
Tidal data processed to obtain the tidal elevation references. Measurement tidal data as a sea surface
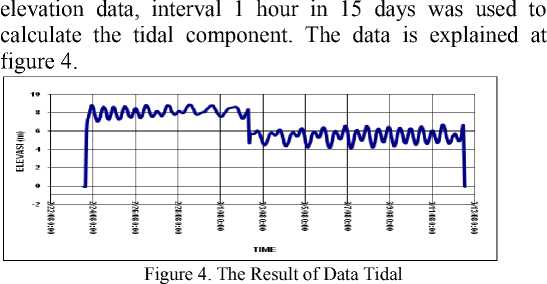
From Figure 4, there is data value not appear in the beginning data process and the end of data processing. It is caused by the install and removes the instrument data process. Meanwhile, error in the middle or the data record is cause by the transfer of data instrument to the superficial location because of instrument safety condition reason in measurement process.
Current Data Processing
Measurement of current in the porong coastal done during 19 days with the interval time is 60 minutes in a day. During this data measurement processed, current data was acquired in the form of spring tide and neap tide data. After data filteritation, in order to eliminate error data that caused by deployment processing and instrument released, the data result from the measurement processed is shown on Figure 5.
Mean current to the maximum depth in the range time during measurement is about 20 cm/s, where the current with the velocity held in the neap tide condition.
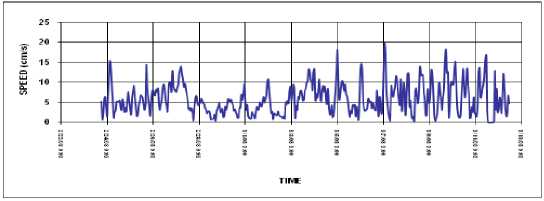
Figure 5. The Result of Data Current
The result from the hydrodynamic simulation and sediment distribution in the porong estuary can shown as belows :
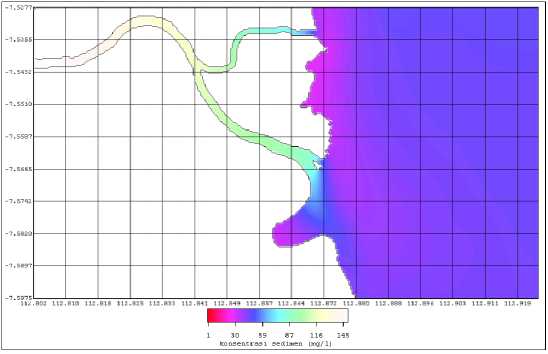
Figure 6. TSM Condition in Ebb Tide
Figure 6 shows condition ebb tide, where seen that sediment in the upper reachs of river has TSM concentration about 140 mg/l. To the down reachs of river will be down and in the near eastuary is about 70 mg/l.
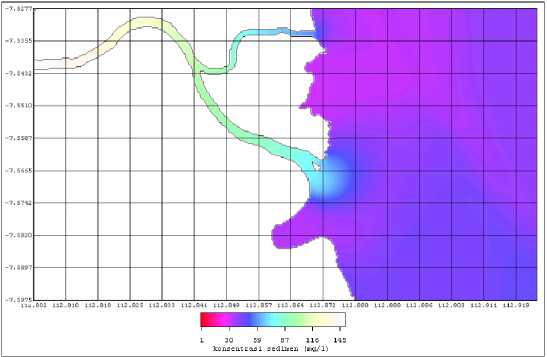
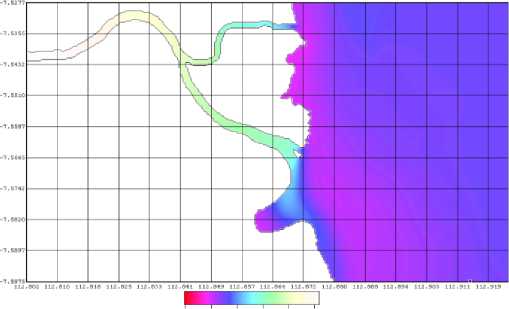
Figure 7. TSM Condition in Lowest Tide
Figure 7 shows the TSM distribution when the lowest tide condition. TSM from the porong river centered only in the near estuary with the concentration about 55 - 80 mg/l
1 30 59 07 115 145
Figure 8. TSM Condition in Flood Tide
Figure 8, showed flood tide condition. The sediment from the Porong River the spreading around of Madura strait to the west and south direction.
-
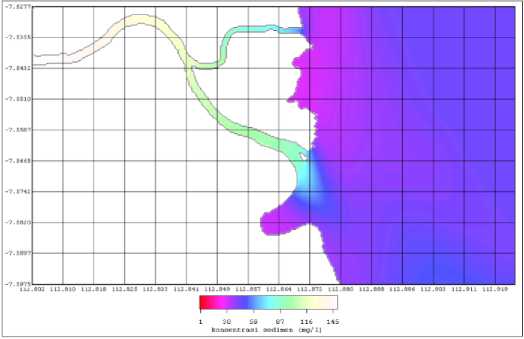
F igure 9. TSM Condition in Highest Tide
Figure 9 show the highest tide condition and, sediment falls in the mouth of porong estuary
From the result simulation, the estuary current and porong current moved in and the moving out follows the current tide in Porong area. In tide to flood tide condition and highest tide condition, estuary current and porong current move to upperstream. In ebb and lowest tide condition, current will move out the river.
From the result simulation, shows the sediment distribution influenced by pattern of current generated by tide. When the condition in flood tide and highest tide, the current is move to the upstream. The sedimentation in the porong estuary inclined endured and sedimented in the estuary area. The pattern of current inclined move to the south direction in the porong coastal caused the sediment concentration out from the porong estuary brought to the south direction. Flows in front of the mouth of porong estuary also caused the sediment distribution inclined move to the south direction. This condition related to the direction of sediment distribution will crowd around the estuary of porong rivers Ilahude (2006). Also supported by Lubis (2006), gravitation mud flows of porong is naturally
flow to the Porong River and Madura strait. Because the geomorphology formation of Porong River is a natural drainage to flow the water to the Madura strait
Correlation of Image Data Analysis to In Situ Data
Correlation analysis was used to know the relation between values of TSM obtained from the in situ data with TSM obtained from image analysis in the constan coordinate. Meanwhile, to know function relation between TSM in situ and TSM image used regression analysis. In TSM image data analysis used the image is Modis satellite data.
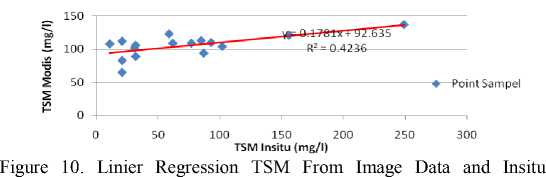
Measurement Data
Based on figure 10, the regression correlation between TSM in situ data and satellite data is y = 0.1781x + 92.635, R2 = 0.4236 and r = 0.65. This indicates that there is a correlation between TSM in situ data to satellite data. While after tested by Anova is got a significant value of 0,00632424
Based on the two patterns methodology there is an equal pattern. Where the TSM distribution from the upperstream will be accumulated in the estuary area on low tide condition. Meanwhile at high tide condition the TSM distribution was from the sea enter the river. But the two different curent directions will accumulate the TSM at the surrounding estuary area.
CONCLUSION
Conclusion
Based on the result of this research, the conclusion can be suggested as follows :
-
- The pattern of TSM distribution from image satellite shows that sediment from the upstream porong river moved to the side of the estuary that was resulted by the existence of the rise and tidal current.
-
- The TSM concentration in the research location varied, with the fluctuation between 65 mg/l and 200 mg/l.
-
- From numerical simulation was obtained that the pattern of the TSM distribution tends to be kept and deposited in the estuary, when the condition of flood tide and highest tide, the current was moving to the upstream. Meanwhile, in ebb and lowest tide condition, the current moved to the downstream.
-
- The current pattern that moves to the south area in the porong coastal area caused to the TSM distribution also moved to the south area.
Suggestion
-
- For the researchers, Landsat dan Modis satellite image could be used in an effort to know the TSM distribution pattern, because the level of accuracy in this method is good enough.
-
- For the further research should be used the latest satellite image, to improve the level of accuracy so it is getting closer to the in the in situ data.
REFERENCES
Bishop, J.M., 1984. Applied Oceanography. A Wiley-
Interscience Publication. Jhon Wiley and Sons. New York.
Blumberg, A.F and Mellor, G.L., 1987. A Discription of a Three Dimensional Coastal Ocean Circulation Model. American Geophysical Union, Washington DC.
Daya, M. 2004. Coastal Water Quality Monitoring with Remote Sensing in (East Kalimantan) Makassar Strait, Indonesia. International For Geo -
Information Science and Earth Observation Enschede, Belanda.
Hadi, S. 2003. Role of Numerical Modeling in Coastal Management, Proceedings Symposium on Coastal Zone Management. LPPM - Institute Teknologi Bandung.
Hendrawan, G., 2005. Barotropic Model to Calculate Water Circulation in Benoa Bay Bali. Thesis. Udayana University. Denpasar.
Howarth, M.J. and Pugh, D.T., 1983. Observations of Tides Over The Continental Shelf of North-West Europe: Johns.B.,editor. Physical Oceanography and Coastal and Shelf Seas. Elseiver Publishing Company Inc. Amsterdam.
Ilahude, D. (2006). Dinamika Arus Pesisir Pantai Pasuruan Mendorong Aliran Lumpur Sidoarjo ke Arah Utara Kali Porong. Paper Simposium Nasional. Institut Geologi Kelautan. Surabaya.
Kutser, T., Metsamaa, L., Vahtmae, E., and Aps, R. (2007). Operative Monitoring of the Extent of Dredging Plumes in Coastal Ecosystems Using MODIS Satellite Imagery. Journal of Coastal Research. SI 50 page 180 - 184.
Lubis, S., (2006). Mengalirkan Air Lumpur Sudah Siapkah Kali Porong dan Selat Madura Menerima Dampak Multiefeknya. Paper Simposium Nasional. Institut Geologi Kelautan. Surabaya.
Priyono, B., Frida S., Agung Y., Dwiyoga N. and Dendy M. 2007. Aplikasi Teknologi Pemantauan
Pencemaran Daerah Pesisir (Kasus Lumpur Sidoarjo). Laporan Akhir. Balai Riset dan Observasi Kelautan. Badan Riset Kelautan dan Perikanan. Departemen Kelautan dan Perikanan. Bali.
Zhou, W., Wang, S., Zhou ,Y. & Troy A. (2005). Mapping the concentrations of total suspended matter in Lake Taihu, China, using Landsat-5 TM data. International Journal of Remote Sensing Volume 27, No. 6, March 2006.
62
Discussion and feedback