STUDY OF POLLUTANT DISTRIBUTION IN BENOA BAY USING NUMERICAL SIMULATION AND SATELLITE DATA
on
Ecotrophic ♦ 3 (2) : 81-86
ISSN: 1907-5626
STUDY OF POLLUTANT DISTRIBUTION IN BENOA BAY USING NUMERICAL SIMULATION AND SATELLITE DATA
Komang Ardana 1), and M S Mahendra 2)
1) BLH Provinsi Bali
2w) Master Program Of Environmental Science Postgraduate Program Udayana University
ABSTRACT
Euthrofication that caused by nitrate and phosphate contamination and also sedimentation process is the main problem that took place in Benoa Bay Territorial water. The distribution of phosphate pollutant in Benoa bay territorial water was modeled by numeric of Princeton Ocean model (POM). The input of this pollutant model were a tidal current pattern, M2 tidal current residue, biological factor, physic and chemistry, that influenced pollutant concentration. Meanwhile, the sedimentation concentration was mapped with ALOS AVNIR-2 sensor image satellite and this image was analysed with statistic method (Linear Regression).
The result of phosphate modeling concentration was 0.1 mg/1 to 0.0022 mg/1, where the concentration was categorized very hazardous to the territorial water environment. Because the phosphate concentration in a pollutant resources was beyond the standard level of environmental quality, that was 0.015 mg/1 for fishery cultivation and also tourism activity (Bali Governor Regulation No.8th 2007). While, the direction of the distribution was affected by current pattern of movement, that was when the ebb level of high water moving into the bay and when the ebb to high tide moving out of the bay.
The result of statistic approaches with ALOS of AVNIR-2 censor can be used for mapping sedimentation distribution advantages in Benoa Bay. The values were: R2 Band 1 is 0.3839, Band 2 is 0.6123 and Band 3 is 0.5468. In this methodology, the correlation was not significant, due to, the quantity of in-situ data was small and the time research was not at the same time with satellite data.
Keywords: Tidal Current, M2 Residual, Phosphate pollutant and satellite image.
ABSTRAK
Euthrofikasi yang disebabkan oleh pencemaran nitrat dan fosfat serta sedimentasi merupakan permasalahan utama yang dihadapi perairan Teluk Benoa. Sebaran polutan fosfat di perairan Teluk Benoa dimodelkan secara numerik dengan menggunakan Prenceton Ocean Model (POM). Masukan model polutan ini adalah pola arus pasut, arus residu pasut M2, faktor biologi, fisik dan kimia yang mempengaruhi polutan, sedangkan sedimentasi dipetakan dengan menggunakan data citra satelit ALOS sensor AVNIR-2 dianalisis dengan menggunakan metode statistik (regresi linier).
Dari hasil pemodelan konsentrasi fosfat menunjukkan kisaran 0,1 mg/l sampai dengan 0,0022 mg/l, dimana konsentrasi ini cukup berbahaya bagi lingkungan perairan karena konsentrasi fosfat pada sumber pencemar telah melampui standar baku mutu lingkungan 0,015 mg/l untuk kegiatan budidaya perikanan dan aktivitas pariwisata (Peraturan Gubernur Bali nomor 8 Tahun 2007). Sedangkan arah penyebaran sangat dipengaruhi oleh pola pergerakan arus, yaitu pada saat air pasang konsentrasinya bergerak ke arah teluk dan pada saat surut ke luar teluk.
Hasil dari pendekatan statistik menunjukkan bahwa ALOS dengan sensor AVNIR-2 dapat digunakan untuk kepentingan pemetaan sebaran sedimen di perairan Teluk Benoa. Nilai R2 yang diperoleh masing-masing untuk Band 1 (0,3839), Band 2 (0,6123) dan Band 3 (0,5468). Pada pendekatan ini korelasi tidak signifikan, hal ini disebabkan data insitu yang digunakan relative kecil dan waktunya tidak bersamaan dengan data satelit.
Kata Kunci : arus pasut, residu M2, polutan fosfat dan citra satelit
INTRODUCTION
Benoa Bay area is a strategic area in south of Bali Province. This area is located in the corridor of city development, tourism zone, and centers of service in transportation regional and international, in other part it have the environmental ecosystem function because this area represent the place for estuary some river in south Bali and existence of Great Forest Garden (TAHURA) and also
the estuary area for some of river in Bali South area (Figure 1). With this strategic position area of Benoa Bay has own important role to materialization of structure and broader region space exploiting, and become the Bali barometer in the effort of function exploitation in space agriculture urban area, and also tourism support to environmental conservancy effort and also cultural conservancy, because this area has holy temple and holy area.
The rapid development activity in Benoa Bay Area is walk very fast and on the future it will be increase. And this is become the potency to the pollutant and the damage of environment system in this area. Bapedalda Provinsi Bali, 2003, reported that content phosphate in Tukad Badung river which have estuary in Benoa Bay is 1.09 ppm. Source of contamination territorial water in Bay Benoa can be classified from territorial water ( marine based pollution) and from continent ( land based pollution), it effect from uncontrolled the system of management industrial activity and sanitation urban causing most pollutant like phosphate, nitrate, heavy metal and others enter the territorial water through river stream. Until this time, there is no research about the Pollutant distribution and the mapping sedimentation using ALOS image satellite in Benoa bay, therefore the research about water condition is required to get information in order to keep the natural condition in this area.
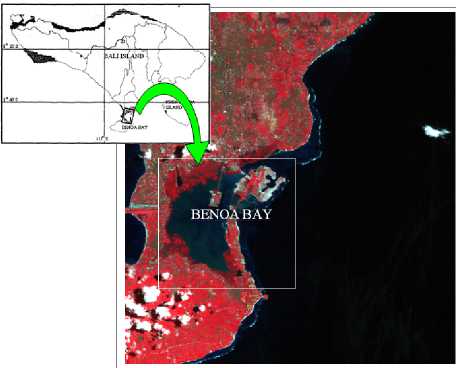
Figure 1 Model region (box line)
Table 1. The result of organic phosphate, Orto-phosphate and phytoplankton measurement on February 28th, 2008
|
Number of Sampling |
Latitude |
Longitude |
Organics Phosphat e |
Ortho Phosphat e |
Phytoplankton | ||||
|
o |
' |
" |
o |
' |
" |
mg/l |
mg/l |
mg/l | |
|
I.1 |
8 |
43 |
34 |
115 |
13 |
19.7 |
0.042 |
0.154 |
5.2181 |
|
I.2 |
8 |
43 |
36.7 |
115 |
13 |
20.9 |
0.057 |
0.297 |
5.5659 |
|
I.3 |
8 |
43 |
39.8 |
115 |
13 |
20.7 |
0.042 |
0.088 |
3.8266 |
|
II.1 |
8 |
44 |
42.3 |
115 |
12 |
40.5 |
0.036 |
0.011 |
1.8263 |
|
II.2 |
8 |
44 |
42.8 |
115 |
12 |
43.5 |
0.039 |
0.033 |
1.1306 |
|
II.3 |
8 |
44 |
44.2 |
115 |
12 |
45 |
0.037 |
0.044 |
0.7827 |
|
III.1 |
8 |
44 |
23.1 |
115 |
12 |
26.2 |
0.044 |
0.008 |
6.5226 |
|
III.2 |
8 |
44 |
23.2 |
115 |
12 |
25 |
0.051 |
0.077 |
4.0870 |
|
III.3 |
8 |
44 |
23.3 |
115 |
12 |
22.7 |
0.074 |
0.055 |
6.9575 |
|
IV.1 |
8 |
44 |
5.6 |
115 |
11 |
42.8 |
0.080 |
0.286 |
1.5654 |
|
IV.2 |
8 |
44 |
7.8 |
115 |
11 |
43.2 |
0.036 |
0.440 |
1.3915 |
|
IV.3 |
8 |
44 |
10.6 |
115 |
11 |
42.9 |
0.065 |
0.506 |
1.1306 |
|
V.1 |
8 |
44 |
20.5 |
115 |
11 |
22.4 |
0.101 |
1.056 |
3.2179 |
|
V.2 |
8 |
44 |
21.9 |
115 |
11 |
26.8 |
0.111 |
0.868 |
4.5224 |
|
V.3 |
8 |
44 |
24.4 |
115 |
11 |
31.9 |
0.129 |
1.044 |
4.0005 |
|
VI.1 |
8 |
47 |
14.2 |
115 |
13 |
13.3 |
0.071 |
0.308 |
3.4788 |
|
VI.2 |
8 |
47 |
13.7 |
115 |
13 |
12 |
0.135 |
0.835 |
3.0439 |
|
VI.3 |
8 |
47 |
12.7 |
115 |
13 |
9.2 |
0.169 |
0.527 |
3.7471 |
|
VII.1 |
8 |
45 |
21.2 |
115 |
13 |
43.7 |
0.064 |
0.176 |
3.6527 |
|
VII.2 |
8 |
45 |
23.4 |
115 |
13 |
47.5 |
0.067 |
0.187 |
3.8266 |
|
VII.3 |
8 |
45 |
24.6 |
115 |
13 |
50.2 |
0.068 |
0.319 |
3.1309 |
This research used external mode to compute twodimensional water circulation by the vertically integrated equations. The equations is presented as follows (Mellor, 1987):
∂η ∂UD ∂ VD
—— + ----+ ----
∂ t ∂ x ∂ y
2
+ + - Fx - fVD + gD = -< wu (0) > + < wu (-1) >
2
+ + - F + fUD + gD = - < wv (0) > + < wv(-1) >
(1)
(2)
Equations (1) and (2) are continuity equation and momentum equation, respectively, where:
D = H + η ; U, V are component of depth averaged velocity
10
for x-axis and y-axis, respectively, where U = Udσ
D -1
10
and V = V dσ, t-time, H-water depth; η-elevation; g-D-1
gravitation acceleration; f-Coriolis effect. We have ignored the Coriolis effect based on the Rossby Deformation
Radius (Pond and Pickard, 1985). Diffusivity terms are:
F x = — H 2 A ∂ x I
(3)
F y = TIh 2 A ∂ y L
+
∂ y I ∂ x
HAM
∂ U + ∂ V ^
∂ y ∂ x I
where: AM - horizontal diffusivity constant. The terms of <wu(0)> and <wu(-l)> are wind friction and bottom friction, respectively.
The horizontal grid is in the Cartesian coordinate system contained 40 x 80 grid points. The grid resolution is 125 m x 125 m. The external time step is 6 seconds based on Courant-Friedrichs-Levy (CFL) stability. The bathymetric data is obtained from Hydro-Oceanography Division-Indonesian Navy (DISHIDROS TNI-AL), which is bathymetric map no. 290 and ecosunder map Benoa Bay from PT. Persero Pelindo III Cabang Benoa.
In lateral boundary conditions, zero flow normal is applied to solid boundaries (the land), while along open boundary (the ocean) the radiation condition was applied for currents. Tidal elevation is given along open boundary using tidal prediction, which is based on tidal constituents from DISHIDROS TNI-AL (2003). Zero values is give at all grids as initial conditions.
The equation of transport pollutant phosphate is advection-diffusion two dimensional equations. The mathematic equation formulated in the following equation (Dian Noor, 2001):
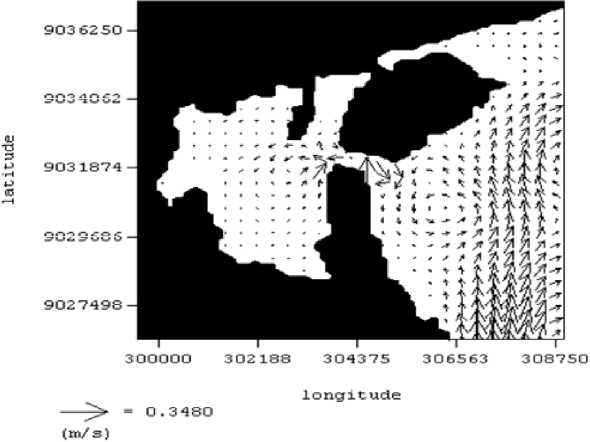
current is defined as the flow which is caused non-linearity of tidal current in relation to horizontal boundary geometry and bottom topography. The M2-component is use because its highest amplitude among tidal constituents in Benoa tidal station (DISHIDROS TNI-AL, 2003). The calculated M2-residual current is shown in Figure 4, The M2-residual current governs two eddies circulation anti-clockwise circulation occurred in and out the inner part of the bay.
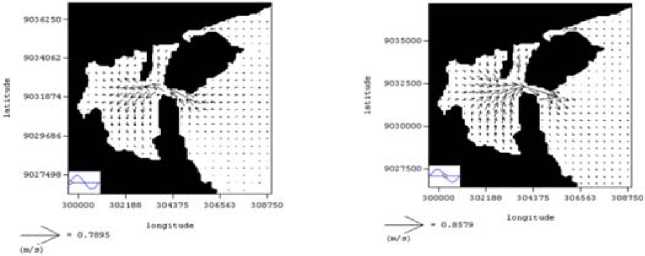
Figure 2. The calculated maximum velocity tidal current during spring tide: (a) Flood tide and (b) Ebb tide
∂ C ----+
∂ t
u
∂ C
+
∂ x
∂ C v
∂ y
K
x
∂ 2 C
∂ x 2 +
K ∂ 2 C
y ∂ y 2
where:
C = Local constantan (mg/l)
Kx,y = Coefficient disperse x and y direction (m2/sec.)
U,v = Velocity x and y direction (m/sec.)
S = Sources subroutines for phosphate
R = Kinetic process (suku reaksi).
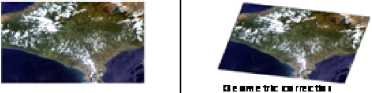
Satellite image is use to determine the turbidity / total suspended sediment at Benoa Bay. Satellite image use is ALOS satellite data by ANVIR 2 sensor. To determine turbidity / total suspended sediment level developed the
algorithms. Algorithms which is empiric developed by determine 9 field in-situ data measurement to make the regression with digital value on each visible band at AVNIR 2 sensor.
RESULTS
The calculated of tidal currents are shown in Figure 2. Generally, the water column flows into the bay trough flood tide current and outflows from the bay trough ebb tide current. The tidal current becomes strong when passing trough the narrow passage at surrounding of Serangan Island. The maximum velocity of ebb tide current (0.86 m/second) was faster than the maximum velocity of flood tide current (0.79 m/second) during spring tide. The same pattern was also shown during neap tide. The verification result showed the agreeable result, where the elevation pattern and amplitude was similar with field observation (Figure 3).
The residual flow is calculated by using tidal elevation of M2-component. The tide-induced residual
+ S + R
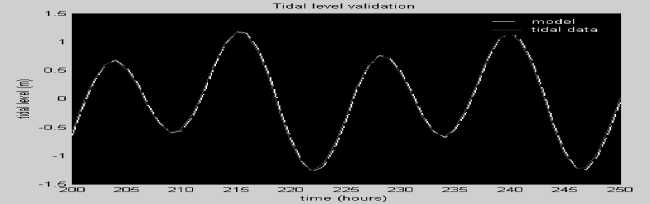
Figure 3. Tidal Level validation
The maximum velocity of M2-residual current can reach 0.348 m/second. The tendency of this eddies circulation is caused by geometric profile, which are the Peninsula and Serangan Island.
9034062
9029686
Figure 4 The calculated M2-residual current
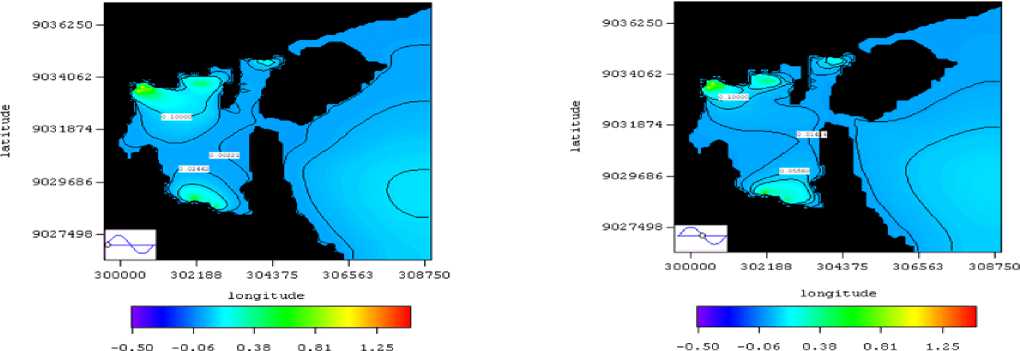
The result of modeling showed that the phosphate pollutant distribution was affected by current pattern movement (Figure 5). When tidal current pattern was rise,
the concentration phosphate was in the center of bay and the tidal current pattern is low, the concentration is away to the sea. The result of phosphate modeling concentration was 0.1 mg/1 to 0.0022 mg/1, where the concentration is very hazardous to the territorial water environment. Because the phosphate concentration in a pollutant resources has beyond standard level of environmental quality, that is 0.015 mg/1 for fishery cultivation and also tourism activity (Bali Governor Regulation No.8th 2007), concerning on standard environment system quality and
the criteria for environment damage. The role of biochemistry process and people activity in Denpasar City and Benoa Bay influenced to ecosystem in Benoa Bay territorial water.
The comparison result between Phosphate in-situ data and modeling result is almost similar, where the modeling result of phosphate pollutant distribution showed a consistent pattern comparing to the field observation result (Figure 6).
Phospace (mg∕l) Phospace (mg/L)
Figure 5 The calculated distribution pollutant phosphate at the maximum velocity tidal current during springtide: (a) floodtide and (b) ebb tide
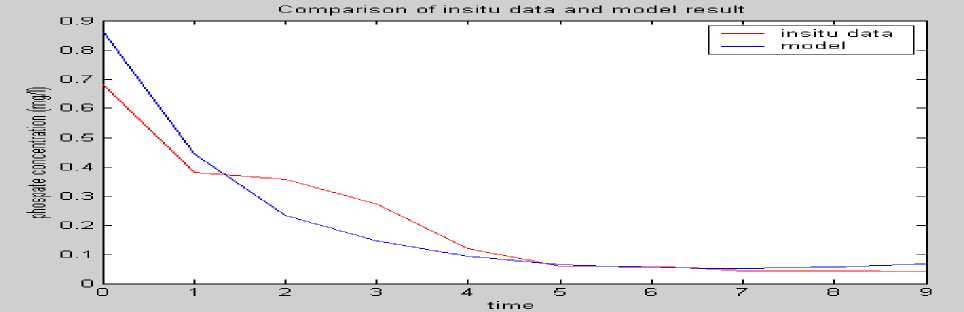
Figure 6.Comparison of in-situ data and mode result
TSM mapping uses a statistic methodology which is a direct and simple method. This method has been used by many researchers with different algorithm result. In this research, TSM data used was the result of laboratories analysis from in-situ field calculation TSM data of PT.Pelindo Indonesia III Benoa Office Subdivision, on December 5th 2006. Meanwhile Satellite image data used was ALOS AVNIR-2 sensor satellite image that was acquisition on 28th November 2006. The result of satellite image correlation is shown in Figure 7.
The result of satellite image processing data and recalculated TSM value from image satellite ALOS AVNIR-
2 sensor with field observation measurement data is shown in Table 2.
The result linier regression between TSM field observation calculations with digital number (DN) in each visible and infrared (VIR) band 1, band 2, and band 3 from ALOS AVNIR2 sensor is shown Table 3.
Based on Table 3, the best result of correlation (R2) TSM from Digital Number (DN) between VIR Band ALOS AVNIR2 sensors with field observation calculation was in Band 2. TSM distribution from band 2 algorithm application (figure 11) can show detail information to the turbidity that occurred in Benoa Bay territorial water.
ΛL□E AU NIR-2 ιe mr
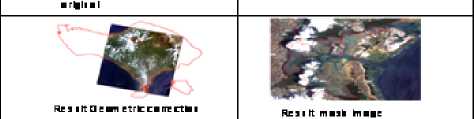
Figure 7. The result of satellite image correlation with ALOS AVNIR-2 sensor
Table 2: Value TSM In-situ relationship between digital number (DN) of VIR Band of ALOS AVNIR2 sensor
|
No. |
Coordinate |
TSM Insitu |
Digital Number | |||
|
Longitude |
Latitude |
(mg/l) |
B1 |
B2 |
B3 | |
|
1 |
115.13.30 |
08.44.32 |
48,92 |
129 |
140 |
144 |
|
2 |
115.13.05 |
08.44.32 |
89,43 |
148 |
167 |
163 |
|
3 |
115.12.35 |
08.44.30 |
24,75 |
114 |
99 |
78 |
|
4 |
115.12.37 |
08.45.15 |
36,47 |
69 |
73 |
63 |
|
5 |
115.12.30 |
08.45.10 |
38,35 |
75 |
66 |
50 |
|
6 |
115.12.12 |
08.45.12 |
47,38 |
88 |
102 |
108 |
|
7 |
115.12.14 |
08.44.32 |
37,88 |
102 |
103 |
105 |
|
8 |
115.12.09 |
08.44.12 |
37,93 |
102 |
104 |
108 |
|
9 |
115.12.33 |
08.44.03 |
37,78 |
112 |
110 |
114 |
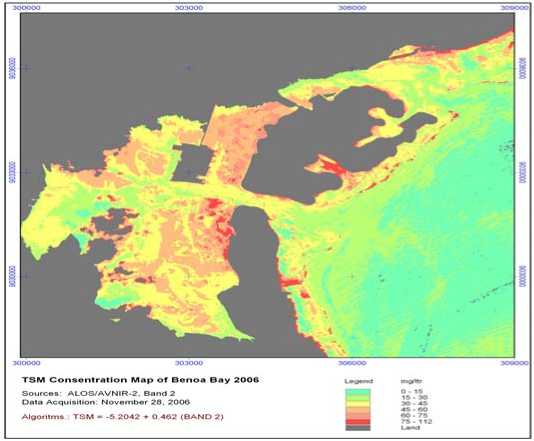
Figure 11. TSM Concentration Map of Benoa Bay 2006
Table 3 The algorithms of TSM Concentration of ALOS AVNIR2 sensor
|
ALOSAVNIR 2 sensor |
Algorithms |
R2 |
|
Band 1 |
Y = 0.4505x -2.6722 |
0,3839 |
|
Band 2 |
Y = 0.4624x -5.2042 |
0.6523 |
|
Band 3 |
Y = 0.3732x + 5.6326 |
0.5468 |
CONCLUSION AND SUGGESTION
Conclusion
-
1. Current pattern modeling in Benoa Bay using 2 dimension equation (external mode) POM, for the mean of the deep value was similar to in-situ data.
-
2. The maximum velocity of ebb tide current (0.86 m/second) was faster than the maximum velocity of flood tide current (0.79 m/second) during spring tide. The same pattern was also shown during neap tide.
-
3. Phosphate pollutant distribution modeling have a consistent pattern, comparing to the result of insitu calculation
-
4. The role of biochemistry activity process and human activity in Denpasar City and Benoa Bay territorial water influenced the ecosystem of Benoa Bay territorial water.
-
5. ALOS/AVNIR – had given a good mapping result on total suspended sediment distribution.
Suggestion
-
1. The next research should use 3 dimension hydrodynamics modeling, therefore influences of salinity and temperature to pollutant distribution could be identify.
-
2. To get a good result in sedimentation mapping in Benoa Bay ALOS ANIR-2 sensor is require and need support from in-situ data which at the same time with data of satellite.
-
3. Improve the observation of dismissal water waste. So, dismissal water waste that enters to the sea, trough the stream in spite of human activity along the river and other activity alongside in coastal bay is appropriate with environmental standard quality regulation
REFERENCES
Anonimus,2006, Dokumen Laporan Hasil Pelaksanaan Pengelolaan dan Pemantauan Lingkungan Hidup PT. Pelindo III Cabang Benoa.
Blumberg, A.F and Mellor, G.L. 1987. A Discription of a Three Dimensional Coastal Ocean Circulation Model. American Geophysical Union, Washington DC
Bapedalda Provinsi Bali, 2003 Laporan Status Kondisi Lingkungan Hidup Daerah Provinsi Bali.
Dian Noor, 2001. Model Numerik Dua Dimensi Penyebaran Fosfat di Perairan Pantai Banjar Kanal (Tugas Akhir). Fakultas
Ilmu Kebumian dan Teknologi Mineral Institut Teknologi Bandung.
DISHIDROS TNI-AL. 2003. Tide Tables of Indonesian Archipelago 2003. DISHIDROS TNI-AL. Jakarta
Pond dan Pickard, 1985. Introductory dynamical oceanography. Pergamon Press. UK
Peraturan Gubernur Bali Nomor 8 Tahun 2007, tentang Baku Mutu Lingkungan Hidup dan Kriteria Baku Kerusakan Lingkungan Hidup
86
Discussion and feedback