STUDY OF STATISTICAL CORELATION AMONG FISH PRODUCTION AND INDIAN OCEAN DIPOLE AND MONSOON IN WESTERN INDONESIAN SEA USING SATELLITE DATA
on
Ecotrophic ♦ 4 (1): 15 - 24
ISSN: 1907-5626
STUDY OF STATISTICAL CORELATION AMONG FISH PRODUCTION AND INDIAN OCEAN DIPOLE AND MONSOON IN WESTERN INDONESIAN SEA USING SATELLITE DATA
SUPRATMAN 1), AND I WAYAN ARTHANA 2)
Sekolah Menengah Kejuruan Negeri 1 Pelabuhanratu
Master Program of Environment Science Posgraduate Program Udayana University
ABSTRACT
Western Indonesian Sea especially Sumatra Sea, Sunda Strait, Pelabuhan Ratu Sea and Prigi Sea is a potential area for fisheries especially tongkol. Oceanography factors that influenced to the fisheries activity are Sea Surface Temperature (SST), Sea Surface Height (SSH), concentration chlorophyll-a (Chl-a), monsoon and Indian Ocean Dipole.
This research location is in Western Indonesian Sea. With coordinate is 97.00 E to 114.00 E, and 02.00 N to 11.00 S in period of 2002 to 2006. Spatial and temporal analysis SSH from Jason-1 Satellite, SST and chl-a from AQUA-MODIS satellite data set used to correlation with fish production. The correlation between Dipole Mode Index (DMI) and fish production is use also. SST and chl-a data processing by SeaDAS software, SSH derive from website NASA, DMI derived from website NASDA. Fish production data is from statistic fish production data.
The correlation value between fish production and SST in Sumatra Sea and Pelabuhanratu Sea is high with value -0.734 and -0.660. In Sunda Strait and Prigi Sea is low, with value -0.560 and -0.566. Meanwhile the correlation value between fish production and chl-a in Sumatra Sea, Sunda Strait and Pelabuhanratu are high and in Prigi Sea is low. The value in Sumatra Sea is 0.868, in Sunda Strait is 0.660, in Pelabuharatu Sea is 0.751 and in Prigi sea is 0.588.
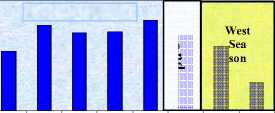
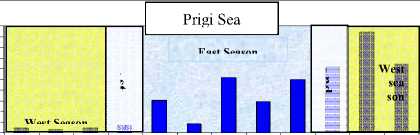
The fish production caught by fisherman influence by northwest monsoon (rainy season) and southeast monsoon (dry season). Fish production will decrease in rainy season, and increase at dry season.
The correlation value between fish production and DMI has a high correlation in Sumatra Sea, Sunda Strait and Pelabuhanratu Sea. Meanwhile, in Prigi Sea the corelation is low. Correlation value in Sumatra Sea is 0.851, in Sunda Strait is 0.656, in Pelabuhanratu Sea is 0.691 and in Prigi Sea is 0.463.
Key words : Western Indonesian Sea, sea surface temperature, Sea Surface Height, concentration chlorophyll-a, monsoon, Indian Ocean Dipole.
ABSTRAK
Perairan Indonesia Barat khususnya perairan Sumatra, Selat Sunda, Pelabuhanratu dan Prigi merupakan perairan yang potensial untuk kegiatan penangkapan ikan, khususnya ikan tongkol. Faktor oseanograpi yang berpengaruh bagi hasil kegiatan penangkapan ikan di perairan ini antara lain Suhu Permukaan Laut (SPL), Tinggi Paras Muka Laut (TPML), konsentrasi kloropil-a, angin muson dan gejala efek dwi kutub.
Koordinat penelitian adalah 97.00 BT-114.00 BT dan 02.00 LU-11.00 LS dari tahun 2002-2006. Analisa ruang dan waktu digunakan untuk meneliti hubungan SPL, TPML dan kloropil-a yang diperoleh dari data satelit AQUA-MODIS dan satelit Jason-1 dengan produksi ikan. Produksi ikan dianalisa secara musiman. Hubungan antara pengaruh dwi kutub SPL di Samudera Hindia dengan produksi ikan juga digunakan. SPL dan kloropil-a di analisa dengan sofware SeaDAS, TPLM dari website NASA, index gaya dwi kutub di peroleh dari website NASDA. Sedangkan data produksi ikan diperoleh dari data statistik perikanan.
Korelasi antara produksi ikan dengan SPL diperoleh nilai yang cukup kuat pada dua wilayah yaitu Sumatra dengan nilai -0.734 dan perairan Pelabuhanratu sebesar -0.650. Pada dua wilayah lainnya yaitu Selat Sunda dan perairan Prigi korelasinya sebesar -0.560 dan -0.566. Sedangkan korelasi antara produksi ikan dengan kloropil-a menunjukkan pengaruh yang nyata di tiga lokasi yaitu perairan Sumatra, Selat Sunda dan perairan Pelabuhanratu, masing-masing 0.868, 0.660 dan 0.751. Sementara di perairan Prigi, korelasinya sebesar 0.588.
Produksi ikan tongkol yang ditangkap nelayan di perairan ini dipengaruhi oleh angin muson Barat Laut (musim hujan) dan angin muson Tenggara (musim kemarau). Pada musim barat produksi ikan cenderung menurun dan akan meningkat pada periode musim timur.
Korelasi antara produksi ikan dengan index gaya dwi kutub diperoleh hungan yang kuat pada tiga perairan yaitu Sumatra, Selat Sunda dan Pelabuharatu. Sementara di Prigi korelasi tidak begitu kuat. Nilai korelasi di Sumatra sebesar 0.851, di Selat Sunda sebesar 0.656, di Pelabuharatu 0.691, dan di Prigi sebesar 0.463.
Kata kunci : Perairan Indonesia Barat, Suhu Permukaan Laut, Tinggi Paras Muka Laut, Konsentarsi kloropil-a, angin muson , efek dwi kutub.
INTRODUCTION
Background
Western Indonesian seas are the sites of important fisheries in Indonesia. The small pelagic fish catch in this area will start in the same month every year (April) and will end in the same month (November). However, the start and end of the fish catch could come earlier or later and follow with forward or backward production outcomes.
Recent studies point toward the existence of a natural mode of climate variability in the Indian Ocean, known either as the Indian Ocean Dipole/Zone Mode (IODZM; Saji et al. 1999). The resulting winds increase upwelling off Sumatra and substantially alter the near equatorial oceanic thermal structure and circulation.
According Gaol et al.,(2002) during this period occurred difference in SST anomaly between the tropical Western Indian Ocean and the tropical south-eastern Indian Ocean. Cool SST anomalies first appear in the vicinity of the South Java coast by May-June, accompanied by moderate southeasterly wind anomalies in the southern tropical Indian ocean and than moves northwestward off Sumatra until September-October.
The oceanic condition and upwelling along the Southern coastal area have influence to distribution of sea surface chlorophyll-a (SSC), sea surface height (SSH), sea surface temperature (SST) and fish productivity.
SST and ocean color often have similar patterns as generally warm, nutrient-depleted water has low chlorophyll concentrations and cold, nutrient-rich water has high chlorophyll. SST can also be an important factor for determining potential fishing grounds since different fish species have different optimal temperature ranges. Generally SST data have been used more often than ocean color data in fisheries applications. (FAO Fisheries Department, 2004).
RESEARCH MATERIAL AND METHODOLOGY
Location and Material of Research
The area becoming research object is waters of Western Indonesian Sea and around within the rectangular region from 97.00 E -114.00 E, Latitude 02.00 N - 11.00 S. The time of this research has been done at March to June
-MODIS processed by SEACORM (resolution 4 km) from 2002-2006. SSH derive from Jason-1 satellite data 20022006. Fish catch data 2002-2007 from Bungus Harbour in Sumatra, Labuan harbor in Banten, Pelabuhanratu National Fishing Port in West Java, and Prigi National Fishing Port in East Java.
Instrument in this research as follow: A computer set (Pentium PC) 4, SeaDAS 6.4, Software MS Excel, Software MS Office, Software Arc View 3.3.
Data Analysis
Processing and satellite image analysis using SeaDAS software to get ASCII data. This ASCII data will be uses to analyses in determine the average of SST, SSH and chl-a value with polygon method in research location using Arc View software.
Determination of zone potency of fishing ground by combining the contour of SST, SSH and chlorophyll data by using GIS method.
Processing step potency of fishing ground using GIS model as follow:
Some factors that are influence to fishing ground is physical oceanography condition such as temperature, current and others physical factor. Temperature is important factor that influences to their feeding, spawning and migration. Temperature factor in territorial water are dominant and simple factors that can recognize to other oceanography factor. Therefore, temperature is important value to estimate the fishing ground. Another factor is supply of fish food. Existing of fishing gear operation is third other important factor. The available of fishing gear in the fishing ground means that the available of fishing area, meanwhile as fish migration area.
Step of classification process to fishing ground determination are:
-
a. High potential, this area is high potential area for fishing ground.
-
b. Potential, this area is potential area for fishing ground and minimal requirement for fish available.
-
c. Low Potential, character of this area is not requirement for fish available.
Potency area of fishing ground determination is based on the higest total score to lowest total score as table 2
2008.
below.
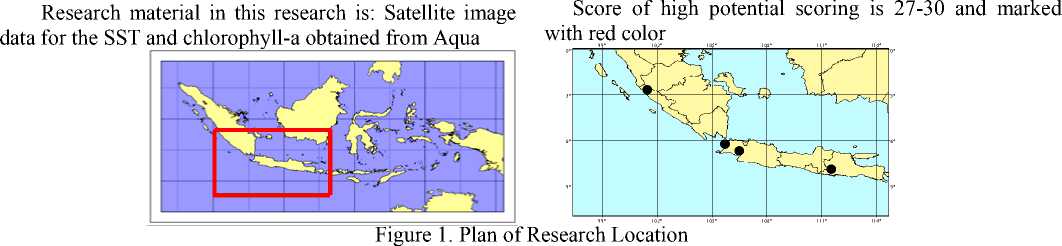
Table 1. Classification to determination of tongkol fishing ground
|
Parameter |
High potential |
Potential |
Low potential | |||
|
Value |
Score |
Value |
Score |
Value |
Score | |
|
SST (oC) |
25 - 29,5 |
12 |
20 - 25 |
11 |
<20, >29,5 |
10 |
|
CHL-A (mg/m3) |
≥ 0,3 |
9 |
0,2-0,3 |
8 |
≤ 0,2 |
7 |
|
WIND SPEED (m/s) |
0,4 - 0,8 |
6 |
0,2 - 0,4 |
5 |
≤ 0,2, ≥ 0,8 |
4 |
|
DMI |
-0,1 - 0,3 |
3 |
-0,1 - (-0,30) |
2 |
> -0,31 |
1 |
Table 2. Classification of fishing ground
Score of high potential scoring is 23-26 and marked with green color.
Score of high potential scoring is 20-22 and marked with yellow color.
|
Classification of potency fishing ground | |||
|
High potential |
Potential |
Low potential | |
|
Score |
27 - 30 |
23 - 26 |
20 - 22 |
Annual fish production data analyzed and compared with DM Index. Fish production data of “tongkol” and satellite data and Dipole Mode Index is analyzed using correlation of Pearson to get accuracy test.
Formula of correlation coefficient of Pearson equation by Rasydah (2003) is:
Cxy= ∑(x-x-)(y-y-)
∑(x-x-)2∑(y-y-)2
Where:
Cxy : Correlation coefficient of fish production with satellite data and DMI
x : x axis value of data y : y axis value of data
RESULT AND DISCUSSION
Data validation
In this research, SST data validation is done by comparing the satellite data and in situ measurement from ARGOS float and chl-a in situ data is derived from Agency for the Assessment and Application of Technology (BPPT) measurement on 2004 from this three research location, that are: Sunda Strait, Pelabuhanratu Bay and Indian Ocean.
Sea Surface Temperature (SST) distribution
Figure 2 below shows that during 5 years from 2002 to 2006 have the same pattern on SST at the 4 different observational locations. At West Sumatra-sea, the temperature tends to be warmer than another location. While the temperature at Prigi-sea, East Java on each year will be cooler than another region.
In Sumatra Sea, the SST shows of warm area that estimated effect of big current drive from westwards near equator that recognized as Equatorial Counter Current (ECC). In Sunda Strait, the increasing of SST anomaly is not as big as at South of Java or East of Indian Ocean. It is estimated that the local influence is enough dominant where it occurs water mass appointment of water mass of Java Sea. In South Java sea (Pelabuharatu sea and Prigi sea), the SST as the effect of South of Java Current (SJC) (Purba et al.,1997).
Sea Surface Height (SSH) distribution
SSH is explained by positive and negative. Positive SSH is explained as increasing of SSH and decrease in negative SSH. SSH'S point shows the changing on every month where the point of SSH on every region tend to
x- : mean value of x axis y - : mean value of y axis
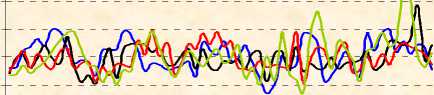
Sumatra Sea Sunda Strait Pl.Ratu. Sea Prigi Sea

22,0
JFMAMJJASONDJFMAMJJASONDJFMAMJJASONDJFMAMJJASONDJFMAMJJASOND
2002 2003 2004 2005 2006
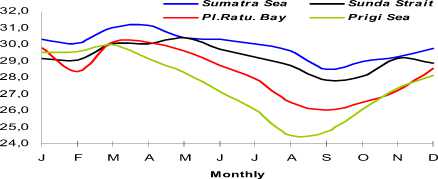
Figure 2. Monthly SST during 5 years and annual change SST in Western Indonesian Sea
40,00
30,00
20,00
10,00
0,00
-10,00
-20,00
-30,00
Sumatra Sunda Strait
Pelabuhanratu Sea Prigi Sea
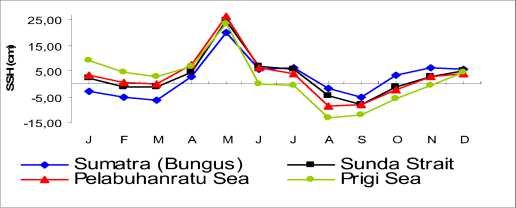
Figure 3. Monthly SSH during 5 years and annual change SSH in Western Indonesian Sea
0,700
0,600
0,500
0,400
0,300
Sumatra Sea Sunda St
PL.Ratu Bay Prigi Sea
JFMAMJ J ASONDJFMAMJ JASONDJFMAMJ JASONDJ FMAMJ JASONDJFMAMJ JASOND
2002 2003 2004 2005 2006
0,200
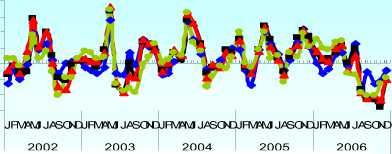
Sumatra Sea Sunda Strait
Pl.Ratu Bay Prigi Sea
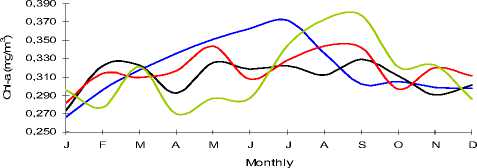
Figure 4. Monthly chl-a during 5 year and annual change chl-a in Western Indonesian Sea
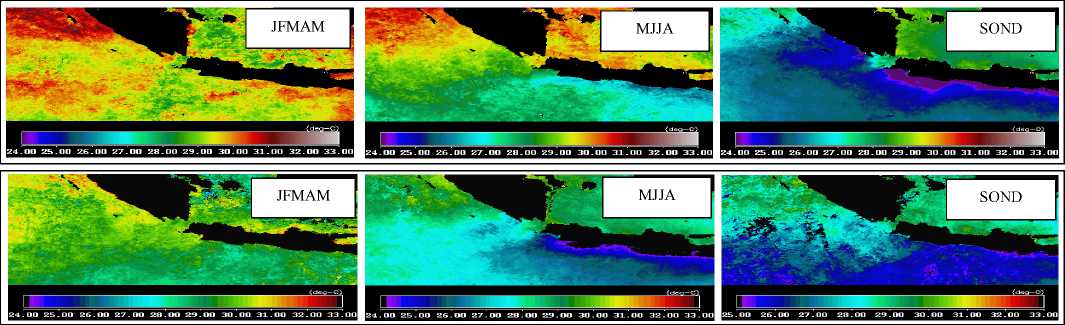
Figure 5. Distribution of SST during negative and positive IOD
increases on December-February and decreases on June-August
Figure above shown monthly and annually SSH changing pattern is equivalent to SST changing. When SST in warm condition then SSH also turn into positive condition and show the increases of SSH. In other hand, when SST is decreases then SSH is decrease and turn into negative.
The distribution of chlorophyll-a concentration
Distribution of chl-a in each locations have different pattern every year, because of a dominant local factor and different oceanography factor.
The Figure 4 above, appear that the increasing of chl-a concentration at all location of fishing ground has different pattern on each year. But the increasing of chl-a concentration will occur on April until October with chl-a, where on this period is dry season that influenced by the wind from Southeast Monsoon.
Relationship IOD and Oceanography Parameter
The distribution of SST for negative IOD during January to August is increasing. Different condition showed on positive IOD, SST distributions in January to August is cool (Figure 5).
In negative DM, the chl-a concentration is decrease because the temperature condition in Indonesian waters is increase. And also when Indonesian temperature is decrease, annually chl-a in each locations show an increase in it concentration.
Prediction of tongkol fishing ground distribution
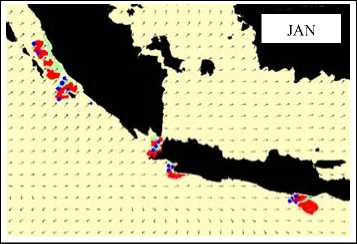
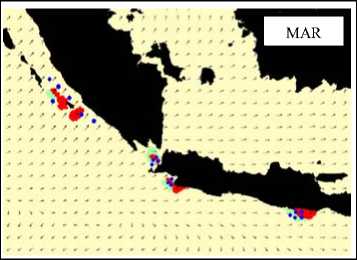
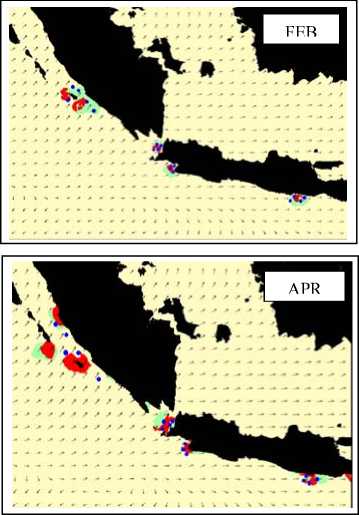
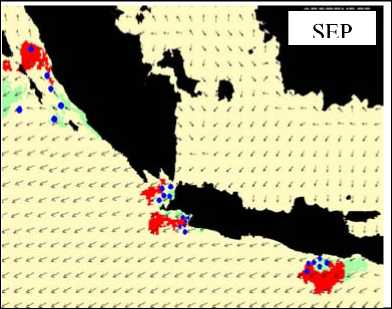
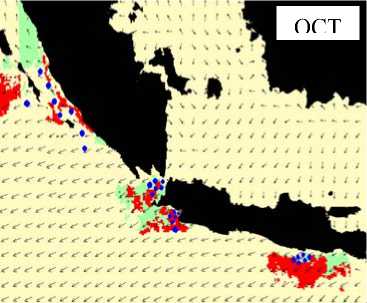
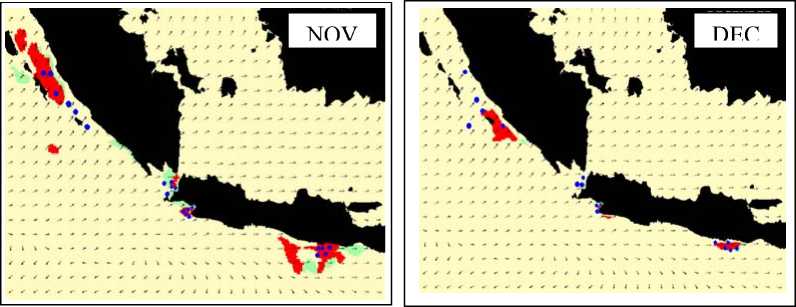
After grouping the classification of fishing ground condition and parameter classification of fishing ground such as SST, chl-a, wind and IOD in 2002-2006, then overlaid each parameter to obtain distribution of prediction tongkol fishing ground map using GIS model, shown in figure below.
On figure above, estimation of tongkol fishing ground distribution map in January-December from GIS model. In December to March, the estimation of fishing ground by high potential condition is smaller than April to October. This is a result of North West Monsoon influence or west season in Western Indonesian Sea in December-March. Different condition is explained in April-October, it is influence of Southeast Monsoon (Figure 6). The waters condition is explain in Table 3 below.
Form Table 3, is explain a warmer temperature condition in April-October than December-March. This is parallel with DMI statement, where that area is warm. When SST is warm then chl-a is tend to decrease. This condition make a potential fishing area is relative small in April-October.
Influences of each parameter are not much different in Sunda Strait monthly. Because, Sunda Strait is a gathering two different water mass zone, that are water from Java sea and from Indian Ocean with different characteristic. Temperature in this area is stabile every month. An important factor to determine distribution pattern is a various SSH. A different SSH value is indicating
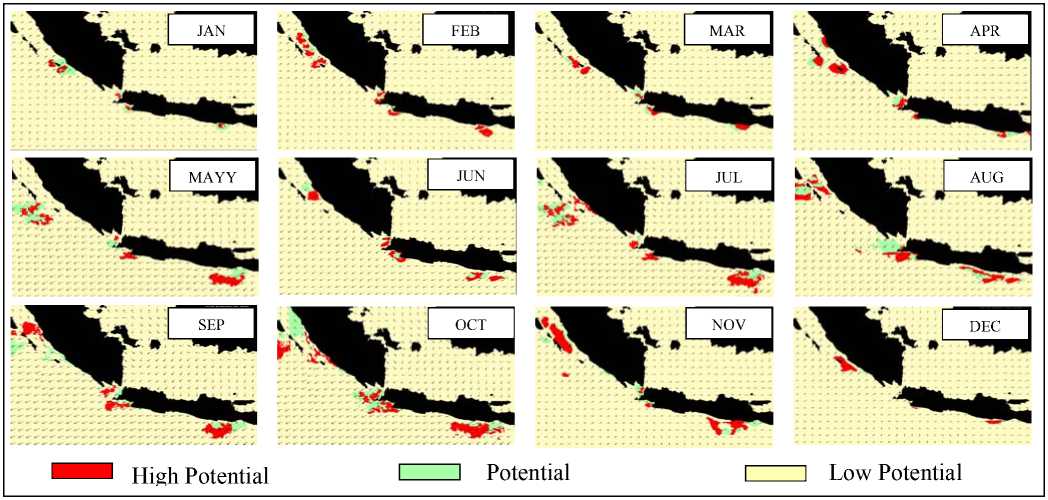
Figure 6. Estimation of tongkol fishing ground distribution map in Western Indonesian Sea using GIS model
Table 3. Parameter environment condition fishing ground in 2002-2006
|
Month |
DMI |
Sumatra (Bungus) |
Sunda Strait |
Pelabuhanratu Sea |
Prigi Sea | ||||||||
|
SSH |
SST |
Chl-a |
SSH |
SST |
Chl-a |
SSH |
SST |
Chl-a |
SSH |
SST |
Chl-a | ||
|
J |
-0,28 |
2.8 |
30.3 |
0.266 |
2.3 |
29.1 |
0.273 |
3.2 |
29.8 |
0.282 |
9.3 |
29.5 |
0.296 |
|
F |
-0,47 |
-5.0 |
30.1 |
0.296 |
-1.0 |
29.1 |
0.322 |
0.6 |
28.4 |
0.314 |
4.6 |
29.6 |
0.277 |
|
M |
-0,19 |
6.5 |
31.0 |
0.317 |
-1.0 |
30.1 |
0.323 |
-0.3 |
30.1 |
0.310 |
2.9 |
30.0 |
0.321 |
|
A |
-0,09 |
3.0 |
31.2 |
0.336 |
4.5 |
30.1 |
0.293 |
7.4 |
30.1 |
0.317 |
6.6 |
29.2 |
0.270 |
|
M |
-0,11 |
20.1 |
30.4 |
0.351 |
25.0 |
30.4 |
0.326 |
26.2 |
29.6 |
0.344 |
23.7 |
28.3 |
0.287 |
|
J |
-0,04 |
5.6 |
30.3 |
0.363 |
7.1 |
29.7 |
0.318 |
6.1 |
28.8 |
0.308 |
0.0 |
27.1 |
0.287 |
|
J |
-0,23 |
6.1 |
30.1 |
0.302 |
5.5 |
29.3 |
0.322 |
4.1 |
27.9 |
0.328 |
-0.8 |
26.1 |
0.345 |
|
A |
0,11 |
-1.8 |
29.6 |
0.336 |
-4.7 |
28.8 |
0.312 |
-8.5 |
26.5 |
0.344 |
-13.3 |
24.5 |
0.373 |
|
S |
0,33 |
-5.0 |
28.5 |
0.372 |
-7.8 |
27.9 |
0.330 |
-7.9 |
26.0 |
0.342 |
-12.1 |
24.7 |
0.378 |
|
O |
0,23 |
3.6 |
29.0 |
0.305 |
-1.3 |
28.1 |
0.312 |
-2.6 |
26.5 |
0.297 |
-5.8 |
26.1 |
0.321 |
|
N |
0,21 |
6.4 |
29.2 |
0.299 |
2.6 |
29.2 |
0.291 |
2.8 |
27.2 |
0.321 |
-0.4 |
27.4 |
0.323 |
|
D |
0,11 |
5.5 |
29.8 |
0.298 |
4.9 |
28.9 |
0.302 |
3.8 |
28.6 |
0.311 |
4.3 |
28.1 |
0.286 |
upwelling in some certain month, such as August and September.
Meanwhile in Pelabuhanratu and Prigi, show a return collaboration pattern between SSH, SST and Chl-a in every month. Because in this area (South of Java Sea) in April-October is a good condition to fishing. And cause by upwelling in July-September and effect of Ekman transport. Therefore estimation of tongkol fishing ground distribution in July-September is larger than in DecemberMarch.
For further analysis the prediction map of fishing ground that was produced by GIS model (Figure 6) is combining with fishing positions in each location of research as shown in Appendix 1. The match-up ratio between prediction map of fishing ground that was
produced by GIS model and fishing locations was reported by fisherman as shown on the Table 4.
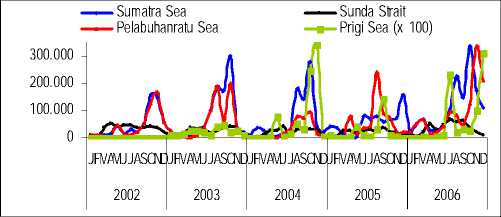
Figure 7. Fish production in Western Indonesian Sea during 5 years
Table 4. Match-up Ratio between Fishing Ground data by
Fisherman and Geographic Information System (GIS)
|
Month |
Sumatra sea |
Month |
Sunda strait | ||||
|
Number of FG data |
Data with Gis area |
Ratio (%) |
Number of FG data |
Data with Gis area |
Ratio (%) | ||
|
J |
5 |
3 |
60.0 |
J |
5 |
3 |
60.0 |
|
F |
7 |
6 |
85.7 |
F |
6 |
4 |
66.7 |
|
M |
8 |
5 |
62.5 |
M |
9 |
7 |
77.8 |
|
A |
10 |
7 |
70.0 |
A |
11 |
10 |
90.9 |
|
M |
15 |
10 |
66.7 |
M |
12 |
10 |
83.3 |
|
J |
17 |
14 |
82.4 |
J |
13 |
12 |
92.3 |
|
J |
15 |
13 |
86.7 |
J |
14 |
10 |
71.4 |
|
A |
18 |
16 |
88.9 |
A |
15 |
12 |
80.0 |
|
S |
17 |
15 |
88.2 |
S |
17 |
13 |
76.5 |
|
O |
15 |
13 |
86.7 |
O |
14 |
12 |
85.7 |
|
N |
10 |
9 |
90.0 |
N |
12 |
10 |
83.3 |
|
D |
6 |
5 |
83.3 |
D |
4 |
2 |
50.0 |
|
Total |
143 |
116 |
81.1 |
Total |
132 |
105 |
79.5 |
|
Month |
Pelabuhanratu sea |
Month |
Prigi sea | ||||
|
Number of FG data |
Data with Gis area |
Ratio (%) |
Number of FG data |
Data with GIS area |
Ratio (%) | ||
|
J |
7 |
5 |
71.4 |
J |
4 |
2 |
50.0 |
|
F |
8 |
7 |
87.5 |
F |
6 |
4 |
66.7 |
|
M |
11 |
8 |
72.7 |
M |
8 |
6 |
75.0 |
|
A |
12 |
10 |
83.3 |
A |
9 |
6 |
66.7 |
|
M |
17 |
15 |
88.2 |
M |
10 |
8 |
80.0 |
|
J |
21 |
17 |
81.0 |
J |
12 |
11 |
91.7 |
|
J |
20 |
17 |
85.0 |
J |
15 |
12 |
80.0 |
|
A |
23 |
20 |
87.0 |
A |
18 |
15 |
83.3 |
|
S |
21 |
18 |
85.7 |
S |
18 |
14 |
77.8 |
|
O |
19 |
16 |
84.2 |
O |
19 |
17 |
89.5 |
|
N |
15 |
10 |
66.7 |
N |
10 |
7 |
70.0 |
|
D |
11 |
6 |
54.5 |
D |
8 |
5 |
62.5 |
|
Total |
185 |
149 |
80.5 |
Total |
137 |
107 |
78.1 |
Table 5. The environment parameter condition in Western Indonesian Sea 2002-2006
|
Years |
Sumatra |
Pelabuhanratu | ||||||||
|
Satelitte data |
Fish Prod (kg) |
Satelitte data |
Fish Prod (kg) | |||||||
|
W. speed |
SSH |
SST |
CHL-A |
. spee |
SSH |
SST |
CHL-A | |||
|
(m/s) |
(cm) |
(0C) |
(mg/m3) |
(m/s) |
(cm) |
(0C) |
(mg/m3) | |||
|
2002 |
7.48 |
3.22 |
30.19 |
0.390 |
527,421 |
5.12 |
3.09 |
28.2 |
0.381 |
527,421 |
|
2003 |
6.12 |
1.00 |
30.00 |
0.381 |
898,195 |
5.12 |
1.91 |
29.7 |
0.371 |
668,183 |
|
2004 |
6.75 |
4.52 |
30.10 |
0.366 |
794,944 |
6.70 |
6.49 |
28.1 |
0.402 |
336,127 |
|
2005 |
8.70 |
6.87 |
30.25 |
0.369 |
681,402 |
6.30 |
8.19 |
29.7 |
0.379 |
626,049 |
|
2006 |
6.56 |
-3.51 |
29.58 |
0.399 |
1,340,43 0 |
5.79 |
-5.12 |
28.4 |
0.379 |
1,112,85 5 |
|
Years |
Sunda strait |
Prigi sea | ||||||||
|
Satelitte data |
Fish Prod (kg) |
Satelitte data |
Fish Prod (kg) | |||||||
|
W. speed |
SSH |
SST |
CHL-A |
. spee |
SSH |
SST |
CHL-A | |||
|
(m/s) |
(cm) |
(0C) |
(mg/m3) |
(m/s) |
(cm) |
(0C) |
mg/m3 | |||
|
2002 |
6.48 |
3.01 |
29.7 |
0.350 |
407,006 |
5.51 |
-0.28 |
28.8 |
0.373 |
4,500 |
|
2003 |
6.12 |
1.87 |
29.3 |
0.365 |
321,373 |
7.08 |
0.64 |
27.5 |
0.339 |
2,682,000 |
|
2004 |
6.12 |
6.09 |
30.1 |
0.412 |
252,062 |
6.70 |
-3.49 |
28.9 |
0.361 |
7,850,000 |
|
2005 |
7.57 |
9.13 |
29.7 |
0.376 |
245,659 |
6.95 |
6.95 |
29.9 |
0.398 |
2,602,000 |
|
2006 |
6.22 |
-5.05 |
29.2 |
0.402 |
419,566 |
8.85 |
-2.85 |
28.3 |
0.390 |
7,309,000 |
Table above shows, that total match-up ratio in Sumatra, Sunda Strait, Pelabuhanratu Sea and Prigi Sea are 81.1%, 79.5%, 80.5% and 78.1% respectively.
This match-up value is clearly explains correlation between the prediction of tongkol fishing ground map by GIS model and fish production. And also the fish
production will increase in supported environment system condition.
Fish Production in Western Indonesian Sea
Commonly, fish production in each research location during 5 years from 2002 until 2006 is show the varying fluctuation. Figure 7 below shown fish productions in all location research.
The fish production caught by fisherman in all location research will decrease on rainy season, it appears in decreasing of fisherman haul production in the early rainy season (December November). Fish production begins increase on the first transitional time (April) and will fluctuate to increase on June-October. Commonly the peak of fish production occurs on September until October which is a transitional time between the dry seasons to the rainy season (2nd transition) (Hendiarti, 2003).
The Correlation of fish production with satellite data
Environment parameter 2002-2006 condition in Western Indonesian Sea is shown in table below.
SSH and SST have similiar pattern. Sumatra and Sunda Strait have warm SST condition, but in Pelabuhanratu is low. Chl-a in each location is fluctuated (Table 5). SSH is decrease to negative, SST is low and chl-a is increase. This is indication of upwelling (Susanto, 2001)(Hendiarti, 2003).
-
1. The correlation fish production with SST
Base on the calculation using the Pearson equation gets the correlation between fish production and SST in all location research is:
-
a. In West Sumatra sea, index correlation value is -0.734 b. In Sunda Strait, index correlation value is -0.560 c. In Pelabuhanratu sea, index correlation value is -0.650. d. In Prigi sea, index correlation value is -0.566
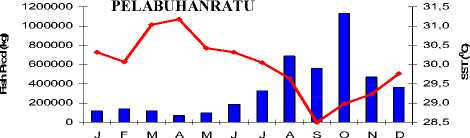
This value shows really that there is a strong relationship between SST and the fish production especially at West Sumatra Sea and Pelabuhanratu sea (Figure 8)
Generally the ‘tongkol’ fish like the sea with estimation temperature about 200C–280C, according to Willianson (1970), Uchida (1980) and (Burhanuddin et al, 1984). But when the sea temperature is low (ranging between 200C–280C) make the fish production caught by fisherman will increase.
While at Sunda Strait and Prigi Sea, Figure 10 shows the low relationship between SST and fish production in Sunda Strait and Prigi Sea. It is caused of at Sunda strait becomes the mixing of the two water mass between Java sea and Indian Ocean. The mixing of the two water mass causes the SST at that area almost along the year will be more constant so the fish production caught at this area is
600000
500000
400000
300000
200000
100000
0
SUMATRA
31,0
30,0
29,0
28,0
27,0
26,0
JFMAMJJASOND
SST
Fish Prod
-0,650
Fish Prod SST
Figure 8. Correlation SST and Fish Production in Sumatra and Pelabuhanratu
250000
200000
150000
100000
50000
0
SUNDA STRAIT
30,5
30,0
29,5
29,0
28,5
28,0
JFMAMJJASOND
Fish Prod SST -0,560
27,5
5000000 4500000 4000000 3500000 3000000 2500000 2000000 1500000 1000000
500000 0
J
30,0
Fish Prod
PRIGI SEA
29,0
2258,,00
FMAMJ
JASOND
27,0
26,0
24,0
SST
Figure 9. Correlation SST and Fish Production in Sunda Strait and Prigi
x 1000
250
200
150
100
50
0
x 1000
5.000
4.500
4.000
3.500
3.000
2.500
2.000
1.500
1.000
500 0
Sunda Strait
Jan Feb Mar Apr May Jun Jul Agst Sep Oct Nov Dec
Month
Jan Feb Mar Apr May Jun Jul Agust Sep Oct Nov Dec
Month
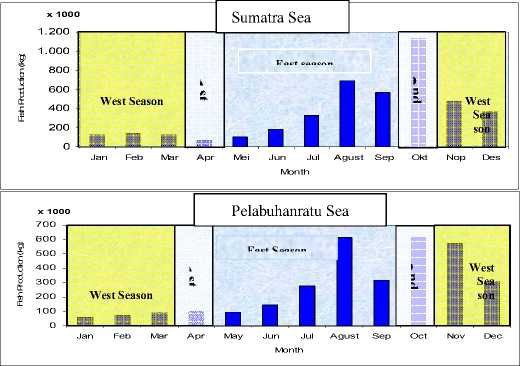
Figure 10. Annual fluctuations fish production in Western Indonesian Sea during 5 year
not too influenced by the temperature but there is another dominant influence and localism (Hendiarti 2003). Also at Prigi Sea, where at this sea is much influenced by Indonesian Troug Flow (ITF). The increasing of fish production at this area not only influence by SST (Hendiarti, 2003).
-
2 The correlation fish production with chl-a
Based on the calculation using Pearson formula, the correlation value between chl-a and fish productions on each location are:
-
a. In West Sumatra sea, index correlation value is 0.868
-
b. In Sunda Strait, index correlation value is 0.660
-
c. In Pelabuhanratu sea, index correlation value is 0.751
-
d. In Prigi sea, index correlation value is 0.588
This value shows the strong relationship between concentration chlorophyll-a and fish production. It means that when the concentration of chlorophyll-a shows increase so it causes the sea around it becomes rich of
nutrient, it makes the fish production caught by fisherman will tend to increase. On the contrary, when the concentration of chlorophyll-a decrease it makes the production number of fishes caught by fisherman will decrease.
Meanwhile, in Prigi sea the correlation chl-a and fish production is a low. Tabel 1 shown the fish production in 2002 is low, but fishing ground condition support to aviable of rich nutrient. Decreasing of fish production is cause by other condition and localism.
Fluctuation of fish production by monsoon
The wind at Western Indonesian Sea blows from the south-west and west of Sumatra move toward the east in average speed is 13.5 knots by taking more rain so this condition causes the fish catches activity is not good. Meanwhile on east season that influenced by southeast monsoon, wind that comes from Australia in average speed is 17.5 knots where this wind takes cold water mass that
rich of nutrient along the South coast of Java until Sumatra so this condition is good for fish catches activity.
Figure 10 is showed that average fish production 2002-2006 in Sumatra, Sunda Strait and Pelabuhanratu will be decrease in rainy season or northeast monsoon, and will be increase in dry season or southeast monsoon. And the maximum fish production is in the month of October (2nd transition). Fish production in Prigi Sea will be increase in dry season and the maximum fish production is occurring in November. In west season fish catching is decrease (Hendiarti, 2003) and (Pakpakan 1999).
Table 6. Annual correlation fish production and IOD in Western Indonesian Sea
|
Years |
Sumatra Sea |
Sunda Strait |
Pelabuhanratu Se |
Prigi Sea | ||||
|
F.Prod (kg) |
DMI |
F.Prod (kg) |
DMI |
F.Prod (kg) |
DMI |
F.Prod (kg) |
DMI | |
|
2002 |
527,421 |
-0.136 |
407,006 |
-0.136 |
527,421 |
-0.136 |
4,500 |
-0.136 |
|
2003 |
898,195 |
0.094 |
321,373 |
0.094 |
668,183 |
0.094 |
2,682,000 |
0.094 |
|
2004 |
794,944 |
-0.100 |
252,062 |
-0.100 |
336,127 |
-0.100 |
7,850,000 |
-0.100 |
|
2005 |
681,402 |
-0.373 |
245,659 |
-0.373 |
626,049 |
-0.373 |
2,602,000 |
-0.373 |
|
2006 |
1,340,43 |
0.314 |
419,566 |
0.314 |
1,112,855 |
0.314 |
7,309,000 |
0.314 |
|
orrela |
0.851 |
0.656 |
0.691 |
0.463 | ||||
Table 7. The condition of fishing ground in Western Indonesian
Sea influenced by IOD
|
Sumatra | |||||||
|
Years |
DMI |
Environment parameter |
Fg |
Fish | |||
|
W. speed (m/s) |
SSH (cm) |
SST(0C) |
CHL-A(mg/m3) |
Condition |
Prod (kg) | ||
|
2002 |
-0.136 |
6.12 |
3.22 |
30.19 |
0.390 |
Warm |
253,074 |
|
2003 |
0.090 |
7.48 |
1.00 |
30.00 |
0.381 |
Cool |
100,723 |
|
2004 |
-0.100 |
6.75 |
4.52 |
30.10 |
0.366 |
Warm |
146,947 |
|
2005 |
-0.373 |
6.56 |
6.87 |
30.25 |
0.369 |
Warm |
328,785 |
|
2006 |
0.314 |
8.70 |
-3.51 |
29.58 |
0.399 |
Cool |
453,366 |
|
Sunda Strait | |||||||
|
Years |
DMI |
Environment Parameter |
FG |
FISH | |||
|
W. Speed (m/s) |
SSH (cm) |
SST (0C) |
CHL-A (mg/m3) |
Condition |
PROD (KG) | ||
|
2002 |
-0.136 |
6.12 |
3.01 |
29.7 |
0.350 |
warm |
157,145 |
|
2003 |
0.090 |
6.48 |
1.87 |
29.3 |
0.365 |
cool |
129,145 |
|
2004 |
-0.100 |
6.12 |
6.09 |
30.1 |
0.412 |
warm |
80,845 |
|
2005 |
-0.373 |
6.22 |
9.13 |
29.7 |
0.376 |
warm |
88,132 |
|
2006 |
0.314 |
7.57 |
-5.05 |
29.2 |
0.402 |
cool |
126,833 |
|
Pelabuhanratu | |||||||
|
Years |
Dmi |
Environment parameter |
Fg |
Fish | |||
|
W. Speed (m/s) |
SSH (cm) |
SST (0C) |
CHL-A (mg/m3) |
condition |
prod (kg) | ||
|
2002 |
-0.136 |
5.12 |
3.09 |
28.2 |
0.381 |
warm |
257,818 |
|
2003 |
0.090 |
6.79 |
1.91 |
29.7 |
0.371 |
cool |
80,714 |
|
2004 |
-0.100 |
5.7 |
6.49 |
28.1 |
0.402 |
warm |
42,133 |
|
2005 |
-0.373 |
6.3 |
8.19 |
29.7 |
0.379 |
warm |
123,044 |
|
2006 |
0.314 |
7.64 |
-5.12 |
28.4 |
0.379 |
cool |
415,275 |
|
Prigi Sea | |||||||
|
Years |
DMI |
Environment parameter |
fg |
FISH | |||
|
W. Speed (m/s) |
SSH (cm) |
SST (0C) |
CHL-A (mg/m3) |
condition |
prod (KG) | ||
|
2002 |
-0.136 |
6.95 |
-0.28 |
28.8 |
0.373 |
cool |
4,500 |
|
2003 |
0.090 |
7.08 |
0.64 |
27.5 |
0.339 |
cool |
1,022,000 |
|
2004 |
-0.100 |
6.70 |
-3.49 |
28.9 |
0.361 |
cool |
3,527,000 |
|
2005 |
-0.373 |
5.51 |
6.95 |
29.9 |
0.398 |
warm |
234,000 |
|
2006 |
0.314 |
8.85 |
-2.85 |
28.3 |
0.390 |
cool |
4,109,000 |
Annual Correlation between fish production and Indian Ocean Dipole
By using Pearson equation so gets the annual correlation between fish production and dipole mode index at each observational location.
Table above shows the relationship between fish production and DMI in Sumatra Sea, Sunda Strait and Pelabuhanratu Sea is strong. Meanwhile correlation in Prigi Sea is a low.
On Table 7 shown all environment parameter in Sumatra Sea, Sunda Strait and Pelabuhanratu Sea influced by IOD. But in Prigi sea, all environment parameter at fishing ground not influnced by IOD. This shown in negative IOD in 2002 and 2004 the fishing ground becomes cool. This condition was caused much more influenced by ITF and mixing water (Wyrtki, 1962)(Susanto,2001). It appears clearly that the total fish production caught by fisherman at this sea during five years, the amount is higher from the other three seas at Western Indonesian Sea.
CONCLUSION ANS SUGGESTION
Conclusion
Based on the result of thesis research, the conclusion can be suggested as follow:
The correlation value between fish production and SST in Sumatra Sea and Pelabuhanratu Sea is high with value -0.734 and -0.660. In Sunda Strait and Prigi Sea is low, with value -0.560 and -0.566. Meanwhile the correlation value between fish production and chl-a in Sumatra Sea, Sunda Strait and Pelabuhanratu are high and in Prigi Sea is low. The value in Sumatra Sea is 0.868, in Sunda Strait is 0.660, in Pelabuharatu Sea is 0.751 and in Prigi sea is 0.588.
The fish production caught by fisherman influence by northwest monsoon (rainy season) and southeast monsoon (dry season). Fish production will decrease in rainy season, and increase at dry season.
The correlation value between fish production and DMI has a high correlation in Sumatra Sea, Sunda Strait and Pelabuhanratu Sea. Meanwhile, in Prigi Sea the corelation is low. Correlation value in Sumatra Sea, Sunda Strait, Pelabuhanratu Sea, and Prigi Sea are 0.851, 0.656, 0.691 and 0.463 respectively.
Suggestion
For the research accuracy, it is required fishery insitu data that completed with coordinate from fisherman and also fishery harbor.
It needs a further research to know the detail how great the impact of IOD to fishery effort and the increasing of fish production.
IOD is one of oceanography phenomena that to influence the effeciency and effectivity of fish catch, so expected to fisherman can exploit this phenomenon.
During Southeast monsoon and positive IOD, the fisherman can extend fish catch effort.
REFERENTS
Burhanuddin, R, Moelyanto, M dan D. Asikin. 1984. Tinjauan mengenai ikan tuna, cakalang dan tongkol. LON-LIPI. Jakarta. 65 p.
FAO Fisheries Department. 2004. The State of World Fisheries and Aquaculture (SOFIA) 2004, 153 pp. U.N. Food and Agriculture Organization, Rome Italy.
Gaol LJ et al. 2002. Fish Catch Relative to Environmental Parameters Observed from Satellite During ENSO and Dipole Mode Events 1997/98 in the South Java Sea. PORSEC 2002 BALI Proceedings.
Gunarso W. 1985. Tingkah laku ikan dan hubungannya dengan alat, metode dan taktik penangkapan. Jurusan Pemanfaatan Sumberdaya Perikanan, Fakultas Perikanan.Bogor : Institut Pertanian Bogor.
Pakpakan R. 1999. Study on several environmental meteorological aspects and their relations to the catch season of pelagic fish in the Sunda Strait. (in
Indonesian). Bachelor thesis. Bogor : Bogor Institute of Agriculture.
Purba, M., I. N.M. Natih, dan Y. Naulita. 1997. Karekteristik dan sirkulasi massa air di perairan selatan Jawa-Sumbawa, 5 Maret-2April dan 23 Agustus-30 September, 1990. Fakultas Perikanan IPB-BPP Teknologi : Bogor.
Hendiarti, N., Suwarso, Edvin Aldrian, Khairul Amri, Retno Andiastuti, Suhendar I. Sachoemar, and Ikhsan Budi Wahyono. 2003. Seasonal Variation of Pelagic Fish Catch Around Java. Oceanography Journal Vol. 18, No. 4. Dec. 2005.
Rasyad, R. 2003. Metode Statistik Deskriptif untuk Umum. PT. Gramedia Widiasarana Indonesia. Jakarta.
Saji, N. H., B. N. Goswami, P. N. Vinayachandran, and T. Yamagata, 1999. A Dipole Mode in the Tropical Indian Ocean. Nature, 401. 360-363
Susanto, R.D., A.L. Gordon, and Q. Zheng. 2001a. Upwelling along the coasts of Java and Sumatra and its relation to ENSO. Geophysical Research Letters 28:1599-1602.
Wyrtki, K. 1962. The Upwelling In The Region Between Java And Australia During The South-East Monsoon. Aust. J. Mar. Freshwater Res. 13: 217225.
Appendix 1. Comparison of Fishing Ground GIS and Fishing Ground by Fisherman

24
Discussion and feedback