STUDY ON OCEANGRAFHIC AND WEATHER CONDITIONS RELATED TO THE ABUNDANCE OF SMALL PELAGIC FISHERY IN NATUNA SEA USING REMOTE SENSING DATA
on
Ecotrophic ♦ 4 (1): 8 - 14 issn: 1907-5626
STUDY ON OCEANGRAFHIC AND WEATHER CONDITIONS RELATED TO THE ABUNDANCE OF SMALL PELAGIC FISHERY IN NATUNA SEA USING REMOTE SENSING DATA
Teguh Prayogo 1) I Wayan Arthana 2)
-
1) Lembaga Penerbangan dan Antariksa Nasional
-
2) Master Program of Environment Science Postgraduate Program Udayana University Email:tprayogo@yahoo.com
ABSTRACT
Indonesian waters have abundance of natural resources; the potential of small pelagic fish in Natuna Sea and South China Sea have not been optimized yet explores. Unfortunately, it was caused by lacking in the data of environmental conditions that have been changed and the information of appropriate fishing ground. Hence, dynamical oceanographic information and weather condition is necessary to optimize small pelagic fish exploitation.
Research location in Natuna Sea and its surrounding with geographical position is 08°N–03°S; 103°–111°E. The oceanographic condition representative by monthly SST, Chl-a, SSH that derived from satellite data and Dipole Mode Index for 2002-2007 from FRCGC website. Monthly wind data is variable for weather condition. Small pelagic fish abundance representative by annual fish production (2002-2005) and monthly Catch Per Unit Effort (CPUE) of Goldstripe sardinella, Bigeye scad and Indian scad (2006). It was data collected from Directorate General of Capture Fisheries (Ministry of Marine Affairs and Fisheries) and daily fishing operation (2007) used to calculate match-up ratio that was collected from Pemangkat fishing port in West Kalimantan. Research process consists of image processing, descriptive correlation analysis and GIS analysis to predict fishing ground map and match-up ratio calculation.
Result of this research is the annual fish catch production of Bigeye scad and Indian scad (2002-2005) is tend to increase and the monthly CPUE of both species is high during SE Monsoon (May-Sep) that is condition contrarily in NW Monsoon (Nov-Apr). Meanwhile, the annual fish catch production of Goldstripe sardinella production is tend to decrease from 2002-2005, it has CPUE is high in early SE Monsoon (May). During the SE Monsoon (May-Sep) when DM Index is positive (+) the Indian scad and Bigeye scad production is high, for Goldstripe sardinella the fish production is high when DM Index is positive (+) in May. The accuracy of prediction map of small pelagic fishing ground in Natuna Sea is about 0.61, 0.76 and 0.81 for Goldstripe sardinella, Indian scad and Bigeye scad, respectively.
Keywords: oceanographic condition, weather condition, small pelagic fish, satellite data
ABSTRAK
Perairan Indonesia memiliki sumberdaya alam yang berlimpah, potensi ikan pelagis kecil di Laut Natuna dan Laut Cina Selatan belum termanfaatkan secara optimal. Kondisi ini disebabkan kurangnya informasi tentang kondisi perairan yang sesuai untuk daerah penangkapan ikan. Oleh sebab itu informasi tentang dinamika oseanografi dan kondisi cuaca sangat diperlukan dalam upaya mengoptimalkan ekploitasi ikan pelagis kecil.
Lokasi penelitian berada di Laut Natuna dengan posisi geogafis 08°LU–03°LS; 103°–111°BT. Kondisi oseanografi diwakili oleh data bulanan suhu permukaan laut, klorofil-a, tinggi paras laut yang diperoleh dari data satelit serta data Dipole Mode Index yang diperoleh dari situs FRCGC. Periode data yang digunakan dari tahun 2002-2007, sedangkan kondisi cuaca diwakili oleh data angin. Hasil tangkapan ikan pelagis diwakili oleh data produksi tahunan dari tahun 20022005 dan data bulanan CPUE (Catch Per Unit Effort) untuk ikan Tembang, Selar dan Layang (2006). Data perikanan dikumpulkan dari Dirjen Perikanan Tangkap Departemen Kelautan dan Perikanan serta data harian penangkapan dari pelabuhan perikanan Pemangkat (2007), Kalimantan Barat. Pengolahan data penelitian terdiri dari; pengolahan citra satelit, analisa korelasi secara deskriptif, dan analisis SIG (Sistem Informasi Geografis) untuk memprakirakan peta daerah penangkapan ikan dan perhitungan akurasi kesesuaian peta.
Berdasarkan hasil penelitian, produksi tangkapan ikan tahunan untuk Selar dan Layang cenderung meningkat dari tahun 2002-2005 dan CPUE bulanan tinggi dari kedua spesies ini diperoleh selama Musim Tenggara (Mei-Sepember), sebaliknya pada Musim Baratlaut (Nopember-Maret) hasil tangkapan kedua ikan tersebut rendah. Produksi tangkapan tahunan untuk ikan Tembang di tahun yang sama cenderung menurun, CPUE bulanan ikan ini tinggi pada awal Musim Tenggara (Mei). Ketika Dipole Mode Positif pada Musim Tenggara produksi tangkapan ikan Selar dan Layang tinggi, begitu juga dengan produksi tangkapan ikan Tembang tinggi pada bulan Mei saat Dipole Mode Positif. Rasio kesesuaian
atau akurasi peta prakiraan daerah penangkapan ikan di Laut Natuna untuk ikan Tembang, Layang dan Selar masing-masing 0.61, 0.76 dan 0.81.
Kata Kunci: kondisi oseanografi, kondisi cuaca, ikan pelagis kecil, data satelit
INTRODUCTION
Indonesian waters have abundance of fisheries resources. Particularly, the small pelagic are the highest potential resources that have not been optimized yet explores. South China Sea and Natuna Sea is the one of nine Indonesian Fisheries Management Area (IFMA) have a high potential of small pelagic fishes, were about 621.500 ton/year and the exploitation rate about 33,1% from maximum sustainable yield (Badrudin and Sumiono, 2005). The fish most caught by purse seine (fishing gear) in Natuna Sea are Indian Scad (Decapterus ruselli), Bigeye Scad (Selaroides cromenopthalmus) and Goldstripe sardinella (Sardinella gibbossa) Badrudin and Sumiono (2005).
Unfortunately, the resources of small pelagic fishes not exploited yet optimally, caused by lacking in the data of environmental conditions that have been changed and the information of appropriate fishing ground. Environmental conditions, however, also influence fishing operations on shorter temporal scales, by affecting the distribution and local abundance of fish within the fishing grounds.
Therefore, this research would be applied the remote sensing data to study the oceanographic and weather factors to the abundance of pelagic fisheries. So, this research can get a better understanding of the effects of oceanographic and weather conditions (Indian Ocean Dipole and Monsoon) forcing on the small pelagic fish resources in this region and get features about distribution of its fishing ground so that could be help an exploitation management of pelagic fisheries more effectively.
RESEARCH METHOD
Research location in Natuna Sea and its surrounding with geographical position is 08°N– 03°S; 103°–111°E. The
oceanographic condition representative by monthly SST, Chl-a, SSH that derived from satellite data and Dipole Mode Index for 2002-2007 from Jamstec website. Monthly wind data is variable for weather cofish abundance representative by
i
• √v*

Figure 1. Research location ndition. Small pelagic
annual fish production (2002-2005) and monthly Catch Per
Unit Effort (CPUE) of Goldstripe sardinella, Bigeye scad and Indian scad (2006).
It was collected from Directorate General of Capture Fisheries (Ministry of Marine Affairs and Fisheries) and daily fishing operation (2007) used to calculate match-up ratio that was collected from Pemangkat fishing port in West Kalimantan. Research process consists of image processing, descriptive correlation analysis and GIS analysis to predict fishing ground map and match-up ratio calculation.
RESULT AND DISCUSSIONS
Oceanographic Condition and Small Pelagic Fishes
Annual productions of small pelagic fishes show that the Goldstripe sardinella tends to decrease from 2002 to 2005. However, this condition was not occurred to Bigeye and Indian scad (Figure 2). The Bigeye scad production oppositely increase from 2002-2005, although the total catch production is lower than Goldstripe sardinella in the peak of years. Meanwhile, the catch production of Indian scad shows almost similar fluctuation with the Bigeye scad, but in 2002 is higher than 2003. The catch production of Indian scad has a total highest of all the species.
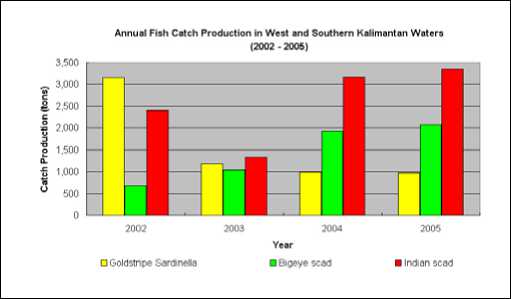
Figure 2. Annual Fish Catch Production of Small Pelagic Natuna Sea
Monthly fish catch data for Bigeye and Indian scad available from April to December because for January-March there are not fishing operation due to the weather condition (strong wind and wave so high). Meanwhile, the fish catch data for Goldstripe sardinella only available from April until August; it has from September-March there were not Goldstripe sardinella caught. The fish production of Goldstripe sardinella during April until
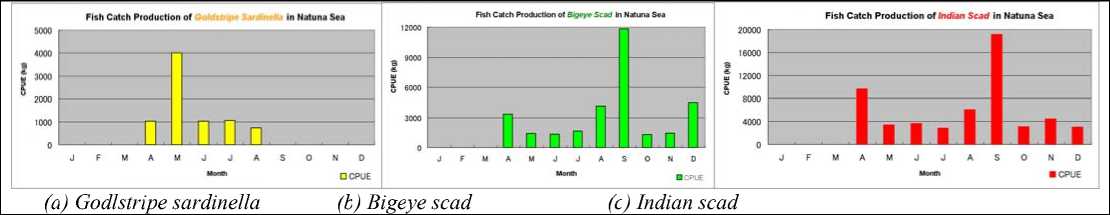
Figure 3. Monthly Fish Catch Production of Small Pelagic Fishes in Natuna Sea
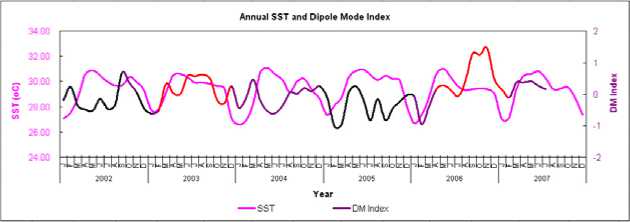
Figure 4. Annual variation of Dipole Mode Index in Natuna Sea
August shows that peak of fish catches occurs in May it has 4,000kg/day and lowest CPUE is 726.64kg/day in August (Figure 3a). The highest CPUE of Bigeye and Indian scad occurs in the same time it was in September (Figure 3b and 3c), while the total CPUE is 11.8 tons/day and 19.1 tons/day, respectively. The CPUE of Bigeye and Indian scad shows the trend that almost similar, but the total CPUE of Indian scad is higher.
Seasonally, the CPUE of small pelagic fishes is higher during SE monsoon (May-September) rather than NW monsoon (November-March). In transition period, the CPUE shows the significant difference which was higher in April (10.8 tons/day) rather than October (4.4 tons/day). These conditions may be affected by oceanographic and weather condition such as Indian Ocean Dipole Mode or Monsoon.
The SST in Natuna Sea indicates there is a response and correlated to IOD event, Figure 4 shows that SST tend to lower condition during Dipole Mode Index (DMI) is positive it was found in 2003 and 2006 (red line). Reversely condition the SST high so the sea surface is warm when DMI negative as shown in 2002 and 2005 (black line). According to Annual and monthly DMI the negative and positive dipole is the periodic event for three years (2002 and 2005 for negative dipole, 2003 and 2006
for positive dipole). The period of the negative or positive dipole every year is about 6-8 months as shown Figure 4.
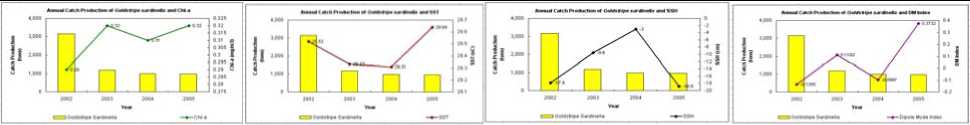
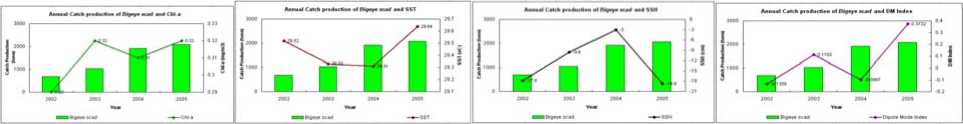
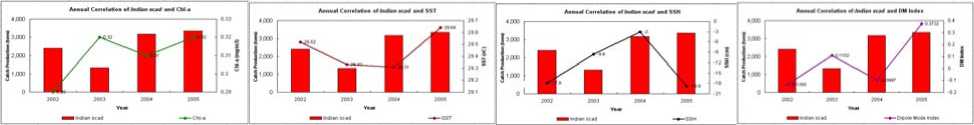
Figure 5, shows annual correlation of (a) Goldstripe sardinella, (b) Bigeye scad, and (c) Indian scad production with oceanographic parameter in Natuna Sea, from leftright (1-4) for Chl-a, SST, SSH and DM Index. Figure 5a2, show that the fluctuation of SST follows the fish catch production, but the fish catch is low when high SST in 2005. This correlation is similar pattern for both variables; it is mean there is a proportional correlation between Goldstripe sardinella and SST. The effect of Dipole Mode is not appear to the fish catch production (Figure 5a4), when negative dipole in 2002 the fish catch production is high, but for the same condition in 2004 not followed by increasing of fish catch production.
Figure 5b1, show the positive correlation between chlorophyll-a concentration to the fish catch production of Bigeye scad, it has high catch production when the chlorophyll-a concentration is increase during 2002-2005. The similar pattern was shown in Figure 5b2, the increasing of SST from 2003 to 2005 was followed by fish catch production of Bigeye scad, although the fish catch production is low when the SST is high in 2002.
(a)
(b)
(c)
Figure 5. Annual correlation of (a) Goldstripe sardinella (b) Bigeye scad (c) Indian scad production with oceanographic parameter in Natuna Sea
(c)
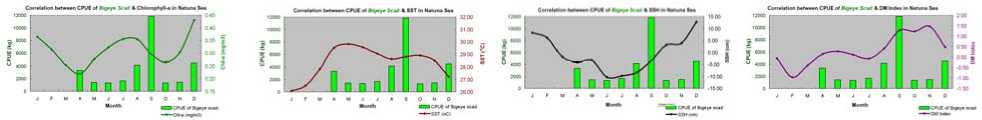
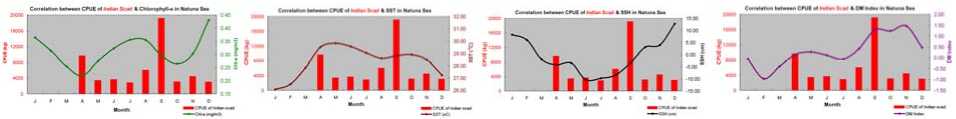
Figure 6. Monthly correlation of (a) Goldstripe sardinella (b) Bigeye scad (c) Indian scad Production with Oceanographic parameter in Natuna Sea
The correlation between fish catch production of Bigeye scad and Dipole Mode tend to increase for 4 years, it has almost similar with the chlorophyll-a which is shows positive correlation. The fish catch production is high when positive dipole. This condition corresponds to annual variation of dipole mode and chlorophyll-a concentration which is during positive dipole the chlorophyll-a concentration is high. It is shows that there is positive correlation between fish production of Bigeye scad to the chlorophyll-a and positive dipole. The annual correlation
of Indian scad with oceanographic parameters in Natuna Sea shows similarity pattern with Bigeye scad. This condition corresponds to the research of Hendiarti et al., 2005 that Bigeye scad has a similar pattern to Indian scad for annual and monthly fish catch production in Java Sea either Natuna Sea.
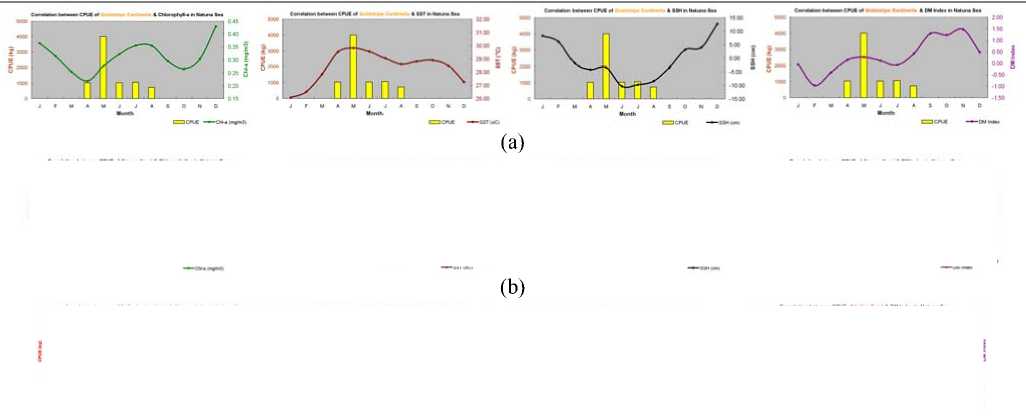
The correlation between CPUE of Goldstripe sardinella to Chlorophyll-a was presented in Figure 6a1, it has show that there is no similar pattern of both. The peak fish catch occurred when chlorophyll-a is low. The pattern of CPUE during April-August show the positive correl-
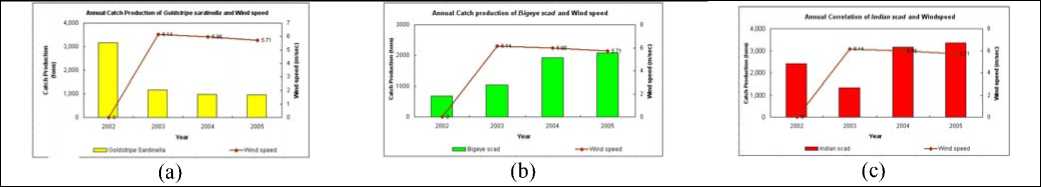
Figure 7. Annual correlation of Small Pelagic Fish Production and wind parameter in Natuna Sea
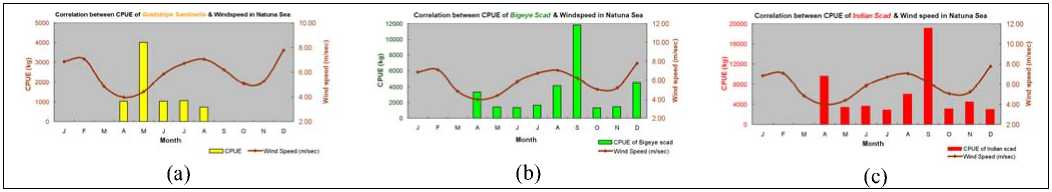
Figure 8. Monthly correlation of Small Pelagic Fish Production and wind in Natuna Sea
ation between SST and CPUE which was the CPUE is high when the SST also high (Figure 6a2). It was indicated that the Goldstripe sardinella has a strong correlation with SST; it has condition either shown in annual fish catch production to the annual SST. Figure 6a3 show that there is no similar pattern between SSH and fish catch production. The fish catch production of Goldstripe sardinella and Dipole Mode has a positive correlation, high catch production was found when positive dipole and it has decrease in negative dipole (Figure 6a4).
Figure 6b1 and 6c1, The CPUE of Bigeye and Indian scad shows the similar trend, but the total CPUE of Indian scad is higher. Peak fish catch of Bigeye and Indian scad occurs during SE monsoon in September and decrease in transition period (October). This pattern of fish catch corresponds to Hendiarti et al., 2005, which pelagic species were found in Java and Natuna Sea from May to August (SE monsoon). Peak fish catch occurred annually during the SE monsoon. Beginning in September–October (the transition season), fish catch decreased. This decrease continued until the NW monsoon began, and reached its lowest point in December–January. The catch began to increase again in March–April (transition season).
Figure 6b1 and 6c1, shows the positive correlation between CPUE of Bigeye scad and Chlorophyll-a concentration. The highest CPUE occurs after peak of chlorophyll-a in August. It was condition indicates there is time lack about 1 month to reach peak of fish catch after highest chlorophyll-a condition. If comparing the correlation of small pelagic catch to the chlorophyll-a will appear that the Indian scad and Bigeye scad has feed consume higher than Goldstripe sardinella. This condition corresponds to the preferences parameter was classified by
Fishbase, 2006. The preference parameter related to feed consume of small pelagic representative by PP/Primary Production (Table 1). There is a high correlation between chlorophyll-a concentration to PP. Total primary production resulting from the photosynthetic process can be defined as the amount of organics matter produced. The primary production is proportional to the chl-a values in the surface layer of the ocean (Zagaglia et al, 2004 in Hiroyuki and Winarso, 2006 in Iwan, 2008). Correlation Coefficient between Chl-a and Primary Production is 0.99.
Table 1.The Preferences Parameters of Small Pelagic Fishes
|
Fish |
Temp (oC) |
PP |
|
Goldstripe Sardinella |
22.19 - 29.24 |
309 - 1485 |
|
Bigeye scad |
22.74 - 29.06 |
328 -1606 |
|
Indian scad |
7.24 - 29.37 |
656 - 3145 |
Source: www.fisbase.org, 2006
Weather Condition and Small Pelagic Fishes
The wind direction blows to the southeast and it deflected to southwest during SE monsoon. During NW monsoon the wind direction blows toward the northwest (Asia). Generally, wind direction shows the seasonal condition that affected by monsoon. The average of wind speed for six years shows that maximum in January (14.9 knot) and December (14.5 knot). The minimum wind speed was found in April (transition period) and October it has 8.1 knot and 10.2 knot, respectively. In August, as the peak of SE monsoon the wind speed is 10.2 knot it has lower than January and December (NW monsoon).
Figure 7a is the correlation between average wind speed and catch production of Goldstripe sardinella during 2002-2005, it has contrary correlation which was high
catch production in lowest winds peed. It is mean there is no correlation between wind speed and Goldstripe sardinella. Figure 7b and 7c shows the proportional correlation where the Bigeye and Indian scad have high catch production when the wind speed is high. This condition corresponds to research of Hendiarti et al., 2005, that shows the annual fish-catch pattern is determined by monsoonal activity. The monsoon greatly influences the appearance of warm and rich surface currents in the Java Sea, surface water transport and upwelling in the Sunda Strait, upwelling in the Indian Ocean, and indirect upwelling in the Bali Strait. The process Ekman pumping also occurs in Natuna Sea, because the Java and Natuna Sea located on Sunda shelf it was shallow waters.
Figure 8a shows the correlation between wind speed and catch production of Goldstripe sardinella, it has similarity with chlorophyll-a concentration because the monthly chlorophyll-a has a similar with wind speed. It is means high fish catch occurs in moderate chlorophyll-a concentration. Figure 8b shows the positive correlation between CPUE of Bigeye scad and Chlorophyll-a concentration. The highest CPUE occurs after peak of wind speed in August. It was condition indicates the high catch production occurs when wind speed and chlorophyll-a condition. This pattern and condition has similarity with Indian scad (Figure 8b). So the peak season of small pelagic fish occurs during SE monsoon (May-September) and low season during NW monsoon. Hendiarti et al., 2005, reported that the “pelagic fish season” develops during the SE monsoon. Variability in the annual fish catch patterns in Natuna Sea show similar maximum and minimum peaks during the SE and NW monsoon, respectively. However, the monsoon system affects coastal processes differently, which influences the variability of the fish catch and fish distribution.
Fishing Ground Map of Small Pelagic Fishes
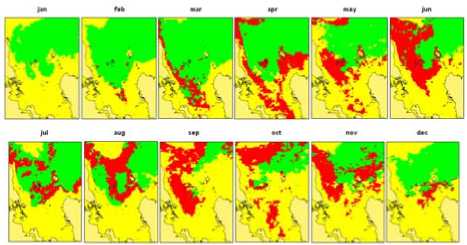
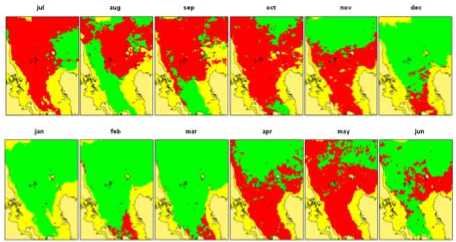
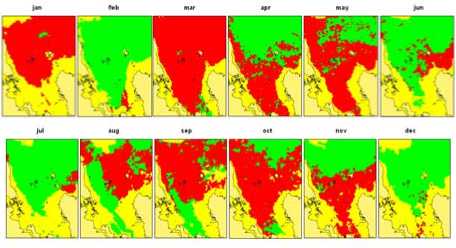
By GIS (Geographic Information System) technique the monthly fishing ground map was classify into three categories which are High Potential (red color), Potential (green color) and Low Potential (yellow color) it was determined based on range of environment parameter which was preferred and favorable for fishing operation (Table 2).
Table 2. Oceanography parameters to determine the fishing ground by GIS analysis
|
VARIABLE |
HIGH POTENTIAL |
POTENTIAL |
LOW POTENTIAL | ||||||
|
GS |
BS |
IS |
GS |
BS |
IS |
GS |
BS |
IS | |
|
SST (oC) |
28.0 – 29.0 |
28.5 – 29.5 |
28.6 – 29.6 |
≤ 28.0 |
≤ 28.5 |
≤ 28.6 |
≥ 29.0 |
≥ 29.5 |
≥ 29.6 |
|
CHL-A (mg/m3) |
0.13 – 0.30 |
0.10 – 0.5 |
0.10 – 0.40 |
≤ 0.13 |
≤ 0.10 |
≤ 10.0 |
≥ 0.30 |
≥ 0.5 |
≥ 40.0 |
GS : Goldstripe sardinella BS : Bigeye scad IS : Indian Scad
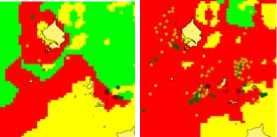
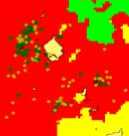
Then the fishing ground map was match-up with the positions of fishing operation by fisherman to know the percentage match-up ratio for accuracy test the fishing ground map have been made. The match-up ratio is based on the ratio of number of fishing operation points that was located on the High Potential region of fishing ground map to the total of fishing operation points for one month, meanwhile the points outside the high potential region was not considered. The data will use to match-up is the fishing operation data for 2007. The monthly prediction maps of small pelagic fishes have been made for each species and its match-up (sample match-up for August) was presented in Figure 9 and Table 3. Figure 9. Fishing ground map its match-up of (a) Goldstripe Sardinella; (b) Bigeye Scad and (c) Indian Scad to Fishing Position by Fisherman (d, e, f) in Natuna Sea.
Table 3. Match-up ratio Fishing Ground by GIS and by fisherman in Natuna Sea
|
Month |
Goldstripe sardinella |
Bigeye scad |
Indian scad | ||||||
|
FG -Fsm |
FG -GIS |
Ratio |
FG -Fsm |
FG -GIS |
Ratio |
FG -Fsm |
FG -GIS |
Ratio | |
|
Apr |
4 |
4 |
1 |
102 |
70 |
0.68 |
147 |
80 |
0.54 |
|
May |
4 |
1 |
0.25 |
102 |
99 |
0.97 |
177 |
168 |
0.94 |
|
Jun |
4 |
1 |
0.25 |
110 |
91 |
0.83 |
176 |
130 |
0.74 |
|
Jul |
6 |
4 |
0.67 |
56 |
22 |
0.4 |
142 |
5 |
0.04 |
|
Aug |
9 |
8 |
0.89 |
134 |
120 |
0.89 |
143 |
141 |
0.98 |
|
Sep |
- |
- |
- |
25 |
22 |
0.88 |
30 |
29 |
0.97 |
|
Oct |
- |
- |
- |
54 |
48 |
0.88 |
116 |
108 |
0.93 |
|
Nov |
- |
- |
- |
115 |
106 |
0.92 |
184 |
168 |
0.91 |
|
Total |
27 |
18 |
0.61 |
698 |
578 |
0.81 |
1115 |
829 |
0.76 |
FG-Fsm : Fishing Ground by Fisherman FG-GIS : Fishing Ground by GIS
The total average of match-up ratio for Bigeye scad fishing ground map is 0.81 or 81%, Indian scad is 0.76 or 76% and Goldstripe sardinella is 0.61, respectively. It is mean the accuracy of Bigeye scad fishing ground map is highest rather than two other species.The fish catch production of Indian scad is high rather than Goldstripe sardinella as according to Potier et al., 1995 the Indian scad is the neritic population which are caught throughout the year by seines during August-November. Meanwhile, the Goldstripe sardinella is the coastal populations which are caught throughout the year in lower quantities.
CONCLUSIONS
-
1. Annual fish catch production of Bigeye Scad and Indian Scad was tends to increase from 2002-2005 and reversely for Goldstripe sardinella. During SE Monsoon (May-September) the CPUE of Bigeye Scad and Indian Scad is high, that is condition contrarily in
a
b
c
Sample match-up for August


NW Monsoon (November-April). The CPUE of Goldstripe sardinella production is high in early SE Monsoon (May).
-
2. During the SE Monsoon (May-September) when DMI is positive (+) the Indian Scad and Bigeye Scad production is high, for Goldstripe sardinella the fish production is high when DMI is positive (+) in May.
-
3. The accuracy of prediction map of small pelagic fishing ground in Natuna Sea is about 0.61, 0.76 and 0.81 for Goldstripe sardinella, Indian scad and Bigeye scad.
RECOMMENDATIONS
-
1. SE and NW monsoon very influences of fish catch production in Natuna Sea, fishing operation most conducted during SE monsoon (May-October).
-
2. The small pelagic fishing ground map has been produced by GIS must be test again using fishing operation data for fisherman to get the high accuracy.
REFERENCES
Badrudin and Sumiono. B. (2005). Pengkajian Stok Sumberdaya Ikan di South China Sea. Forum Pengkajian Stok Sumberdaya Ikan Laut. Pusat Riset Perikanan Tangkap (PRPT). Badan Riset Kelautan dan Perikanan (BRKP). Departemen Kelautan dan Perikanan (DKP). Jakarta.
Hendiarti N., Suwarso, Aldrian E., Amri K., Andiastuti R., Suhendar I.S. and Ikhsan B.W., 2005. Seasonal Variation of Pelagic Fish Catch Around Java. The Indonesian Seas; Oceanography Vol. 18, No. 4, Dec. 2005.
Iwan, K.S. 2008. Primary Production And Fish Production Estimation Derived From Satellite Data In Banda Sea. Master Thesis. Udayana University.
Potier, M. and B. Sadhotomo. 1995. Exploitation of the large and medium seiners fisheries. Pp. 195–214 in BIODYNEX: Biology, Dynamics, Exploitation of the small pelagic fishes in the Java Sea, M. Potier and S. Nurhakim, eds. AARD/ORSTOM.
Fishbase. 2006. Mapping parameters for small pelagic fish. Downloaded from
http://fishbase.sinica.edu.tw/tools/AquaMaps/Sh owMapParam.php?SpecID=Fis-22872&graph=&user_session=31&bp=-1, at April 30, 2008.
14
Discussion and feedback