LAND SUBSIDENCE IN SEMARANG
on
ISSN: 1907-5626
ECOTROPHIC • 7 (2) : 111 · 115
LAND SUBSIDENCE IN SEMARANG
Supabadevi A.S1), Tashiro 0sawa2), I Nyo^^Meritj3)
-
1) Center for Remote Sensing and Ocean Science (CReSOS) Udayana University
-
2) Environmental Research Centre, Udayana University suprabadevi@lyahoo.com
ABSTRACT
This research aims to identify monitoring land subsidence in Semarang has been done using raster data operation of the DEM in GIS environment. Digital representation of relief of Semarang area was generated from a point map which contains elevation data. The last update of the elevation data was made using geodetic, using Global Positioning System (GPS).
Decrease in land distribution is estimated from the data of GPS Geodetic years 2008-2011, in the Semarang area north, west, central, east and south. Reduction in the range of 2008-2009 reached -12.4 cm, then increased in 2009-2010 to be -20-4 cm and -10.5 cm fell back to the years 2010-2011. Decline in the face of the land in Hyderabad occurs mainly in the n01th, east, central and south of Semarang.
Subsidence causing damage to infrastmcture, buildings, and results in moving tidal lowlands.damage potential economic loss is cracks in buildings and infrastmcture (roads and bridges), the number of homes that have been tilted and nearly drowned. In addition to direct losses, reduction in ground level also cause indirect losses that rob the increasingly widespread flooding in the northern region of Semarang.in 20082010 June-July with a high tide occurs o.6 cm from the surface of the sea water in the area of Semarang.
Key words: land subsidence, rob, GPS Geodetic, DEM
ABSTRAK
Penelitian ini bertujuan untuk mengidentifikasi pemantauan penurunan tanah di Semarang telah dilakukan dengan menggunakan raster operasi data DEM di lingkungan GIS. Sebuah representasi digital dari relief daerah Semarang yang dihasilkan dari peta yang berisi titik data elevasi. Update terakhir dari data elevasi dibuat menggunakan geodetik, dengan menggunakan Global Positioning System (GPS).
Distribusi Penumnan tanah yang diperkirakan dari data GPS Geodetic tahun 2008-2011, di daerah Semarang utara, barat, tengah, timur dan selatan. Pada rentang tahun 2008-2009 penurunan mencapai -12-4 cm, kemudian meningkat pada tahun 2009-2010 menjadi -20-4 cm dan turun kembali menjadi -10.5 cm di tahun 2010-2011.
Penurunan muka tanah di Semarang terjadi terutama di wilayah utara, timur, tengah dan selatan Semarang. Penurunan tanah menyebabkan kerusakan pada infrastruktur, bangunan, dan hasil dalam pasang surut bergerak kedaerah dataran rendah. kerusakan yang potensial menyebabkan kerugian ekonomi adalah keretakan pada bangunan clan infrastruktur Galan clan jembatan), banyaknya rumah yang sudah miring dan hampir tenggelam.
Selain kerugian langsung, penumnan muka tanah juga menyebabkan kerugian tidak langsung yakni makin meluasnya banjir rob di wilayah utara Semarang. Pada bulan Juni-Juli tahun 2008-2010 terjadi pasang surut dengan tinggi o,6 cm daripermukaan air lautdi wilayah Semarang.
Kata lamci: penurunantanah, rob, Geodetic GPS, DEM
INfRODUCTION
Semarang is one of the largest cities in Indonesia and is currently suffering from an extended land subsidence, which caused the withdrawal of ground water, for a natural consolidation of alluvium soil and construction loads. Physical processes, such
as wave, tidal flooding, rising sea levels, erosion, sedimentation and various weather phenomena play an important role in the development of the coastal landscape.(Semarang City, 2009). In addition, the beach is also facing many environmental challenges relating to human-induced impacts. Most of the global population inhabiting urban
areas near the coast to take advantage of ocean and coastal resources. Human development of coastal areas for industrial, residential, recreational and aesthetic issues contribute to land use, reducing coastal natural habitats, and increasing withdrawal of ground water causes ground subsidence. (Sutanta, 2002)Subsidence causing damage to infrastruch1re, buildings, and results in moving tidal lowlands(Murdohardono, et al., 2009). Until now, there has been no comprehensive information and monitoring of land subsidence in Semarang. The purpose of this study examines the digital elevation model (DEM) and data standards in Geographic Information Systems (GIS) raster operation for distribution of land subsidence in Semarang. This method will predict and measure the extent of subsidence. Prediction of soil degradation resulting from the expected future DEM in GIS.(Marfai, 2004).This calculation is based on the assumption that the rate of soil degradation and to identify areas of subsidence in Semarang.
METHODOLOGY OF RESEARCH
Location and Time of the Study
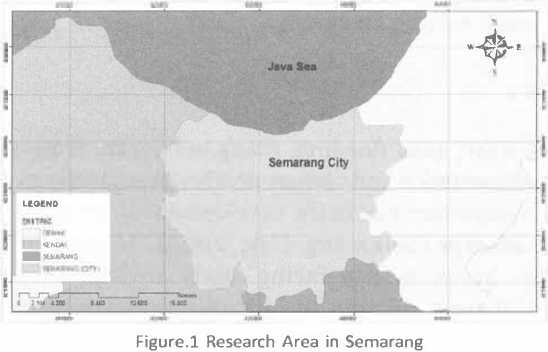
Semarang is a coastal urban area situated on Javalsland in Indonesia. It is located at the northern coastof Java and about 500 km East of Jakarta (the capital city of Indonesia). Semarang is positioned at the coordinates of about at 6°58'S and 110°25'E. The time of study is from April to June 2012.
Research Mateiial
The materials were use such as Bench mark Data 2008-2011. Latih1de, longitude Semarang area, Tidal data ,June-July 2008-2011 and DEM 2010 ALOS PALSAR data Semarang and IKONOS Semarang and Tidal data June-July 2008-2010 and Tidal data 2008-2010 from BMKG Semarang.
Research Instrnment
Computer Intel Pentium Dual-Core Processor T2330 and Mouse, ENVI 4.8 (External Software SARScape)Software Arcgis 9.3
Data Analysis
-
1. Satellite Imagery (DEM)
DEM from AlosPalsar Semarang in .January of 2010 and March of 2010 processed with software Envi 4.8 and Sarscape. Subsidence data source from GPS, is converted in Arcgis 9.3 the form of the vector and point data in order to be processed in the builder. The map subsidence distribution maing procedures are as follows: Overlay Preparation Dem 2010 from AlosPalsar Semarang with total and average subsidence data from GPS data in 20082011. Creating color classification based on the DEM pixel height, and then create a parameter subsidence into five classes based on the decline.
-
2. Satellite Imagery (Ikonos)
Preparationtidal data in June-July 2008-2010 with subsidence overlay with IKONOS 2008 in Arcgis9.3 .
RESULT AND DISCUSSION
Land subsidence phenomenon in Semarang
Land subsidence in Semarang has been widely reported and its impacts can be seen already in daily life. It can be seen in the forms of coastal flooding (it is called rob by the locals) that its coverage tends to enlarge by times.This frequent and severe rob not just deteriorate the function of buildingand infrastructures. It also badly influences the quality of living environment and life,health and sanitation condition in the affected areas. Cracking of buildings andinfrastmcture, and increased inland sea water intrusion, are also other impacts of landsubsidence. Since 1983 government agencies have monitored the subsidence and implemented several measures to mitigatethe problem. Benchmark, as a point of reference for a measurement, have been installed by the citygovernment in the Semarang areas, both on the hilly and coastal areas with the selial number "DTK", "JP", and "TTG". In 1996/1997 the Mining Department of Semarang also installed some benchmarks to establishthe elevation of nearby points with the serial numbers "BM".(Marfai and King, 2007).In this case, stability of the benchmark with respect to its local environment and repeatability of the heights obtained from benchmarkpoint are
used as the main criteria for selecting thepoints. After the installation and distribution not allthe benchmarks provide time series data and evensome of them are damage due to unstable conditionand other environmental disturbance. 33 points are considered the most reliable the points are situated on thelowland area of Semarang. Almost all the benchmarksinstalled in coastal areas and surroundings are affectedby land subsidence to some extent (Table 1 and Table 2). Spatialdistribution of the benchmark data is shown in (Figure 2).From Tableand Figure 3.Can be seen that even all observed points are located on the lowland of Semarang, they vary both spatially and temporally.The relationship of land subsidence with DEM 2010 in figure 4 and 5.The relationship of land subsidence are plottedwith respect to their elevationsFig. 6 and Figure 7.And the the relationship tidal drob and land subsidence in Fig 8 and Fig 9.
Tablel. GPS-derived Subsidence Result in Semarang from 2008 to 2011{Abidin, 2010)
|
No |
BM |
^eed Subsidence (cm_) |
Total (cm) |
Average (cm) | ||
|
2008-2009 |
2009-2010 |
20101-2011 | ||||
|
1 |
259 |
-1 |
-1.6 |
-2.9 |
-5.5 |
-1.83 |
|
2 |
1106 |
-6.2 |
-2.2 |
-2.7 |
-11.1 |
-3.7 |
|
3 |
1114 |
-4.8 |
·0.4 |
-0.6 |
-5.8 |
-1.93 |
|
4 |
1124 |
•3.4 |
-5.2 |
-8.5 |
-17.1 |
-5.7 |
|
5 |
1125 |
-4.1 |
-S.6 |
0 |
-9.7 |
-3.23 |
|
6 |
1303 |
-0.8 |
0 |
-1.1 |
-1.9 |
-0.63 |
|
7 |
AYlS |
-2 |
-1 |
-1.1 |
-4.1 |
.1.37 |
|
8 |
BMOl |
-12.4 |
-10.5 |
-10.5 |
-33.4 |
·11.1 |
|
9 |
BM05 |
-4.5 |
-7.7 |
-5.4 |
-17.6 |
-5.87 |
|
10 |
BMll |
-3.5 |
-10.7 |
3.3 |
-17.5 |
-5.83 |
|
11 |
BM12 |
-9.4 |
-3.5 |
-3.5 |
-16.4 |
-5.47 |
|
12 |
BM16 |
-1.5 |
-0.1 |
0 |
-1.6 |
-0.53 |
|
13 |
BM30 |
-8 |
-8.8 |
-8.6 |
-25.4 |
-8.47 |
|
14 |
BTBR |
-6.1 |
·20.4 |
.7 |
-33.5 |
·11.2 |
|
15 |
DRIP |
-11.3 |
-10.6 |
-5.8 |
-27.7 |
·9.23 |
|
16 |
ISLA |
-4.4 |
·19.3 |
-8.7 |
-32.4 |
-10.8 |
|
17 |
K370 |
-3 |
O |
0 |
-3 |
-1 |
|
18 |
K371 |
-1.8 |
-0.9 |
-3.5 |
-6.2 |
-2.07 |
|
19 |
KOPS |
-4.7 |
-0.9 |
-0.5 |
·6.1 |
·2.03 |
|
20 |
MRON |
-7.9 |
-8.1 |
-5.8 |
-21.8 |
-7.27 |
|
21 |
MSJD |
·8.6 |
-10.5 |
0 |
-19.1 |
-6.37 |
|
22 |
PBRl |
-4.9 |
-19.3 |
-7.7 |
-31.9 |
-10.6 |
|
23 |
PMAS |
-8.3 |
O |
-10.3 |
18.6 |
-6.2 |
|
24 |
QBLT |
-7.3 |
-5.8 |
-7.8 |
-20.9 |
-6.97 |
|
25 |
5001 |
-3.9 |
0.7 |
0 |
-3.2 |
-1.06 |
|
26 |
5002 |
-3.6 |
-7 5 |
0 |
-11.1 |
-3.7 |
|
27 |
SMGl |
-1.2 |
09 |
-8 |
-8.3 |
-2.77 |
|
28 |
SMG2 |
-10.1 |
-10.8 |
·9.9 |
-30.8 |
-10.3 |
|
29 |
SMG4 |
-5.2 |
-14.8 |
-4.8 |
-24.8 |
-8.27 |
|
30 |
SMKN |
-4.8 |
-8.7 |
-5.1 |
-18.6 |
-6.2 |
|
31 |
SMPN |
-10.4 |
·6.1 |
-4.8 |
-21.3 |
-7.1 |
|
32 |
T374 |
-2.8 |
-0.9 |
0 |
-3.7 |
-1.23 |
|
33 |
TMAS |
-6.2 |
-0.9 |
-3.5 |
-10.6 |
-3.53 |
Table 2. GPS-derived Subsidence Rates in Semarang from 2008 to 2011(Abidin, 2010)
|
Method |
Period |
Subsi^nce Rates cm/year | |
|
Min |
Max | ||
|
2008-2009 |
-1 |
12.4 | |
|
GPS surveys |
2009 2010 |
0 |
20.4 |
|
2010-2011 |
0 |
10.5 | |
The maximum subsidence rates of during 20082009 ranging from -1 to -12-4 cm, 2009-2010 ranging from o to -20.4 cm, and 2010-2011 ranging from o to -10.5 cm. Total land subsidence observed by benchmark data dming the period of 2008-2011 the minimum about -1.6 cm and maximum about -33.5 cm and occurs on the point with elevations of about a few centimeter. Average land subsidence observed by benchmark data during the peJiod of 2008-2011 and the minimum about -0.53 cm and maximum about -11.2 cm
.soo2 .1(311 er.•30 .
•
A2.S9 •
A1'1l•'·'Pf'l9
A1124 ^U^ • SFCP
SP^
41106
VTRt. •
.
SIA Pt,
K0111
• Af15
T4'7
•
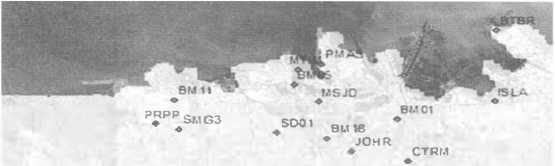
Figure.2 Benchmark DataDistribution of Monitored Benchmark Data and IKONOS Image
Figure 2 showed benchmark areas had pattern point overlay use IKONOS. The distribution of land subsidence can be identified from elevation data. Figure 5.1 also showed the area of subsidence.
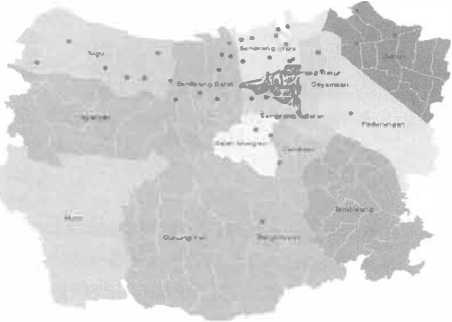
Figure.3 Points are Located on the Lowland of Semarang
Figure 3 showed subsidence area in population and urban development activities of Semarang. (Public Work Department of Semarang PWD, 2000). The subsidence area is north, east, west, south and center Semarang. Location of a point that is widely available in north, and center Semarang.

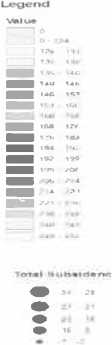
_ ∣∙
Io tz• 1 ,.
Jn 3⅛ ^BB i;$ 40
^—^o ^ ^—Ut 63 ^—1') '0Q
I ,an f;lo -··· ·· -•1111 •N — ^^B ∣ι ι"
- 11,e.r.
_11 ,,.. -· r2•
∣L k I Fx. ?30 liN 1-1• • 140 ,4⅛ --]N« WB
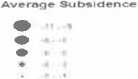
Figure 4.Relationship Average Subsidence Rate 2008-2011 and DEM 2010
There are five classifications is rate average subsidence. From DEM, in comparison with GPS-derived average subsidence in year 2008-2011, In the Figure 4. Can be seen that large subsidence are -11.2 cm and the low is -0.53 cm.
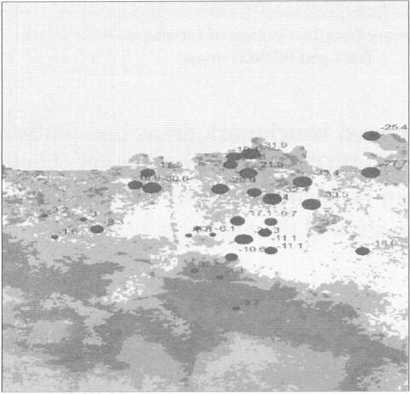
Figure 5. Relationship Total Subsidence Rate 2008-2011 and DEM 2010
In the Figure 5. shows five classifications from DEM , in comparison with CPS-derived total subsidence inyear 2008-2011, can be seen that large subsidence are -33.5 cm and the low is -1.6 cm.
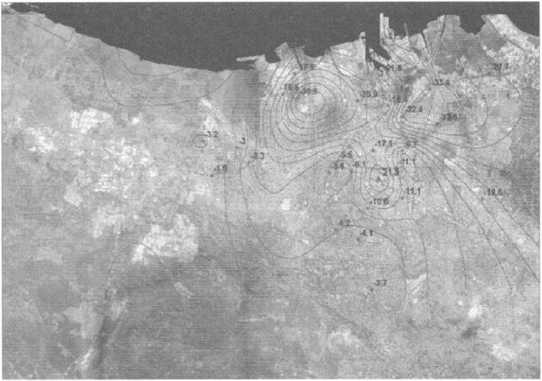
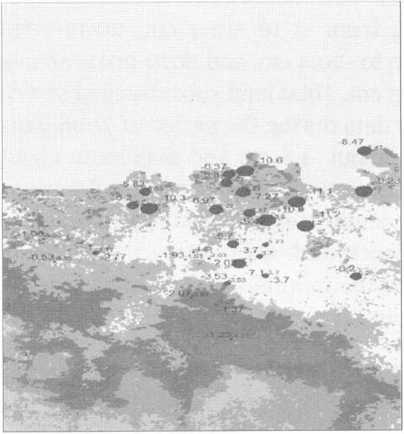
Figure 6. Total of Land Subsidence from 2008 to 2011 and overlay IKONOS (2008 November 16) resolution -lm Satellite Imagery
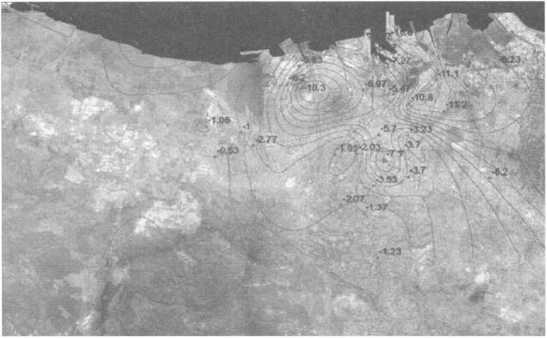
Figure 7.Average of Land Subsidence from 2008 to 2011 and overlay from IKONOS (2008 November 16) -lm Satellite
Imagery
The highest decrease in the total land area of Semarang with a value of-33.5 cm East Semarang, North Semarang with a value of -31.9 cm, 17.1 cm Semarang Central, South Semarang-11.1 cm while the average rate of decreasing in highest land in East Semarang area with a value of-11.1 cm, North Semarang with a value of-10.6 cm, Semarang, Central -7.1 cm, -6.2 cm South Semarang. Areas that suffered severe damage due to decreased ground level is the north and east as the Hasanudin cottage, Tawang station, Tanah Mas, Port, Kaligawe, RadenPatah, Citarum, Genuk.(Abidin, 2005).
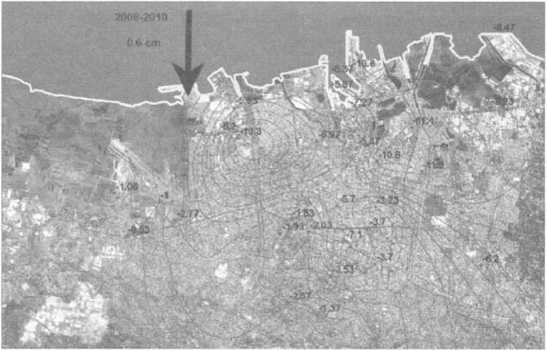
Figure 8 Relationship Average Subsidence and Tidal Rob 2008-2010
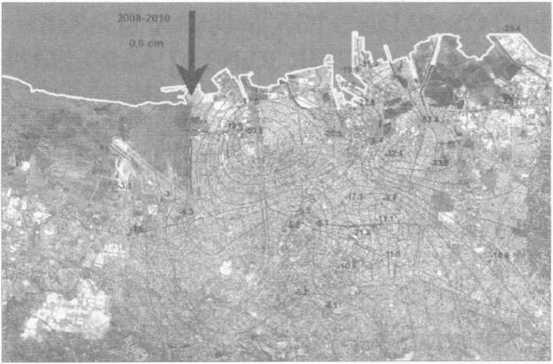
Figure 9 Relationship Total Subsidence and Tidal Rob 2008-2010
Value of the rate of sea level rise is corrected \-\'ith the data reduction, so it would know the value of sea level rise in Semarang waters caused by global warming factor.(Marfai, 2007). LLWL value and HHWL year 2008-2010 in .June-.July is o -1.2 cm. In the Figure 5.8 and Figure 5.9. Shows tidal value o.6 cm is MSL.
CONCLUSIONS
Conclusions
-
1. The maximum Subsidence Rates of 2008-2009 ranging from -1 to -12.4 cm, 2009-2010 ranging from o to -20,4 cm, and 2010-2011 ranging from o to -10.5 cm. Total land subsidence observed by benchmark data during the period of 20082011 the minimum about -1.6 cm and maximum about -33.5 cm and occurs on the point with elevations of about a fe\.v centimeter. A,erage land subsidence observed by benchmarh data during the period of 2008-2011 the minimum about -0.53 cm and maximum about -11.2 cm. In addition to direct losses, reduction in ground level also cause indirect losses that rob the increasingly widespread flood, in .June-.July with a high tide occurs o.6 cm from the smface of the sea water in the area of Semarang.
-
2. BMKG tidal data obtained, dming the three years from 2008 to 2011 in .June-.Jnl) in the event of a flood Rob, made the cha1ts and look for value HHWL(Highest High Water Level), MSL(Mean Sea Level) and LLWL(Lowest Low Water Level). Value of the rate of sea level rise is corrected ,vith the data reduction, so it would know the value of sea level rise in Semarang waters caused by global wa1ming factor. LLWL value and HHWL year 2008-2010 in .June-July is o -1.2 cm. In the Figure 5.8 and Figure 5.9. Shows tidal value o.6 cm is MSL.
Suggestion
-
1. Measurements BM (Bencmark) elevation at regular intervals at least once a year to find out (prove) the stability of the BM (Bencmark).
-
2. This institutional framework particularly at district, city level provides support for the implementation of the hazard mitigation.
REFFERENCES
Abi<lin. 11.Z. 200!). "SuistabilityofLevclling. GPS an<l INSAR for Monitoring Land Subsidence in Urban Areas of Indonesia.''GIM lnternasional. The Global Magazine for (^comatics, Grrc Publication, Volume HJ, Issue 7, .July, pp. 12-1."j.
Abidin. 11.Z. 2010. (;J'S Positioning and Apllications.In Indonesian T.anguange.P.TPradnyaParamita, ,Jakarta. Edition 3.ISBN 978-979-408-;377-2.;198 pp.
Marfui MA. 2004. Tidal Flood Ilar.ardA'isessmenl: Modelling in RasterG!S, Case in Western Part ofScmamng Coastal Arca. Indones ,J Gcogr 36(1):2."j-38.
Marfai MA 2007. Moniloring Land Subsidence in Semarang, Indonc.'.-;ia. Environmental Geology 53 (3): 651-659.
Marfai, MA. King, L. 2007. Monitoring Land Subsidence in Semarang, ln<lonesia.Environmcntal Geology 5:3 (:3), 651-659.
Murdohardono, D.. G.M. Sudradjat, A.D. Wirakusumah F. Kuhn. F. Mulyasaii. 2009. "Land Subsidence Analysis through Remote Sensing and lmplementalion on Municipality LcycJ; Case Study: Semarang Municipality, Central ,Java Province, Indonesia".
Sutantu, 11. 2002. Spatial Modeling of the Impact of Lan<l Subsidence an<l Sea Lc\'el
Rise in A Coastal C'rban Selling, case study: Semarang, Central ,Java, Indonesia.M.Sc. thesis (unpublished) al the International Institute forGeo-infonnationSeicnce an<l Earlh ObserYation (ITC), Nelherlands.
Public Works Departmenl of Semarang (PWD). 2000. Semarang urban <lrainage master plan. Public Work Department, Semarang.
Semarang City .2009.0ficial website of Semarang munipal-ily).Addrcss :hllp://www.scmarang.go.id/, access <late: I ,Jul).
BM KG.Meteorology and ("ieophysics Agency. 2008. Semarang.
115
Discussion and feedback