ESTIMATION OF FISH PRODUCTION AROUND INDONESIA ARCHIPELAGO USING SATELLITE DATA
on
ECOTROPHIC • 6 (2): 146 - 150
ISSN: 1907-5626
ESTIMATION OF FISH PRODUCTION AROUND
INDONESIA ARCHIPELAGO USING SATELLITE DATA
ANAKAGUNGAYU PUTRININGSIH1), TAKAHIRO 0SAWA2), IWAYAN REDIAR.YANTA3)
-
1) Master Program of Environmental Science Udayana University
-
2) Center for Remote Sensing and Ocean Sciences (CReSOS) Udayana University
-
3) Environmental Sciences Postgraduate Program Udayana University
ABSTRAK
Indonesia sebagai negara kepulauan memiliki potensi sumberdaya ikan yang sangat besar dan keanekaragaman hayati yang tinggi. Sumber daya ikan pada suatu perairan dapat di estimasi dengan mengetahui kandungan produktivitas primer perairan tersebut. Tujuan penelitian ini adalah untuk memperkirakan variabilitas parameter lingkungan (suhu perrnukaan laut dan konsentrasi Chl-a) di seluruh Kepulauan Indonesia melalui data satelit dan untuk memperkirakan produksi primer dan produksi ikan di seluruh Kepulauan Indonesia.
Lokasi data penelitian mencakup seluruh wilayah perairan laut Indenesia yang meliputi sembilan Wilayah Pengelolaan Perikanan Indonesia (WPPI), dari tahun 2004 sampai 2006. Untuk menghitung produktifitas primer digunakan Vertically Generalized Production Model (VGPM) yang diperkenalkan oleh Behrenfeld and Falkowski (1997a), sedangkan untuk menghitung produksi ikan digunakan fish production model yang diperkenalkan oleh Pauly dan Christensen (1995). Estimasi produksi ikan hasil perhitungan dibandingkan dengan data produksi ikan yang didapat dari Departemen Perikanan dan Kelautan Indonesia.
Dari seluruh wilayah perairan laut Indenesia Variasi rata-rata SST dan chl-a tertinggi diperkirakan di wilayah Laut Arafuru, sedangkan variasi terendah diperkirakan di wilayah Laut Sulawesi dan samudra Fasifik. Produksi ikan total tahunan dari model menunjukkan nilai tertinggi diperkirakan di Samudera Hindia (1.614.135,44 tons) dan terendah diperkirakan di Selat Malaka (268.305.64 tons). Di sisi lain, produksi ikan total tahunan dari Departemen Perikanan dan Kelautan menunjukkan nilai tertinggi dan terendah masing-masing diperkirakan di wilayah Laut Jawa (850.151 tons) dan Laut Banda (198.078 tons). Korelasi antara produksi ikan data satelit dan data Departemen Perikanan dan Kelautan Indonesia tertinggi ditemukan di Wilayah Laut Arafuru dengan R = 0,97. Sembilan wilayah pengelolaan perikanan Indonesia selama tahun 2004 sampai 2006 dikategorikan sebagai zona penangkapan ikan yang tereksploitasi penuh sampai berlebihan.
Kata kunci: produktifitas primer, produksi ikan, wilayah pengelolaan perikanan indonesia
ABSTRACT
Indonesia as an archipelagic country has the potentiality of a huge fishery resources and high biodiversity. Fish resources in the waters can be estimated by knowing the content of the primary production (PP) of these waters. The aim of the research are to estimate the variability of environment parameter (SST and Chl-a concentration) and to estimate of PP and fish production (FP), derived from satellite around Indonesia Archipelago.
The research was conducted in nine of Indonesia Fisheries Management Area from 2004 to 2006. The PP was calculated by Vertically Generalized Production Model (VGPM), which was introduced by Behrenfeld and Falkowski (1997a). The model introduced by Pauly and Christensen (1995) calculated the FP. The estimation of FP from model was compared to the FP data from the Department of Marine and Fisheries Resources of Indonesia.
In the territorial waters of Indonesia Archipelago the highest variations ofaverage SST and Chl-a was estimated at Arafuru Sea, whereas the lowest variation was estimated at Sulawesi Sea and Pacific Ocean. The total annual fish production from the model showed the highest and the lowest values were estimated at Indian Ocean (1,614,135.44 tons) and Malacca Strait (268,305.64 tons), respectively. On the other hand, the total annual fish production from Department of Marine and Fisheries Resources of Indonesia showed the highest and the lowest values were estimated at Java Sea (850,151 tons) and Banda Sea (198,078 tons), respectively. The highest correlation between fish production from satellite data and the data from Department of Marine and Fisheries Resources of Indonesia was found at Arafuru Sea with R = 0.97. The nine fisheries areas of Indonesia during 2004 to 2006 were categorized as fully until over exploited fishing zone.
Keywords: primary productivity,fish production, indonesiafisheries management area
INTRODUCTION sustainable yield of sea fish is estimated at 6-4 million
tons per year, spreading in nine major maritime zones.
As a maritime state, Indonesia is rich in fish in FP between the satellite view of ocean colors, the term of quantity and variety. The country's maximum production of zooplankton and the average annual
landings of fish species. Pauly and Christensen (1995) described that there is a high correlation between PP and fish abundance and also attempt to obtain a more accurate estimate of the PP required to sustain the world fisheries catches.
Indonesia Sea within Indonesian archipelago is divided into 9 fisheries management areas or WPP (Wilayah Pengelolaan Perikanan). Those WPP's are area 1 is Malacca Strait, area 2 is South China Sea, Area 3 is Java Sea, Area 4 are Flores Sea and Makassar Strait, Area 5 is Banda Sea, Area 6 are Seram Sea and Tomini bay, Area 7 are Sulawesi Sea and Pacific Ocean, Area 8 is Arafuru Sea and finally, Area 9 is Indian Ocean from West Sumatera to South Nusa Tenggara Timur (Ditjen Perikanan Tangkap, 2001).
This research focused on how is the variability of environment parameters (SST and Chlorophyll-a concentration) around Indonesia archipelago derived from satellite data and how is the estimation of primary production and fishery production around Indonesia archipelago. The aim of this research are to estimate the variability of environment parameter (SST and Chl-a concentration) around Indonesia archipelago derived from satellite and to estimate of primary production and fishery production around Indonesia Archipelago.
METHODOLOFY OF RESEARCH
The research area was around Indonesia archipelago divided in to 9 fisheries management areas at 8°N to -14°S and 91°E to 141°E. The research boundary location has coverage in the Exclusive Economic Zone (EEZ) of Indonesia (Figure 1).
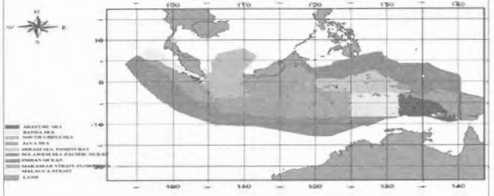
Figurel Research Area in 9 fisheries management areas of Indonesia
(Bakosurtanal , 2006)
This research used two satellite data, MODIS (Chl-a and SST) and SeaWiFS (PAR). The Vertically Generalized Production Model (VGPM) proposed by Behrenfeld and Falkowsky (1997) employed to derive PP. Firstly, the calculating process start to process Chl-a and SST data from MODIS satellite and surface PAR data from Sea WiFS satellite. These process were produced data of Chl-a, SST and PAR. The all parameters was employed the VGPM. The FP model (Pauly and Christensen, 1995) was calculated to obtain the FP. The results of Estimation of FP from model
compared to FP data from Ministry of Marine and Fisheries.
The core equation of VGPM:
B Eo
PP,u = 0.66125.xP0pt E + 4_1 CsA'i"' Z,ux DIRR .... (l) where : 0
PP... : Daily carbon fixation integrated from the surface to Z.,., (mg C/m2)
pBOpt : Opt rate of daily carbon fixation within water column [mgC(mg Chl}-1 h-1]. pB can be modeled according to various temperature-dQptependent relationships.
E0 : Sea surface daily PAR (mo! quanta/m2/d)
CSAT : Satellite surface chlorophyll concentration as derived from measurements of water leaving radiance (mg Chlfm3). VGPM calculations of global primary production were based on monthly average CSAT
Z... : Physical depth (m) of the euphotic zone defined as the penetration depth of 1% surface irradiance based on the Beer-Lambert law. z... is calculated from CSAT following Morel and Berthon (1989).
The equation of Fish Production by Pauly and Christensen (1995)
FP = PP x (ET)(TL - 1) ......................................................... (2)
Where:
FP : Fish Production (mg C/m2)
PP : Primary Production (mg C/m2)
Er : Efficiency Transfer (10%)
TL : Trophic Level
Pauly and Christensen (1995) described the oonversion from carbon to wet weight is using the conservative 9 : 1 ratio thus the equation for approximate the fish biomass become :
FB = FP x 9 ...................................................... (3)
Where:
FB : Fish Biomass (tons)
FP : Fish Production ((mg C/m2)
RESULTS AND DISCUSSIONS
Chlorophyll-a and SST Distributions
The variability of Chl-a and SST in all regions around Indonesia Archipelago were shown in figures 2 and 3
Ollorophyll-a

i' ;I
g:g
^0 g
000

Figure 2 Variability of Chi-a in All Regions (9 fisheries management areas) from 2004 to 2006
■ ∕λ∖.^.∖^-----------∕ T.............-
j⅞⅜⅛¾^¾
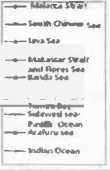
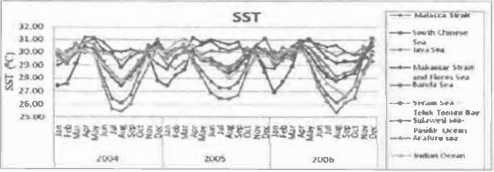
Figure 3 Variability of SST at All Regions (9 fisheries management areas) from 2004 to 2006
Mrtilw.. ... CIM.ot.. ,...... ldd,- 8.-Mh• ... ..... ..,.. ... .v.r-- ^-o.r-
..... k• •w_. T,.,.T"-i..!Pa ....a. Oc-<r•
n.nks .,.
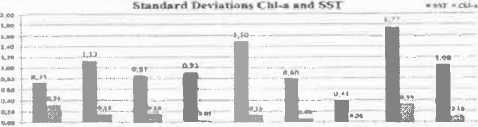
Figure 4 Standard Deviations of SST and Chi-a Variability at All Regions from 2004 to 2006
sea is depend on the geographic and the depth of sea. This variation is caused by different of day length and nutrient concentrate that found in the sea. On the ocean, the concentrations of chl-a distribution is high in seashore and lower in the depth water of the sea. The high Chl-a in seashore is caused by higher nutrient supply from the run-off. Meanwhile, the lower Chl-a in the depth water of the sea is caused by lower supply of nutrient from the land (Valiela, 1984).
Based on the results of Chl-a variability in 9 fishing areas of Indonesia, four regions shown the Chl-a variability was high in August (Southeast monsoon) and become lower in February (Northwest monsoon). Those regions are Serarn Sea and Tomini Bay, Banda Sea, Arafuru Sea and Indian Ocean, which are mostly located at the southern part of the equator line and have a very deep ocean. Meanwhile, Malacca Strait, Java Sea and South China Sea showed the higher chi-a distribution in Northwest monsoon. There are three regions namely Makassar Strait, Sulawesi Sea, and Java Sea show that no significant fluctuation on Chi-a distribution that give the considerably response to the SST pattern. Generally, it seems that the Northwest monsoon looks more fertile areas concentrated in the northwestern part of Indonesia that is around the Malacca Strait, Natuna Sea, Karimata Strait and Java Sea. While on the Southeast monsoon more concentrated in the southeastern of Indonesia (Realino at al., 2006).
The annual mean of highest Chi-a was found at Arafuru Sea in August 2005. Meanwhile, lowest mean chl-a was found at Banda Sea in May 2006. The opposite condition was found in monthly SST. Generally, the highest SST was found in January and the lowest in August. The highest average SST was found at Malacca Strait in April 2004. The lowest average was found at Arafuru Sea in August 2006. According Realino at al. (2006) the Arafura Sea is the most fertile regions when compared with the entire region of Indonesian waters.
The highest variability of chl-a and SST distributions found at Arafuru Sea with standard deviation for Chl-a= 1.77 and for SST=o.36 (figure 4), where the southeast monsoon begins in May blow easterly winds from Australia and veer southwesterly to the north of the equator. This zone blown by maximum wind spread and intensifies until July and August, considerably arise cooler high nutrient, create significant changes of temperature and Chl-a concentration. While the lowest variability of Chi-a value and SST distribution found at Sulawesi Sea and Pacific Ocean with standard deviation for Chi-a = 0-41 and for SST = 0.01 (figure 4), where at this region mainly consists of group of islands that affect ocean currents and wind distribution becomes more stable without significant variations.
Monthly the patterns of SST and Chi-a in Indonesia are influenced by geographical status, monsoon pattern, ENSO and IOD event (Susanto et al., 2006) which they showed that ocean color variability in the Indonesian Seas will also be strongly influenced by the ENSO phenomenon. The variation of Chi-a distribution in
Estimation of Primary Production and Fish Production in 9 Fisheries Management Areas of Indonesia from 2004 to 2006
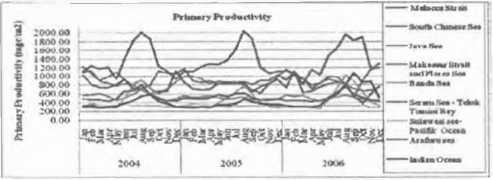
Figure 5 Estimation of Primary Production in all regions from 2004 to 2006
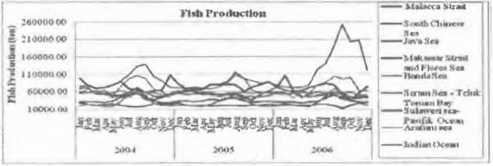
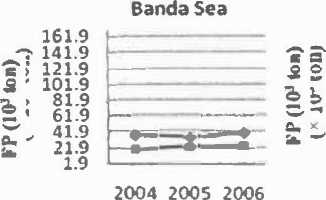
Figure 6 Estimation of Fish Production in all regions from 2004 to 2006
The highest estimation of PP in 9 fishing areas was found at Arafuru Sea on August 2005 with value of 2,036.24 mg C/m2. The lowest PP value was found at Banda Sea in May 2006 with value of 262.70 mg C/m2 (figure 5). Primary Production has a high relationship with Chl-a, this phenomenon is shown by the same condition between PP and Chl-a concentration. This high correlation indicated that the area with highly Chl-a concentration produced higher PP (Macfyden, 1998 in Suniada, 2008).
Primary production could estimate the FP. The highest FP at Indian Ocean in September 2006 was 253,525.08 tons. In the same month, the lower FP was found at Malacca Strait with value of 130, 93.74 tons (Figure 6). The fluctuation of FP estimation is caused by the fluctuation of PP and the fluctuation of PP is caused by the fluctuation of chl-a concentration due to seasonal changing (Suniada, 2008). In this research, FP that derived from satellite data, are influenced by PP, and the large territory area. High fishery in large fisheries area of Indian Ocean is caused by intensively of upwelling in southern Jawa and Bali seashore (Wyrtki, 1962; Gordon et al., 2004). Meanwhile, lower FP is caused by smaller fisheries area and lower chl-a concentration (Suniada, 2008). Based on the total annual FP from satellite, the highest and the lowest values was found at Indian O^an (1,614,135.44 tons)
161.9 ':' 141.9
,i 121.
- 101.^
Q - ^
81.9
61.9
41.9
21.9 l.9
Malaka Strait

,i
.,
2
t
2004 200S 2006
,
South Cblnt>SeSea
161.9 ""i:, l.tl.9
121.9
101.9
81.9
61.9
∙U.9
H.9
1.9
t L
2004 Z00< 20M
Seram Sea and Tomlnl bay
161.9
141.9
111.9
101.9
81.9
61.9
·H.9
21.9
1.9
l\lakasar Strait and
F1ores Sf-a

'- ^^^^^^^^^>^.^^^^^^W1^^ ^^^^^^
Arafuru Sea
Indian Ocean
200-I 200^ 2006
2004 2005 2006
;.,,
a c -
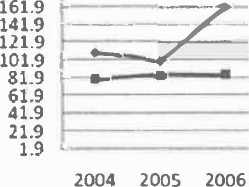
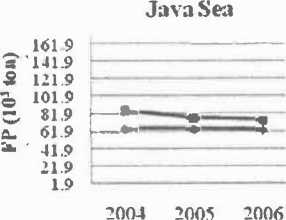
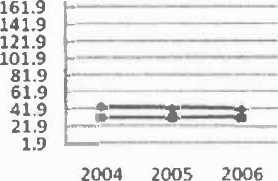
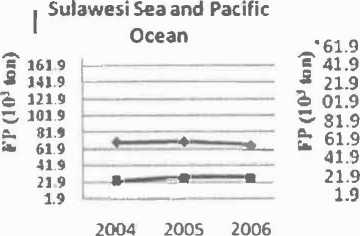
Figure 7. Comparison between Estimation FP from Satellite Data and FP from DKP Data in 9 Fisheries Management Area of Indonesia from 2004 to 2006
and Malacca Strait (268,305.64 tons) due to the large and the smallest tenitory area, respectively. Based on the total annual FP from DKP, the nighest and the lowest values was found at Java Sea (850,151 tons) and Banda Sea (198,078 tons), respectively.
The validation results showed the estimated fish production from satellite data by VGPM were higher than the FP from DKP data at South Chinese Sea, Banda Sea, Seram Sea, Tomini Bay, Sulawesi Sea, Pacific Ocean, Makassar Strait, Flores Sea, Arafuru Sea and Indian Ocean (Figure 7). Almost all of those areas approximately have the utilization rate close to 80% - 100 % which (based on the General Information of Indonesia Marine and Fishery) this indicated that those rate categorized as fully exploited fishing zone. At glance the utilization rate visibility at Arafuru, Sulawesi Sea and Pacific Ocean were below 80% which namely as under fishing zone. Furthermore, the fishing activity needs to be more carefully controlled in order to maintain the sustainability of fish resources at those areas.
The three areas such as Malacca Strait, Java Sea and Makassar Strait showed the lower FP estimation from satellite data rather than that the FP from DKP data. These phenomenons indicated that the fish resources at
those areas has been over exploited. As one of 9 fishery management areas established by the Directorate General of Fisheries, potential sustainable owned approximately 0.24 million tons per year with 135% utilization rate (Boer et al., 2001). The utilization of fish resources in the Malacca Strait has been fully exploited for all groups of species of fish resources, except for the large pelagic (DKP, 2007). During East season at Banda Sea, there are two periods of phytoplankton bloom, in June and in August/September (Vosjan and Nieuwland, 1987). According to Nontji (1975), the results of chl-a distribution study at Banda Sea conducted in the late phase in September, found that the highest concentration of Chl-a was found in the eastern part of Banda Sea, particularly around the island of Kei and Tanimbar. These waters are one of 9 fishery management areas established by the Directorate General of Fisheries. Potential sustainable owned approximately 0.24 million tons per year with 135% utilization rate (Boer et al., 2001).
The highest correlation of fish production found at Arafuru sea with R = 0.97 (Figure 8) which indicate that the VGPM that apply into these area can estimate the growth of fishing utilization pattern from observation result. Meanwhile, the lowest correlation of fish
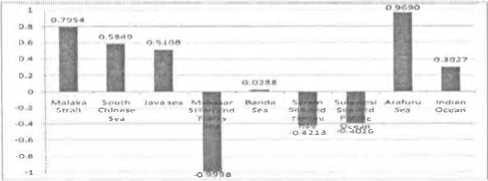
Figure 8. Correlation FP from Satellite Data and FP from DKP Data in 9 Fisheries Management Area of Indonesia from 2004 to 2006
production estimation found at Makassar Strait and Flores Sea with R = - 0,99 (Figure 8). This indicates the parameters the estimate the fish production at this area need to be added to adjust to the physical conditions of the ocean dynamics in the region.
CONCLUSIONS AND SUGGESTIONS
Conclusions
-
1. The variability of SST and Chl-a concentrations around Indonesia archipelago showed the highest Chl-a along with the lowest of SST in southeast monsoon at Seram Sea - Tomini Bay, Banda Sea, Arafuru Sea and Indian Ocean. The highest Chl-a in northwest monsoon found at Malacca Strait, Java Sea and South China Sea. Makassar Strait and Sulawesi Sea showed no significant Chl-a fluctuation in response with monsoon. The highest variability of chl-a and SST distributions found at Arafuru Sea with standard deviation of Chl-a == 1. 77 and SST == 0.36 influenced by monsoon. Otherwise, the lowest variability of Chl-a and SST there were no significant changes in response with monsoon, found at Sulawesi Sea and Pacific Ocean with standard deviation of Chl-a == 0-41 and for SST == 0.01.
-
2. The estimation of primary production showed the highest value at Arafuru Sea in August 2005 with value 2,036.24 mg C/m2 and the lowest value was 262.70 mg C/m2 at Banda Sea in May 2006. The highest fish production is 253,525.08 ton at Indian Ocean in September 2006 and the lowest fish production found at Malacca Strait with value 13,093.74 ton. The validation results showed that South Chinese Sea, Banda Sea, Seram Sea, Tomini Bay, Sulawesi Sea, Pacific Ocean, Makassar Strait, Flores Sea, Arafuru Sea and Indian Ocean categorize as fully exploited fishing zone. The Malacca Strait, Java Sea and Makassar Strait were over exploited.
Suggestions
-
1. The development of appropriate algorithms to calculate the fish production with oceanographic conditions in Indonesian waters
-
2. It need to takes monthly validation such as SST, Chl-a and fish production data of the Indonesian archipelago.
-
3. The government should to give an appeal, tightening fishing regulations, conduct a study and evaluation of efforts to use sustainable marine fisheries resources
in order to avoid over exploitation of fisheries so that the whole area can be preserved by considering the welfare of the community.
-
4. The fisherman whose catches the fish at Arafuru Sea, Seram Sea, Tomini Bay, Banda Sea and Indian Ocean can obtain the higher yield during southeast monsoon period. On the other hand, the fishermen whose catches the fish at Malacca Strait, South China Sea and Java Sea, can obtain the higher yield during northwest monsoon period.
REFERENCES
Bakosurtanal. 2006. Geometri ZEE Indonesia (KMZ). Available at Fahmi@Multiply. Verified (10/11/2007).
Behrenfeld, M.J. and P.G. Falkowsky. 1997. A Consumer's Guide to Phytoplankton Primary Productivity Models. Limnology and Oceanography Journal 42 (7): 1479-1491
Boer, M., K. A. Aziz., J. Widodo, A. Djamali, A. Ghofar dan R. Kurnia. 2001. Potensi, Pemanfaatan dan Peluang Pengembangan Sumberdaya Ikan Laut di Perairan Indonesia. Direktorat Riset dan Eksplorasi Sumber-daya Hayati, Dirjen. Penyerasian Riset dan Eksplorasi Laut, Dept. Kelautan dan Perikanan Komisi Nasional Pengkajian Sumberdaya Perikanan Laut - PKSPL IPB. Bogor. 58p.
Ditjen Perikanan Tangkap. 2001. Peta Indonesia berdasarkan Wilayah Pengelolaan Perikananan. Available at http:// www.pipp.dkp.go.id. Verified (10/09/2007)
DKP. 2006. Pengkajian Stok Ikan Indonesia 2005. Pusat Riset Perikanan Tangkap Departemen Kelautan dan Perikanan.
DKP. 2007. Luas Perairan dan Panjang Garis Pantai Indonesia. Available at http://statistik.dkp.go.id/download/ cd_interaktif/UMUM/Tab-2%20Luas% 2operairan%20 dan%2ogrs%2opantai%2oindonesia.pdf. Verified (22/06/ 2008).
Gordon, A.L., R.D. Susanto and Q. Zheng. 2004. Upwelling within the Indonesia Seas and its relation to ENSO and Monsoon. Columbia University.
Morel and Berthon. 1989. Surface pigments, algal biomass profiles, and potential production of the euphotic layer: Relationships reinvestigated in view of remote-sensing applications. Limnol. Oceanogr. 34: 1545 - 1562.
Pauly, D. and V. Christensen. 1995. Primary Production Required to Sustain Global Fisheries. Nature Vol. 374 255-257.
Realino, B., T.A. Wibawa., D.A. Zahrudin., A.M. Napitu. 2006. Pola Spasial dan Temporal Kesuburan Perairan Permukaan Laut di Indonesia. Balai Riset dan Observasi Kelautan, Badan Riset Kelautan dan Perikanan, Departemen Kelautan dan Perikanan, Negara, Jembrana, Bali, Indonesia.
Suniada, K I. 2008. Primary Production and Fish Production Estimation Derived from Satellite Data in Banda Sea. Postgraduate Program Udayana University.
Susanto, R.D., Moore II, T.S. and Marra, J., 2006, Ocean color variability in the Indonesia Seas during the SeaWiFS era. Geochemistry, Geophysics, and Geosystems, 7: 11-15
Valiela, I. 1984. Marine Ecological Processes. Library of Congress Catalogy in Publication Data, New York, Usa. Dalam Simon Tubalawony 2001. Pengaruh Faktor-faktor Oseanografi terhadap Produktivitas Primer Perairan Indonesia. Makalah Falsafah Sains (Pps 702) Program Pasca Sarjana / S3 Institut Pertanian Bogor.
150
Discussion and feedback