Synthesis and Characteristics of CdS Nanoparticles in Normal (1 g) and Simulated Microgravity (SMG)
on
Buletin Fisika Vol 22 No. 1 February 2021 : 7 – 11
Synthesis and Characteristics of CdS Nanoparticles in Normal (1 g) and Simulated Microgravity (SMG)
P. S. Shinde, L. D. Adhav, R. M. Pise, S. S. Jagtap*
Department of Physics, Haribhai V. Desai College, Pune-411002, MS, India
Email: prachishinde2688@gmail.com, laveena.adhav29@gmail.com, rutujapise1998@gmail.com,
Abstract - In the present investigation, the cadmium sulphide (CdS) nanoparticles are synthesized in the normal gravity i.e. 1 g (called as control) and in simulated microgravity (called as SMG). The SMG was created by using an instrument called Random Positioning Machine (RPM). Cadmium sulfide nanoparticles were synthesized by using standard chemical method under normal gravity (1 g) and simulated microgravity conditions. The synthesized CdS nanoparticles were characterized by Ultraviolet Visible spectroscopy, Fourier Transform Infrared Ray spectroscopy (FTIR), X-ray diffraction (XRD). The UV-visible absorption spectrum of CdS nanoparticle solution showed a distinct absorption peak at 472.19 nm in control and 458.26 nm in SMG. The band gap calculated from the absorption edge for microgravity sample was 2.71 eV and for control sample was 2.63 eV. The crystalline size of CdS nanoparticles synthesised in control and Micro-g was determined by XRD. Obtained results showed smaller the particle size in microgravity sample (10.78 nm) as compared to control sample (13.89 nm).
Keywords: Nanoparticles, microgravity, Cadmium sulphide, chemical method, characterization
The fabrication of nanoparticles with desired sizes and shapes has propelled nanotechnology into most promising and popular fields of scientific research. Development of improved methods for the synthesis of different metal or semiconductor nanoparticles is of high priority for the advancement of material science and technology [1]. The CdS nanoparticles show unique physical, chemical and structural properties from the bulk. Bulk CdS has band gap 2.42 eV at 300 K with absorption maxima at 515 nm [2, 3]. It can attain three types of crystal structures namely wurtzite, zinc blend and high-pressure rock-salt phase. Due to high stability, excellent physical, chemical and structural properties, availability, ease of preparation and handling, CdS nanomaterials can be exploited in various fields of life. Various methods have been employed for the synthesis of CdS nanoparticles, chemically as well biologically.
Microgravity refers to the condition where gravity seems to be very small. Microgravity, sometimes called “zero gravity” is the condition in which objects appear to be weightlessness, can be achieved in space or on Earth by putting an object in the state of free fall. However, recent developments in space science have made it possible to investigate the effect of microgravity on Earth without going into actual space. Microgravity simulation by means of continuous change in orientation of objects relative to the gravity’s vector can generate effects comparable to the effects of true microgravity when the changes are faster than the objects response time to gravity. These orientations can be changed with the help of an instrument called, clinostat. Depending on the direction of rotations, there are three categories of clinostat 1-D, 2-D and 3-D clinostat. The 3D random rotations with the help of Random Positioning Machine (RPM) could provide a better simulation of the weightlessness condition as compared to the classical 2D clinostat [4].
Altered gravity (micro and hyper) techniques were mostly used to understand the role of gravity in functioning of biological systems such as plants [5-8]. However, use of these techniques for understanding the role in material science is very limited. In the present investigation, the CdS nanoparticles were synthesized by using standard chemical method under normal (1 g) and simulated microgravity conditions and the effects were observed on band gap and particle size of synthesized CdS nanoparticles with the help of spectroscopic techniques.
The starting materials used for the synthesis of CdS were Cadmium chloride (CdCl2), thiourea and Sodium sulphide and precitating agent methanol. All the reagents were of analytical purity. Distilled
water was used throughout the experiment which was conducted under air atmosphere. Same materials are used in microgravity process.
Two mM Cadmium Chloride was added in 100 ml distilled water. The solution was stirred with the helped of magnetic stirrer for 10 min. 18 mM Thioglycerol was then added with the help of micropipette and the solution was stirred for another 10 min (drop by drop). 30 mM Sodium Sulphide added with stirred for next 20 min (30 mM Sodium Sulphide + 50 ml distilled water). The precipitate obtained by using precitating agent methanol. 25ml methanol was added drop by drop with the help of burette in the solution for another 20 min as shown in figure 1a. For synthesis the CdS nanoparticles in simulated microgravity (SMG) the same procedure was repeated with all mixture placed in RPM machine for 1 hour as shown in figure 1b.
Both the solutions were kept for overnight at room temperature and centrifuged at 10000 rpm for 10 minutes. The chemical reaction is as follows:
CdCl2 + Na2S CdS + 2NaCl
After synthesis, CdS nanoparticles were characterized with UV-Vis spectroscopy, X-Ray diffraction and FTIR spectroscopy to extract the information such as band gap energy, particle size and molecular changes, if any.
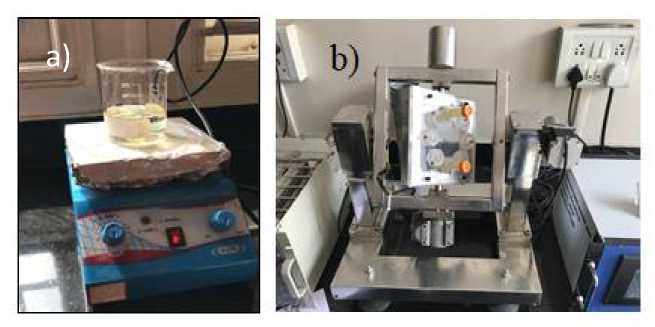
Figure 1. Experimental set up for synthesis of CdS nanoparticles under a) Control and b) SMG.
UV-visible absorption spectrum recorded by U-2000 Hitachi UV-visible spectrophotometer the as-prepared particles. The UV–Visible absorption spectrum of the cadmium sulphide nanoparticles were calculated using following formula,
Where, E is energy, h is Plank’s Constant=6.626 x 10⁻³⁴ m2kg/s, c is velocity of light=3 x 10⁸ m/s, λ is wavelength. The tangent drawn at the absorption edge gives the absorption wavelengths peak at 472.19 nm in control (1 g) and 458.26 nm in microgravity (SMG) samples respectively. The band gap was calculated by using Tauc method. The band gap of control and microgravity samples were 2.76 eV and 2.80 eV respectively.
All prepared samples were characterized by powder X-ray Diffraction (XRD). Data were nanoparticles are as shown in Figure 3. The precipitate has to be obtained by using collected on a SIEMENS D5000 X-ray diffractometer with monochromatic Cu-Kα (λ = 1.5405 A°) radiation filter in the 2θ range 5o - 80o. The average crystalline size of CdS nanoparticles were calculated using Scherrer’s formula, d βcosθ , where, d is the mean size of the ordered (crystalline) size, λ is X-ray wavelength, β is FWHM, and θ is
Bragg angle [9]. The average crystalline size for control sample and microgravity sample are 13.89 nm and 10.78 nm respectively. The recorded XRD patterns are shown in Figure 3.
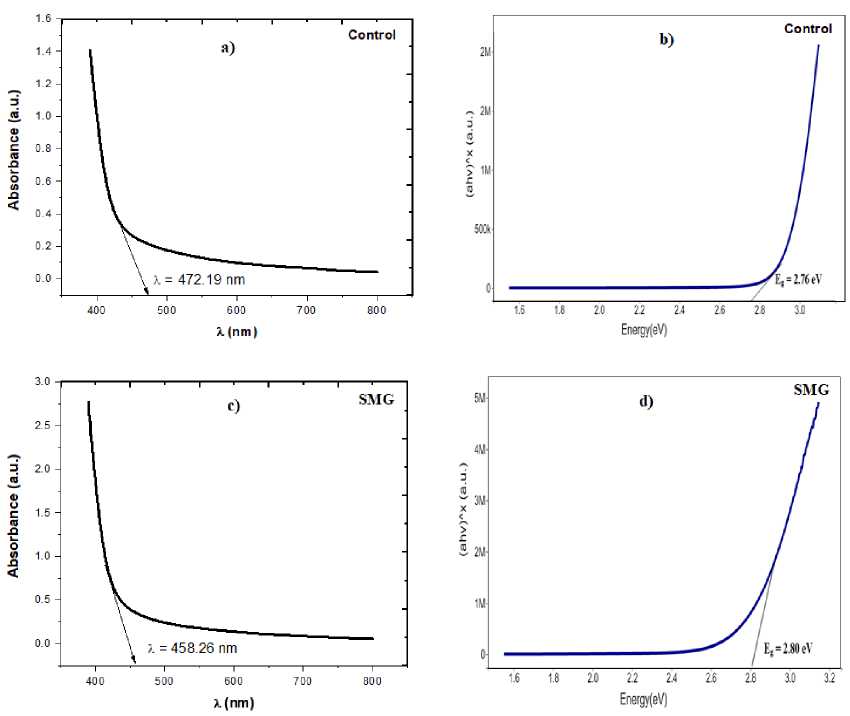
Figure 2. UV-Vis spectroscopic analysis Control and SMG samples. Figure a) and b) shows UV spectra and Tauc plot of control sample and Figure c) and d) shows UV spectra and Tauc plot of SMG sample respectively.
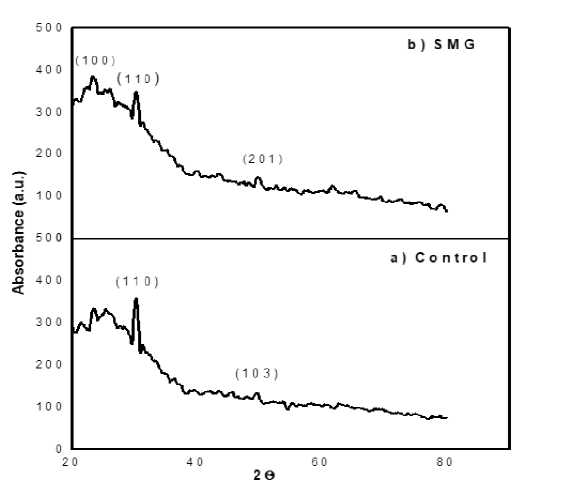
Figure 3. X-ray diffraction analysis of a) control and b) SMG samples.
The FTIR is used to study the purity and composition of the synthesized products. It is used to determine the functional groups and types of bonds present in the system [10]. The FTIR spectra could be explained by various peaks (Figure) obtained by the sample. Table 1 and 2 contains the explanation of the peaks obtained by all the synthesized CdS nanoparticles in control 1g and in simulated microgravity. The spectrum of the CdS in the control gravity and in the simulated microgravity exhibits at 3 strongly absorption peaks at the 602.25, 1024.96, 1634.40, 3297.53 cm-1 in control and 595.08, 1011.63, 1630.30, 3355.74 cm-1 in SMG samples for N-H, C O, C-H (or C-X) stretching frequencies respectively. The strong absorption at 1645 and 3297 (for control), 1630 and 3355 (for simulated microgravity) that correspond to Nitryl (N-H), Carbonyl group (C O) is quite intense. From above data of the CdS nanoparticles in control (1g) and microgravity exhibits the same functional group and almost same stretching in the bonds is observed.
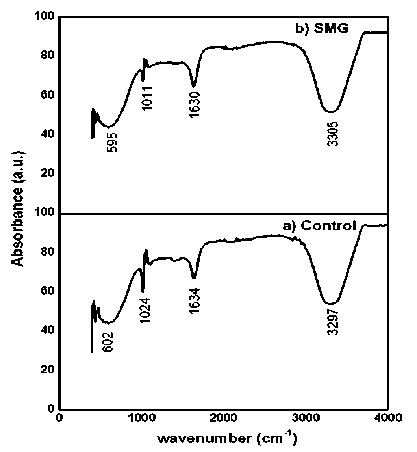
Figure 4. FTIR analysis of a) control and b) SMG samples.
Table 1. Result Table from FTIR Data for control sample.
|
No. Frequency (cm-1) |
Type of Vibrations Frequency Intensity |
|
1 602.25 2 1140.05 3 1645.48 |
Chloride 780-540 Alcohols, ethers 1300-1000 N-H (bend) 1640-1550 Primary and Secondary amines and amides |
|
4 3297.53 |
O-H H-bonded 3400-3200 Carboxylic acids 3400-2400 |
Table 2. Result Table from FTIR Data for SMG sample.
|
No. |
Frequency (cm-1) Type of Vibrations Frequency Intensity |
|
1 2 3 |
595.08 Chloride 780-540 1011.63 Alcohols, ethers 1300-1000 1630.30 N-H (bend) 1640-1550 Primary and Secondary amines and amides |
|
4 |
3355.74 O-H H-bonded 3400-3200 Carboxylic acids 3400-2400 |
In the present work, CdS nanoparticles were synthesized using a chemical method in control 1 g and in simulated microgravity condition using a random positioning machine. The energy band gap of the microgravity sample was relatively larger than the control sample. The average crystalline size of the microgravity sample was relatively smaller than the control sample. This indicates that gravity plays an important role in the synthesis of CdS nanoparticles. However, the functional groups of both the sample remained unchanged.
Acknowledgement
Authors are thankful to the Principal of Haribhai V. Desai College, Pune and P.G.K. Mandal authorities for providing the facilities available in the institute and also for the financial support.
References
-
[1] I. Capek, Nanotechnology and nanomaterials Nanocomposite Structures and Dispersions Science and Nanotechnology - Fundamental Principles and Colloidal Particles, vol. 23, 2006, chapter 1, pp. 1-69.
-
[2] Bhattacharya R. and Saha S., Growth of CdS Nanoparticles by Chemical Method and its Characterization, Pramana - Journal of Physics, vol. 71, 2008, pp.187-192.
-
[3] Dumbrava A., Badea C., Prodan G. and Ciupina V., Synthesis and Characterization of Cadmium Sulfide Obtained at Room Temperature. Chalcogenide Letters, vol. 7, 2010, pp. 111-118.
-
[4] Herranz et al., Ground-Based Facilities for Simulation of Microgravity: Organism-Specific Recommendations for Their Use, and Recommended Terminology, Astrobiology, vol. 13(1), 2013.
-
[5] Pandit Vidyasagar, Sagar Jagtap, Amit Nirhali, Santosh Bhaskaran and Vishakha Hase, Effects of hypergravity on the chlorophyll content and growth of root and shoot during development in rice plants, In: J.F. Allen, E. Gantt, J.H. Golbeck & B. Osmond (eds.), Photosynthesis Energy from the Sun: 14th International Congress on Photosynthesis, Springer, 2008, pp. 1597-1600.
-
[6] Sagar S. Jagtap and Pandit B. Vidyasagar, Effects of high gravity (g) values on growth and chlorophyll content in wheat, Int. J. Integ. Biol., vol. 9(3), 2010, pp. 127-129.
-
[7] Sagar S Jagtap, Rupali B Awhad, Santosh B and Pandit B Vidyasagar, Effects of clinorotation on growth and chlorophyll content of rice seeds, Microgravity Sci. Technol., vol. 23, 2011, pp. 41-48.
-
[8] S. S. Jagtap, K. N. Dhumal and Pandit B. Vidyasagar, Effects of Slow Clinorotation on Growth and Yield in Field Grown Rice, Gravitational and Space Biology, vol. 25 (1), 2011, pp. 48-50.
-
[9] R. Aruna Devi et.al, Synthesis and Characterization of Cadmium Sulfide Nanoparticles by Chemical Precipitation Method, Journal of Nanoscience and Nanotechnology, vol. 15, 2015, pp. 8434-8439.
-
[10] Donald L. Pavia, Gary M. Lampman and George S. Kriz, Chapter 2: Infrared Spectroscopy, Introduction to Spectroscopy (5th edition), 2013, pp.14-106.
11
Discussion and feedback