MONITORING OF WATER QUALITY IN THE LAKE MARKEERMEER, THE NETHERLANDS
on
Monitoring of Water Quality in the Lake Markeermeer, The Netherlands
by
Philiphi de Rozari
Department ef Chemistry, Faculty Science and Engineering, Nusa Cendana University Karnpus Penfui UNDANA Jl. Adisucipto Kupang NTT
Correspondingauthor, telp/fax :+623808853461 email: phderozari@yahoo.com
Abstract
Lake Markermeer is a large fresh water lake in the centre of the Netherlands. The actual problem in this lake was its high turbidity. Since Lake Markermeer is categorised as a shallow lake, it is very susceptible for water quality problems. The general objective of this study was to study water quality of Lake Markermeer
Monitoring of water quality was carried out in a 5 months period from November, 2007 until March, 2008. For this research, surface water was firstly sampled at 66 representative sites; parameters measuredwere:pH, EC, temperature, turbidity, DO, Secchi depth, P total, N total, chlorophyll and Silica total. The monitoring was continued every two weeks at two fixed sampling sites referred to as STA and STB with the same previous parameters excluding total. Statistical t-test analysis was utilised to compare the value of each parameter between two sampling stations.
Result of water quality measurement showed that variability of surface water quality in the Lake Markermeer could be explained as follows: for pH, conductivity, temperature and dissolved oxygen (DO) no significant variation was found among sampling sites (coefficient of variation, CV d" 10%). On the other hand, for turbidity, Secchi disk depth, P total, N total, chlorophyll-a and silica total, ranges between minimum and maximum values were signficantly larger (CV > 10%). The result of the turbidity, Secchi disk depth, N total, P total and chlorophyll-a at the two fixed sampling stations were much diverse during the sampling period.
Key words: monitoring, water quality, Lake Markemeer parameters
Lake Markermeer is a large freshwater lake in the centre of the Netherlands. In this lake water quality problems are often related to sediment composition and transport (Van Duin, 1992). With the increase of stress upon Lake Markermeer due to increasing human/urban population, water quality studies for predicting the fate of pollutants and assessment of these pollutants in Lake Markermeer water body have become more important. According to Meybeck et al (1996) water quality is affected by a wide range of natural and human influences. There are three major components for studying water body characterization; these are: hydrodynamics, physico-chemistry, and biology (Meybeck et al, 1996).
The prediction of hydrodynamics (water motion and transport) has long been recognised as the crucial component of any water quality study (Martin and McCutcheon, 1999). As mentioned by Sloff (1997) sediment dynamics, hydrodynamics and morphological processes in reservoirs are very complex and irregular, and many phenomena are poorly understood and described. The emphasis is mainly upon general physico-chemical parameters due to their ease of measurement (Muniina, 2006).
To increase quantitative knowledge in Lake Markermeer, engineering applications of hydrodynamics is necessary to be applied. This application have becomes the principle paradigm of water quality modelling. However, before any
hydrodynamic prediction can be applied in the Markermeer water body, the real conditions of this water body have to be characterized first, as a prerequisite.
In order to understand the processes ongoing in the aquatic ecosystem of Lake Markermeer, monitoring of water quality in this lake should be conducted to contribute to the valuable information of this lake. This information is very important for management of the lake.
The research was carried out in a 5 months period from November 2007 until March 2008. The fieldwork was conducted in Lake Markermeer and all the experimental and analysis works were carried out in the UNESCO-IHE Delft Laboratory.
Lake Markermeer, a large artificial shallow fresh water lake, is located in the centre of the Netherlands. This lake is separated from the larger IJsselmeer lake by a dike between Enkhuizen and Lelystad (Figurel).
The southern part of the lake is called IJmeer. Until 1976, the Markemeer used to be part of the IJsselmeer which was formed by the realization of the ZuiderZee project. Until 1932, The Zuiderzee had open connection with the Waddenzee, which is connected to Noordzee. Hence, the water was saline.
Development of Lake Markemeer is designed for some purposes such as ecological function, social function, agricultural water supply, recreation, fishery and shipping. This lake is categorized as a large open, shallow (average depth 3.5 m) area with a limited amount of inflow and outflow compared to its volume. The boundaries of the lake comprise mainly of dikes. The surface area and the volume of the lake including the IJmeer and the Gouwzee are 680 km2 and 2.5 billion m3 respectively (van Duin, 1992). The residence time of the water in this lake is estimated at around 1.5 year. Research conducted by van Duin (1992) from April until November in 1987, 1988 and 1989 showed that the means of temperature, Secchi depth and suspended solid contents are 14.8 °C, 45 cm and 45.4 g∕m3 respectively.
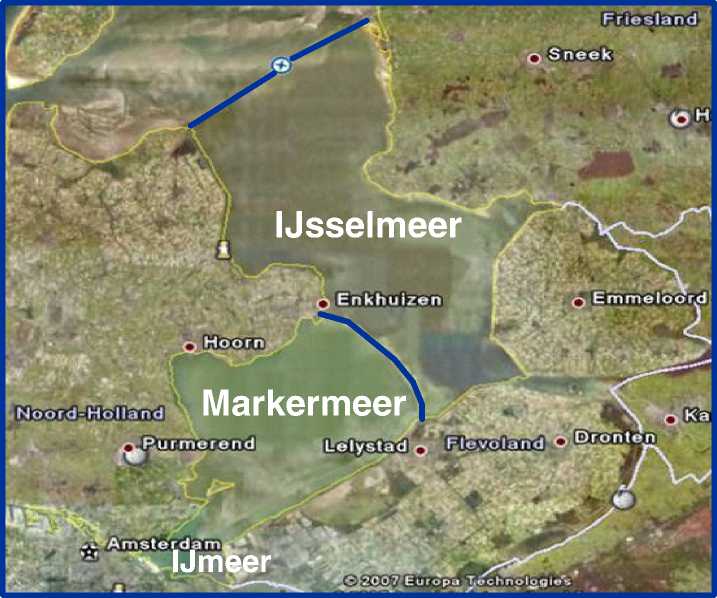
Figure 1. The IJsselmeerArea.
Surface water was firstly sampled in 66 representative sites (figure 2) in order to obtain a whole picture of Lake Markermeer. This campaign was conducted during four days, at the end of November 2007. Secondly, water quality monitoring was carried out regularly every two weeks at two different fixed sites, referred to as STA and STB (figure 3). The STA site is located in the middle of the lake whereas the STB site is situated near the Marken island. This campaign took place from 4 December 2007 until 12 February 2008.
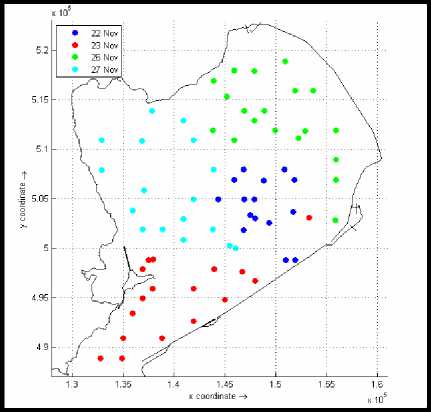
Figure 2. Location of the 66 water quality monitoring stations
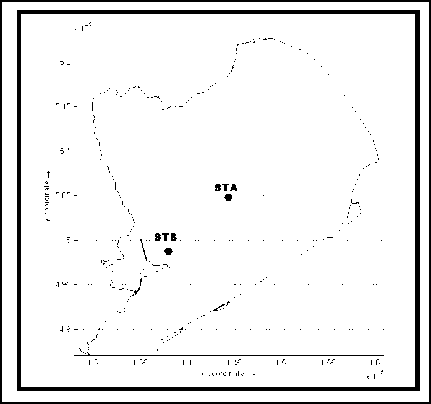
Figure 3. Location of the sediment trap sampling sites
To acquire a whole picture of Lake Markermeer, on site measurements were conducted at 66 sampling sites during 4 days in the period 22-27 November 2007. Water quality parameters measured on site were: dissolved oxygen (DO), temperature, Electrical conductivity (EC), pH, and Sechchi depth. Beside that, these 66 surface water samples were transported in polythene 500 ml bottles , in a cool box, to the UNESCO-IHE laboratory. Here they were stored at 4 0C and were analysed within 24 hours for turbidity. For the last campaign day (27 November 2007), 5 representative samples were selected and transported too and stored in the UNESCO-IHE laboratory, after which they were measured, within one day for chlorophyll-a, whereas Total N and total P were analysed within 3 days, and Total Silica (Si) within 2 weeks.
Water quality measurements were then continued every two weeks in the period 4 December 2007 - 12 February 2008 at the two sampling sites STAand STB (figure 3). The parameters which were measured on site were: pH, temperature, DO, pH, Secchi disk depth and EC. This was followed by measurement in the UNESCO IHE laboratory (turbidity, chlorophyll-a, total N and total P).
A Short description of the procedures for the parameters that were measured in the water samples in the lake is given below:
-
a. Temperature and EC were measured in the field using a WTW 340 portable instrument.
-
b. pH was measured in the field using a WTW pH 340i portable instrument.
-
c. Turbidity was analysed using a DR.Lange Trubung Sphotometer LTP4 turbidimeter in the UNESCO-IHE laboratory
-
d. Sechi depth was measured in the field with a Secchi disc (white; diameter 22 cm).
-
e. DO in the water column of the lake was determined by a WTW 340 Oxy portable instrument.
-
f. Total- P was measured as total P-PO43'. using a standard ascorbic acid spectrophotometric methods according to Kruis (2007), after digestion of the water sample for determination of P (Kruis, 2007). The concentration of sample was determined from light Absorbance
using a Perkin Elmer UV-VIS Lambda 20 spectrophotometer at 880 nm wavelength.
-
g. Total -N was measured as total N-NH4+. These water samples were digested with the macro-Kjeldahl method and analysed, according to LightAbsorbance, using a Perkin ElmerUV-VIS Lambda 20 spectrophotometer at 655 nm wavelength.
-
h. Chlorophyll-a was measured in the UNESCO-IHE laboratory according to a standard chlorophyll-a in algae method (Kruis, 2007). These water samples were extracted with 80 % of ethanol and analysed using a Perkin elmer UV-VIS Lambda 20 spectrophotometer at 750 nm.
-
i. Samples for Total Silica (Si) collected at 5 representatative sampling sites at 27 November 2007 were sent to a TU-Delft Laboratory and determined in that laboratory using ICP-OES (Perkin Elmer Optima 4300DV).
The monitoring of surface water quality in this research consisted of basically two types of measurements, viz. measurement conducted at 66 sampling sites end November 2007 and measurements performed every two weeks in the period 4 December 2007 - 12 February 2008 at the two fixed sampling sites STAand STB.
The aim of measurement in 66 sampling sites is to acquire a whole picture of surface water quality in lake Markermeer. A summary of the results of the in situ and laboratory measurement program is presented in Table 1.
The surface water quality in the lake Markermeer varied among the sampling sites. For pH, conductivity, temperature and dissolved oxygen no significant variation was found among sampling sites (coefficient of variation (CV) d” 10%). Conductivity varied between 751 - 792 IS/cm, pH from 7.8 - 8.1, dissolved oxygen from 11.8 - 12.6 mg/L and temperature from 4.7 - 5.8 0C. Onthe other hand, for turbidity, secchi disk depth, total P, total N, chlorophyll-a and total silica the range between minima and maxima were significantly larger (CV > 10%). According to Scheffer (1998) and Muniina (2006) turbidity and secchi disk depth are easily induced by suspended particle coming from phytoplankton, particulate matter (clays and silts), resuspended bottom sediments and organic detritus. Since Lake Markermeer is grouped as a shallow lake and wind is considered the most important factor promoting sediment resuspension, the big ranges of turbidity and secchi disk depths are probably caused by wind speed (Kelderman, 1984). In this result the variability of total P, total silica and chlorophyll-a concentrations are probably suspected to be caused by these factors as well.
Table 1. Summary of the results of the measurement program in Lake Markermeer.
|
No |
Variable |
Unit |
N |
Mean |
Std Dev |
Min |
Max |
|
1 |
pH |
-log [H+] |
66 |
8.00 |
0.79 |
7.8 |
8.1 |
|
2 |
Conductivity |
μ S/cm |
66 |
765 |
6.59 |
751 |
792 |
|
3 |
Temperature |
oC |
66 |
5.17 |
0.31 |
4.7 |
5.8 |
|
4 |
Turbidity |
FNU |
60 |
44.6 |
24.7 |
11 |
127 |
|
5 |
Dissolved Oxygen |
mg/L |
35 |
12.2 |
0.04 |
11.8 |
12.6 |
|
6 |
Secchi Depth |
cm |
65 |
45.5 |
11.5 |
30 |
85 |
|
7 |
Total P |
mg/L |
5 |
0.040 |
0.021 |
0.025 |
0.081 |
|
8 |
Total N |
mg/L |
5 |
1.00 |
0.011 |
0.87 |
1.15 |
|
9 |
chlorophyll-a |
μg^ |
5 |
50.3 |
13.7 |
33.3 |
70.3 |
|
10 |
Total Silica (Si). |
mg/L |
5 |
0.55 |
0.09 |
0.43 |
0.66 |
-
3.2 Regular measurement at 2 fixed sampling sites (STAandSTB).
The parameters measured every two weeks at the two sampling sites, referred to as STA and STB
during the research period are pH, EC, temperature, Secchi Depth, turbidity, DO, total N , total P and chlorophyll-a. The values for each parameter are presented in the table 2 and figures 4 below (a 1).
Table 2. Result of the measurement program in two fixed sampling sites during the research period (see Table 3.1.)
|
Variables |
Unit |
Station |
Period | |||||
|
I |
II |
III |
IV |
V |
VI | |||
|
pH |
-log [H+] |
STA |
8.3 |
8.3 |
8.3 |
8.4 |
8.4 |
8.4 |
|
STB |
8.3 |
8.3 |
8.4 |
8.5 |
8.4 |
8.4 | ||
|
Conductivity |
μS∕cm |
STA |
758 |
758 |
758 |
778 |
761 |
753 |
|
STB |
760 |
784 |
757 |
755 |
789 |
759 | ||
|
Temperature |
oC |
STA |
5.5 |
2.9 |
2.1 |
5.1 |
6.6 |
5.1 |
|
STB |
5.8 |
2.7 |
2.0 |
5.3 |
6.6 |
5.7 | ||
|
Secchi depth |
cm |
STA |
35 |
40 |
35 |
25 |
45 |
60 |
|
STB |
45 |
40 |
35 |
25 |
25 |
60 | ||
|
Turbidity |
FNU |
STA |
79 |
90 |
83 |
132 |
69 | |
|
STB |
54 |
91 |
95 |
124 |
45 | |||
|
Dissolved |
mg/L |
STA |
12.2 |
13.5 |
14.7 |
12.2 |
12.4 |
13.1 |
|
Oxygen |
STB |
12.6 |
14.0 |
14.9 |
12.8 |
12.3 |
13.5 | |
|
Tot-N |
mg/L |
STA |
0.82 |
1.28 |
0.94 |
1.15 |
0.84 |
0.94 |
|
STB |
0.62 |
0.85 |
1.02 |
0.97 |
0.84 |
0.97 | ||
|
Tot-P |
mg/L |
STA |
0.038 |
0.019 |
0.013 |
0.022 |
0.019 |
0.025 |
|
STB |
0.036 |
0.042 |
0.016 |
0.030 |
0.030 |
0.033 | ||
|
Chlorophyll-a |
μg∕L |
STA |
62.90 |
44.40 |
50.32 |
74.00 |
41.44 |
29.60 |
|
STB |
62.90 |
59.20 |
59.20 |
65.12 |
26.64 |
26.64 | ||
p H
9
8
7
6
5
4
3
2
1
0
ST A
ST B
II IV V V I
P e r i o d
a
C o n d u c t i v i t y
SS TT BA
I IV V V
P e r i o d
b
I
I
V
V I
I IV
p e r i o d

^CW
e
D is s o lv e d O x y g e n ( O 2 )
f
IV V V I
g
T o t -P
h
1
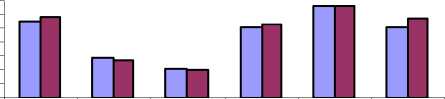
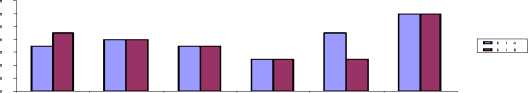
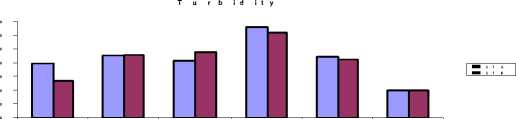
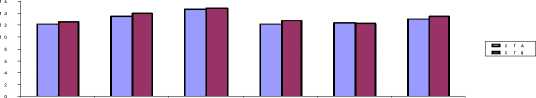
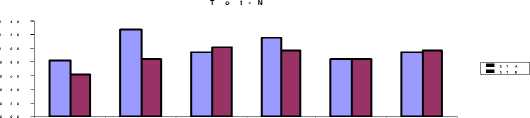
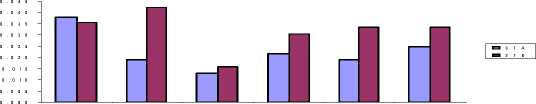
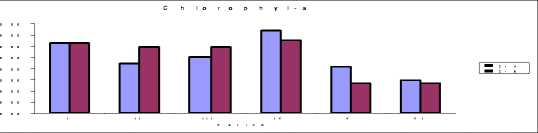
Figures 4. The result of pH (graph a), EC (iS∕cm, graph b); temperature (°C. graph c); Secchl disk depth (cm, graph d); turbidity (FNU, graph e); DO (mg∕L, graph f); tot-N (mg∕L, graph g); tot-P (mg∕L, graph h); and chlorophyll-a (ig∕L, graph i) during the sampling period (see Table 2).
Figures 4 (a and b) show that pH and EC in the surface water at the two fixed stations during the sampling period are generally constant. The value of the pH lies between from 8.3 and 8.4 for STAand from 8.3 to 8.5 for STB while the value of EC varied from 758 to 778 iS/cm in STAand 755 - 789 iS/cm in STB. For DO (figure 4 graph f), there are only slight differences among them during sampling period. The range of DO in STAand STB were: 12.2 -14.7 mg/L and 12.3-14.9 mg/L respectively.
In contrast, the result of the turbidity, secchi depth, total-N, total-P and chlorophyll (figures 4 graph d, e, g, h, i) showed a much larger variation during the sampling period. The variations of these parameters are suspected to be induced by the concentration of suspended particles. As mentioned by Bloesch (1994) and van Duin (1992) the concentration of suspended particles in shallow lakes are strongly influenced by sediment resuspension in which wind is considered the most important factor promoting sediment resuspension of the surface layer sediment through wave action (Li, et al, 2008). In order to understand these phenomena, the wind speed data from a station located in the north east of Lake Markermeer
(coordinate 166608.47, 529010.96) were provided during the sampling period. The graph below (Figure 5) shows the mean wind speed data during the sampling period.
Figure 5 shows that wind speed had large variations during sampling period, with ranges from 2.60 m/s to 12.85 m/s. It can be concluded that in this research, the wind speed can cause resuspension processes in which it is the one of the important factors affecting the variability of turbidity, secchi disk, total-N, total-P and chlorophyll.
Since there are two fixed sampling sites measured during this period, statistics was used to compare the parameter value at STAand STB, using the t-test (Wheater and Cook, 2000) The result shows .
that, for all parameters measured (pH, EC, temperature, Secchi depth, turbidity, DO, tot-N, tot-P and chlorophyll-a) there were no significant differences between STA and STB.
Looking further to the impact of wind speed onto turbidity, secchi disk, total-N, total-P and chlorophyll, a correlation analysis was done (see Table 3).

Wind speed
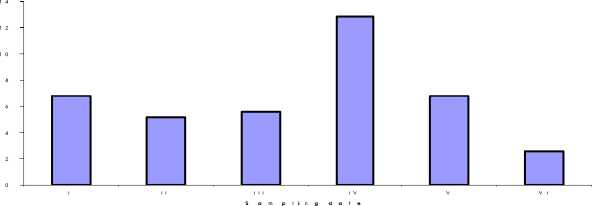
Figure 5. Mean of wind speed during sampling period.
Table 3 Correlation coefficient between wind speed and different water quality parameters.
|
Sechi Depth |
Turbidity |
TP |
TN |
Chlorophyll | |
|
Wind Speed |
-0.786 (+) |
0.734 (+) |
-0.028 (-) |
0.134 (-) |
0.692 (+) |
+ = significant (p< 0.05)
-
- = not significant
n = 12
There were significant correlations found between wind speed and Secchi depth (negative correlation; r = -0.786) and also positives correlations between wind speed and turbidity (r =0.734) as well as chlorophyll-a (r=0.692). On the other hand, no significant relationship was found between wind speed and TP as well as TN. Therefore it can be concluded that in this research the wind speed gives an significant influence to Secchi depth, turbidity and concentration of chlorophyll-a.
Following from the objectives of this research and subsequent results and discussion above, the conclusions of this study are as follows:
-
1) The variability of surface water quality in Lake
Markermeer are explained as follows; for pH, conductivity, temperature and dissolved oxygen no significant variation was found among sampling sites (coefficient of variation (CV) d” 10%). Onthe other hand, for turbidity, secchi disk depth, total P, total N, chlorophyll-a and total silica the range between minima and maxima were significantly larger (CV > 10%).
-
2) The results of the turbidity, Secchi disk depth,
total-N, total-P and chlorophyll-a at the two fixed sampling stations are much larger (a3) during the sampling period. The variations of these parameters are suspected to be induced by the concentration of resuspended particles in which wind is considered as the most important factor promoting resuspension. These explanations are supported by correlation analysis where it was found that there were significant negative correlations (p<0.05) between wind speed and Secchi depth, and also positive correlations between wind speed and turbidity as well as chlorophyll-a. On the other hand, no significant relationship was found between wind speed and total P as well as total N.
Acknowledgements
This research is funded by Lake Markemeer project in which collaboration between UNESCO-IHE Delft and WL ½Delft Hydraulics, The Netherlands. The author would like to thank to Dr. Peter Kelderman (UNESCO-IHE Delft) and M. Kuijper, M.Sc (DELTARES) for guidence the autor during research period and valuable discussion during writing period.
References
Bloescha (a4)J. 1994. “A Riview Methods Used To Measure Sediment Resuspension”. Hydrobiologia, 284, 13-18.
Kelderman, P. 1984. “Sediment-Water Exchange In Lake Grevelingen Under Different Environmental Condition”. Netherlands Journal of Sea Research, 18(3/4), 286-311.
Kruis, F.2007. Environmental Chemistry; Selected Methods For Water QualityAnalysis, Laboratory Manual. LN0168/07/1, UNESCO-IHE, The Netherlands.
Li, E.H, Li, W., Liu, G.H., Yuan, L.Y. 2008. The Effect Cf Different Submerged Macrophyte Species And BiomassOnSedimentResuspensionIn A Shallow Fresh WaterLake,AquaticBotany, 88, 121-126.
Martin, J.L., McCutcheon, S.C.1999 Hydrodynamics and Transport for Water Quality Modeling. GA, Lewish Publisher, Athens.
Meybeck, M., Helmer, R. 1996. An Introduction to Water Quality. In Chapman, D (ed) Water Quality Assessments: A Guide To The Use OfBiota, Sediments And WaterIn The Environmental Monitoring (pp. 1 -21) SponPress, London.
Meybeck, M., Kuusisto, E., Makela, A, Malkki, E.1996. WaterQuality in J. Bartmanand R. Ballance (Ed.) Water Quality Monitoring- A Practical Guide to the Design and Implementation of Freshwater Quality Studies and Monitoring Programmes . E&FN Spon Press, London.
Muniina, K.2006. A Hydrodynamic Characterization of a Reservoir: Case Study Yongdam Reservoir. Unpublished Master Thesis, UNESCO-IHE, Institute for Water Education, Delft (a4).
Scheffer, M.1998. Ecology of Shallow Lakes. London
Sloff, C,J.. 1997 Sedimentation in Reservoirs, PhD thesis, Faculty of Civil Engineering, Delft University of Technology.
Van Duin, E, H, S.1992. Sediment Transport, Light And Algal Gro∙wth In The Markermeer, PhD thesis, Agricultural University Wageningen, Department of Natural Conservation, The Netherlands.
Wheater, C, P., Cook, P, A.2000. Using Statistics to Understand the Environment (pp.67-86) Routledge, London.
19
Discussion and feedback