Study Of Macrozoobentos Diversity In The Secondary Flow Of The Bengawan Solo River
on

Advances in Tropical Biodiversity and
Environmental Sciences
6(1): 22-28, February, 2022
e-ISSN:2622-0628
DOI: 10.24843/ATBES.2022.v06.i01.p05
Available online at: https://ojs.unud.ac.id/index.php/ATBES/article/view/82034
Study Of Macrozoobentos Diversity In The Secondary Flow Of The Bengawan Solo River, Tunjungmekar Village, Kalitengah District, Lamongan Regency
Agung Pamuji Rahayu* and Norma Aprilia Fanni
Lamongan Islamic University
Aquatic Resources Management Program Study, Faculty of Fisheries Lamongan City, Indonesia agungpamuji@unisla.ac.id
Abstract. Macrozoobenthos are invertebrate animals that live on the bottom of the waters which are often used as an estimator of the imbalance in the physical, chemical and biological environment of the waters. Polluted waters will affect the survival of macrozoobenthos organisms because they are easily affected by the presence of physical and chemical pollutants. This study aimed to determine the diversity, abundance of macrozoobenthos as well as diversity index, evenness index, dominance index and density index which can be used as a reference for determining the water quality of the Bengawan Solo River secondary flow in Tunjungmekar Village, Kalitengah District, Lamongan Regency. Researchers found 6 classes of gastropods, 1 class of bivalves, 1 class of crustaceans, 1 class of malacostraca, 1 class of clitella, from 10 types of macrozoobenthos. It was known that the diversity values of stations 1,2,3 and 4 were included in the low category, this was because the value of each station was <1. The evenness value of stations 1,2,3 and 4 was included in the low category because each station was <1. From the results of the dominance analysis, the highest value was at station 1 with a total of 0.59 because there are freshwater snail species that dominate at station 1. The highest value density was at station 1 with a value of (40.49) while the lowest value was at station 4 with a value of (2, 83). The highest density value was at station 1 with a value of (40.49) while the lowest value was at station 4 with a value of (2.83). The result water quality temperatures between 28.5-300C, brightness ranges from 19-21 cm, depth ranges from 0.5 - 2 m, salinity of 0‰, pH from 8.5-8,8 , dissolved oxygen (DO) ranged from 2.2 to 3.3 mg/L, and nitrite ranged from 0.09-0.20 mg/l. The results of water quality measurements were still in good condition for the life of aquatic biota.
Keywords: Bengawan Solo River; Makrozoobenthos; Water quality
-
I. INTRODUCTION
Rivers have a very important role for the community, various activities such as the disposal of industrial and household waste can cause a decrease in the quality of river water, besides the addition of large amounts of waste material from various upstream to downstream that occurs continuously will cause the river to be unable to recover.
Macrozoobenthos are invertebrate animals that live on the bottom of the waters [1]. Therefore, the composition and structure of the macrozoobenthos community that lives in the river is the result of adaptation to changes in water quality that occur in the river. To estimate the imbalance in the physical, chemical and biological environment of the waters, macrozoobenthos can be used. Therefore, polluted waters can affect the survival of
macrozoobenthos organisms because macrozoobenthos are aquatic biota that are easily affected by the presence of contaminants, both physical and chemical pollutants. Changes in the nature of the substrate and the addition of pollution will affect the abundance and diversity of macrozoobenthos, which act as food chains in aquatic ecosystems.
Bengawan Solo is the longest river in Java Island, located between 6.48°–8.07° South Latitude and 110.26– 112.41° East Longitude. This river flows from the south, becomes the natural boundary of Central Java Province, then flows from the east and empties into Ujung Pangkah Gresik, East Java. The Bengawan Solo River passes through 9 districts/municipalities in Central Java and 11 districts/municipalities in East Java [2]. One of the
regencies in East Java that Bengawan Solo passes through is Lamongan. Like other rivers in Indonesia, Bengawan Solo Lamongan water is used for various purposes, such as agriculture; fishery; industry; even domestic activities.
Tunjung Mekar Village, Kalitengah District, Lamongan Regency is an area that is passed by the Bengawan Solo River Secondary Flow, the use of the Bengawan Solo River secondary flow for household needs, agriculture and fisheries. The number of ponds or rice fields in Tunjung Mekar Village directly contributes pollutant materials into the secondary stream. Macrozoobenthos was chosen as research material because macrozoobenthos has an important role in aquatic ecosystems, one of which is the river, namely as an indicator of water pollution.
-
II. RESEARCH METHODS
This research activity was carried out on the Bengawan Solo River Secondary Flow, Tunjung Mekar Village, Kalitengah District, Lamongan Regency, from May 2021 to July 2021. This research was quantitative research which used a descriptive method. The sampling station was determined by purposive sampling. Sampling was carried out at predetermined stations, at each station 5 sampling points were carried out. Station 1 was the entrance to the secondary river, Station 2 was after the Sugihwaras village settlement, Station 3 was taken after the market, Station 4 was taken after the Tunjung Mekar village settlement, precisely on the border between Kalitengah District and Karangbinangun District. To obtain the data needed in this study, macrozoobenthos were taken at each station using the Surber (Makrozoobenthos Sampler) tool. Measurement of water quality was also carried out at the Laboratory of the Faculty of Fisheries, Lamongan Islamic University.
The tools used in this research were as follows: surber (makrozoobenthos sampler) tool; 1 cm scale stick to measure water depth; the meter with an accuracy of 1 cm; plastic tub to accommodate the base substrate; filter device with a mesh width of 0.5 mm; sample bottles for preserving samples; microscope for observing macrozoobenthos organisms; boat for transportation from one station to another; thermometer for measuring water temperature. The materials for research were as follows 70% alcohol to preserve macrozoobenthos organisms. Data analysis carried out are:
-
A. Diversity Index
The diversity of macrozoobenthos species can be calculated using the diversity index according to Shannon [3] with the formula:
H = - ∑ [ni/N] Log [ni/N]
ni = importance value for each species (number of individuals for each species)
N = total importance value (sum of all individuals of each species)
The diversity index H [4] consists of several criteria:
-
1. H > 3.0 → indicates very high diversity
-
2. H 1.6 - 3.0 → indicates high diversity
-
3. H 1.0 - 1.5 → indicates moderate diversity
-
4. H < 1 → indicates low diversity
-
B. Evenness Index
To determine the evenness of the types of macrozoobenthos in a place can be known by using the evenness index and Evenness (e) [3] with the formula:
e = H/log S
S = number of species in the specified zone
H = diversity index
By criteria: evenness is declared high if the value of e = 1
-
C. Dominance Index
To determine community dominance, the dominance index [3] is used with the formula:
C = ∑ [ni/N]2
ni = importance value for each species (number of individuals per species)
N = total importance value (sum of all individuals of each species)
By criteria:
-
1. C < 0.4 = low dominance
-
2. 0.4 < C < 0.6 = moderate dominance
-
3. C > 0.6 = high dominance
-
D. Density Index
Individuals of each type of macrozoobenthos can mathematically be described as follows [5]:
Dmz = ni/A
Dmz = Density of macrozoobenthos (m^2)
Ni = Total number of individuals of the I species
A = the area of the entire sampling area multiplied by the number of replications (m2).
-
E. Substrate Types
Substrates are classified into several factions, and the classification of the substratesis based on the size of the substrate particles and sediment textures. In general, the substrate is classified into three categories i.e. sand, silt, and clay. The sand, silt, and clay substrates have a particle size of 0.05-2 mm, 0.002-0.05 mm, and <0.002, respectively [6]. Type of the substrates can be determined based on the traingle of substrate texture presented in Figure 1.
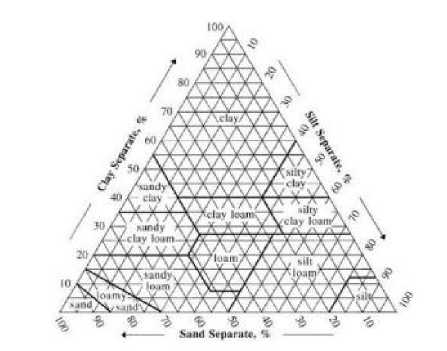
Figure 1. Percentage of substrate types based on the triangle of the substrate texture [6]
-
F. Water Quality Parameter
Water quality parameters measured include physical parameters, namely temperature, brightness, depth. Chemical parameters include dissolved oxygen (DO), pH and nitrite.
-
III. RESULT AND DISCUSSION
Characteristics of Macrozoobenthos in the secondary flow of the Bengawan Solo River, Tunjung Mekar Village.
The results of the study from 4 stations on the secondary flow of the Bengawan Solo River, Tunjung Mekar Village, it was found that there were classes, namely Gastropods, Bivalves, Crustaceans, Malacostraca and Clitella, 10 species from 9 families, which can be seen in Table 1. According to Nortiningsih et.al (2008) in [7] that Diversity, Abundance as well as riches macrozoobenthos at each station is very closely related with environmental factors found in each station. Macrozoobenthos which found in every station study existence stems from adjustment to environmental conditions. Gastropods are more tolerant of changes in various parameters environment, so they are used as indicators of a stressed environment [8]
Diversity, Evenness and Dominance Indexes of Macrozoobenthos
The following are the results of the calculation of the diversity, evenness, and dominance indexes which are presented in Table 2. Based on the table above, it can be said that the diversity index of macrozoobenthos at stations 1, 2, 3, and 4 was included in the category of low diversity, this was because the value of the diversity index at the four stations is <1. Classifies the level of pollution rivers based on the diversity index, namely very lightly polluted, moderately polluted, and heavily polluted with diversity index 3; 1-3 and 1 [9]. By grouping according to this, the water quality of in the secondary flow of the Bengawan
Solo River, Tunjung Mekar Village was based on macrozoobenthos diversity index including into very lightly polluted waters. The higher the index value the diversity of rivers was getting lower also level the pollution. Increasing the number of species and followed by the distribution of the number Individuals that were evenly distributed in each species will cause the index value diversity was high. On the other hand, even though the number of species but if there was one particular species has a very large number of individuals large while the number of individuals of each other species is only small, will cause the diversity index value to be low [10].
Type habitat which liked by macrozoobenthos i.e. substrate base rocky waters, high current speed, temperature (24-26°C) penetration of light to the bottom of the river [7]. While the dominance index can be said that station 1 has moderate dominance because it was between 0.4-0.6, and stations 2, 3, and 4 belong to the dominant category low because it had a value < 0.4.
In Table 3, it can be seen that the macrozoobenthos species that had the highest density of the four stations 1 was Melanoides tuberculata from pylum Molussca with a density of 30.69 ind/m2. Meanwhile, the species with the lowest density was Villosa amygdala which was also included in the Mollusca pylum at station 4 with a density of 2.83 ind/m2.
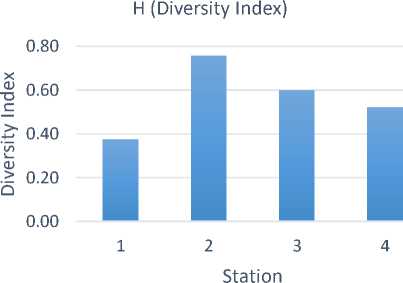
Comparison of Macrozoobenthos Per Station Diversity
Based on the research results, station 1 had an average value of 0.38, station 2 had an average value of 0.76 at station 3 had an average value of 0.60 at station 4 had an average value of 0.52. the lowest value was at station 1 which amounted to 0.38 due to the discovery value of macrozoobenthos species with a total of 7 species out of 10 species. While station 2 the average value is 0.76 with the discovery of 9 species of macrozoobenthos species from 10 species and station 3 the average value is 0.60 because at the time of the study found 9 species of macrozoobenthos species from 10 species and station 4 the average value was get during the study 0.52 researchers
found macrozoobenthos species as many as 7 species out of 10 species. The results of the study the highest value is at station 2 and the lowest value is at station 1.
Evenness
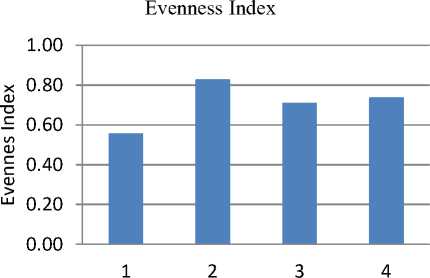
Evenness index at station 1 was 0.56, station 2 (0.83), station 3 (0.71), station 4 (0.74. At stations 2,3 and 4 the evenness index is higher because station 2,3 and 4 this is because at stations 2,3 and 4 are in a very natural ecosystem compared to station 1 because at stations 2,3 and 4 there are already human activities such as aquaculture and agriculture so that freshwater snails in all stations in find the freshwater snail mekrozobenthos.
Aquatic ecosystems that have not experienced changes in environmental conditions will show an even number of individuals in almost all existing species [11]. On the other hand, aquatic ecosystems that have experienced changes in environmental conditions have an uneven distribution of the number of individuals because there are species that dominate.
Station
Dominance
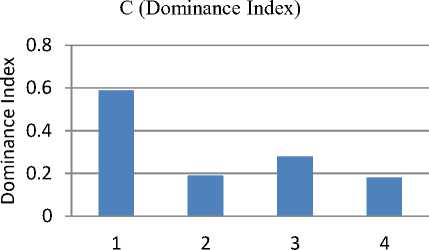
The dominance index at station 1 was 0.59, station 2 (0.19), station 3 (0.28), station 4 (0.18). At station 1, the dominance index has the highest value because more individuals get compared to stations 2, 3, and 4. On the other hand, stations 2, 3, and 4 are smaller because the value obtained was smaller.
The dominant ones at station 1 were freshwater snails because at stations 2 and 3 the river water flows to station 1 so that freshwater snails follow the water flow to station 1 caused during the rainy season so that the water flow was opposite and also the remnants of materials organic matter from station 3 in the market area also follows the flow of water to station 1.
The dominance index ranges from 0 to 1, where the smaller the value of the dominance index indicated that there was no dominant species, on the other hand, the
greater the dominance, it indicated that there was a certain species [3].
Station
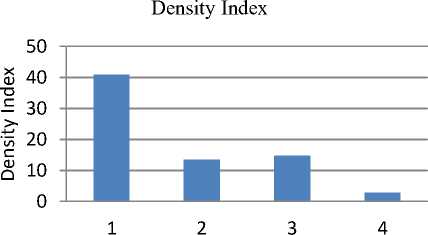
Density
From the results of the study for 4 weeks, the density level at station 1 produced (40.94) individuals, station 2 produced (13.56) individuals, station 3 produced (14.70) individuals, station 4 produced (2.83) individuals, the highest value of the density index was at station 1 because at station 1 there is a lot of organic matter from the remnants of the market area from stations 2 and 3, while the lowest value is at station 4 because at station 4 there is little organic matter left compared to station 1 because water flows to station 1. To determine the density of macrozoobenthos at the study site, the data analysis used was the Shannon-Wienner index proposed [12].
Station
Substrate Types
The results of observations of the substrate in the secondary flow of the Bengawan Solo river from the four stations taken are included in the silt type
Measurement of Water Quality Parameters
The results of the temperature research at all water intake stations in the secondary flow of the Bengawan Solo River, the results obtained temperatures between 28.5-300C. The average temperature value of the four stations
got the highest value at the first location of 300C. While the lowest value was in the fourth location of 28.50C. This was presumably because the river was different.
Temperature is a parameter that must be considered in the fish cultivation process. In general, the growth rate of fish will increase if it is in line with the increase in temperature to a certain extent. If the temperature rise exceeds the limit, it can cause the metabolic activity of aquatic organisms/aquatic animals to increase, this can cause a decrease in dissolved gases in the water that are essential for the life of fish or other aquatic animals.
The brightness measurement showed that the brightness of the water in the Bengawan Solo River secondary flow ranges from 19-21 cm. The highest average value of brightness was at the third and fourth stations of 27.9 cm and the lowest average value was at the first station of 19 cm. The results of depth measurements showed that the secondary flow of the Bengawan Solo River ranges from 0.5-2 m. The highest average value was at the fourth station, which was 2 m and the lowest average value was at the first station, which was 0.5 m. Water depth plays an important role in the life of biota in the ecosystem [13]. The secondary river flow in Tunjung Mekar Village was a freshwater group with all research results showing a salinity of 0‰. Salinity affects the life of aquatic organisms [14]. The average pH measurement results obtained at the first station was 8.8 for the second station of 8.6, the third station was 8.5 while at the fourth location, it was 8.6.
The results of the overall value of dissolved oxygen (DO) ranged from 2.2 to 3.3 mg/L. In the first week to the second week, the highest average DO value was at the first and second stations with a value of 3 mg/l and the lowest was at the third station with a value of 2.5 mg/L. Dissolved oxygen concentration is too low will result in biota that need oxygen will die [15]. The results showed that the concentration of nitrite in the secondary flow of the Bengawan Solo River in Tunjung Mekar Village ranged from 0.09-0.20 mg/l.
-
IV. CONCLUSION
In the secondary flow of the Bengawan Solo River in Tunjung Mekar Village, Kalitengah Subdistrict, Lamongan Regency, researchers found 6 classes of gastropods, 1 class of bivalves, 1 class of crustaceans, 1 class of malacostraca, 1 class of clitella, from 10 types of macrozoobenthos. Gastropods were more tolerant of changes in various parameters environment, so they are used as indicators of a stressed environment. It was known that the diversity values of stations 1,2,3 and 4 are included in the low category, this was because the value of each station was <1. The evenness value of stations 1,2,3 and 4 was included in the low category because each station is
<1. analysis of the dominance of the highest value is at station 1 with a total of 0.59 because there are freshwater snail species that dominate at station 1. The highest density value was at station 1 with a value of (40.49) while the lowest value was at station 4 with a value of (2.83). The result water quality temperatures between 28.5-300C, brightness ranged from 19-21 cm, depth ranged from 0.5 -2 m, salinity of 0‰, pH from 8.5-8,8 , dissolved oxygen (DO) ranged from 2.2 to 3.3 mg/L, nitrite ranged from 0.09-0.20 mg/l. In general, the results of water quality measurements were still in good condition for the life of aquatic biota
ACKNOWLEDGMENT
This research was carried out with the funding assistance from LITBANG PEMAS Lamongan Islamic University through the scheme Hibah Internal.
REFERENCES
-
[1] Izmiarti. 2010. Komunikasi Makrozoobentos di Banda Bakali Kota Padang. Biospestrum 6(1): 34-40
-
[2] Fithrina, M. 2009. Keadaan Fisik Daerah Aliran Sungai Bengawan Solo.
-
[3] Odum, E. P. 1993. Dasar-dasar Ekologi. Edisi Ketiga. Yogyakarta: Universitas Gajah Mada Press.
-
[4] Hardjosuwarno, S. 1990. Ekologi Tumbuhan Jilid 2. Yogyakarta: Fakultas Biologi Universitas Gajah Mada.
-
[5] Brower, J., J. Zar, C.V. Ende, and K. Kane, 1990. Field and laboratory methods for general ecology. Edisi ke-3. America: Wm. C. Brown Publishers.
-
[6] USDA, 2012. National Agriculture Statistic Service [7] Nangin, S.R., M.L. Langoya and D.Y. Katilia. 2015.
Makrozoobentos Sebagai Indikator Biologi Dalam Menentukan Kualitas Air Sungai Suhuyon Sulawesi Utara, Jurnal Mipa Unsrat Online 4(2): 165-168.
-
[8] Barnes. 1999 dalam Iswanti, S. 2012. Distribusi dan Keanekaragaman Jenis Makrozoobentos di Sungai Damar Desa Weleri Kendal. Unnes Journal of Life Science (1)2: 90
-
[9] Harahap, A. 2019. Peranan Makrozoobentos Sebagai Bioindikator Kualitas Air Di Sungai Bilah Labuhan Batu [Disertasi]. Medan: Program Pascasarjana Fakultas Matematika Dan Ilmu Pengetahuan Alam Universitas Sumatera Utara.
-
[10] Wilhm, J.F. 1975. Biological Indicator of Pollution. London: Blackwell Scientific Publications.
-
[11] Purnama, P.R., N.W.M.E. Agustin dan M. Affandi. 2011. Diversitas Gastropoda di Sungai Sukamade, Taman Nasional Meru Betiri, Jawa Timur. Surabaya: Universitas Airlangga.
-
[12] Soegianto, A. 1994. Ekologi Kuantitatif. Metode Analisis Populasi dan Komunitas. Surabaya: Penerbit Usaha Nasional.
-
[13] Hanif, 2011. Kajian Zat Hara Fosfat, Nitrit, Nitrat dan Silikat di Perairan Kepulauan Matasiri, Kalimantan Selatan. Ilmu Kelautan: Indonesian Journal of Marine Sciences, 16(3): 135-142
-
[14] Damayanti. 2019. Analisis Pelaksanaan Praktikum Kimia. Jurnal Pendidikan Kimia Undiksha 3(2).
Yasir, A.A. 2017. Struktur Komunitas Makrozoobenthos pada Lokasi dengan Aktivitas Berbeda di Perairan Sungai Tallo Kota Makassar [Skripsi), Makassar: Universitas Hasanuddin.
TABLE 1.
DIVERSITY OF MACROZOOBENTHOS IN THE SECONDARY FLOW OF THE BENGAWAN SOLO RIVER, TUNJUNG MEKAR VILLAGE
|
No |
Class |
Species |
Station | |||
|
1 |
2 |
3 |
4 | |||
|
1 |
Haitia SPP |
+ |
+ |
+ |
+ | |
|
2 |
Littoridinops monoroensis |
+ |
+ |
+ |
+ | |
|
3 |
Aphaostracon Pachynotus |
+ |
+ |
+ |
+ | |
|
4 |
Gastropoda |
Pomacea paludos |
- |
+ |
+ |
+ |
|
5 |
Molanoides toberculata |
+ |
+ |
+ |
+ | |
|
6 |
Pseudosuccindae |
+ |
+ |
+ |
- | |
|
7 |
Bivalvia |
Villosaamygdala |
- |
+ |
- |
- |
|
8 |
Crustacean |
Palaemonetes poludosus |
+ |
+ |
+ |
+ |
|
9 |
Malacostraca |
Parathelphusa convexa |
- |
- |
+ |
+ |
|
10 |
Clitella |
Tubifex sp |
+ |
+ |
+ |
- |
Description: + (yes), (there is not any)
TABLE 2.
VALUE OF DIVERSITY, EVENNESS, AND DOMINANCE INDEX
Number of Individuals at
Species Station Amount
|
1 |
2 |
3 |
4 | ||
|
Haitia spp. |
97 |
22 |
3 |
1 |
123 |
|
Littoriginops monoroensis |
18 |
60 |
50 |
17 |
145 |
|
Aphaostracon pachynotus |
17 |
39 |
58 |
13 |
127 |
|
Pomacea paludosa |
0 |
9 |
23 |
22 |
54 |
|
Melanoides tuberculata |
491 |
56 |
138 |
11 |
696 |
|
Pseudosuccinae columella |
9 |
7 |
1 |
0 |
17 |
|
Villosa amygdala |
0 |
4 |
0 |
0 |
4 |
|
Palaemonetes paludosus |
1 |
5 |
16 |
17 |
39 |
|
Parathelphusa convexa |
0 |
0 |
3 |
4 |
7 |
|
Tubifex sp. |
22 |
15 |
2 |
0 |
39 |
|
655 |
217 |
295 |
85 |
1251 | |
|
H (Diversity Indexes) |
0,38 |
0,76 |
0,60 |
0,52 |
2,25 |
|
e (Indeks Kemerataan) |
0,56 |
0,83 |
0,71 |
0,74 |
2,83 |
|
C (Indeks Dominansi) |
0,59 |
0,19 |
0,28 |
0,18 |
1,24 |
|
TABLE 3. DENSITY INDEX VALUE | |||
|
Species |
St 1 St 2 |
St 3 |
St 4 |
|
ni/A ni/A |
ni/A |
ni/A | |
|
Pylum molusca | ||||
|
Haitia spp. |
6,06 |
1,38 |
0,15 |
0,03 |
|
Littoriginops monoroensis |
1,13 |
3,75 |
2,50 |
0,57 |
|
Aphaostracon pachynotus |
1,06 |
2,44 |
2,90 |
0,43 |
|
Pomacea paludosa |
0 |
0,56 |
1,15 |
0,73 |
|
Melanoides tuberculata |
30,69 |
3,50 |
6,90 |
0,37 |
|
Pseudosuccinae columella |
0,56 |
0,44 |
0,05 |
0 |
|
Villosa amygdala |
0 |
0,25 |
0 |
0 |
Pylum Arthropoda
|
Palaemonetes paludosus |
0,06 |
0,31 |
0,80 |
0,57 |
|
Parathelphusa convexa |
0 |
0 |
0,15 |
0,13 |
Pylum Annelida
|
Tubifex sp. |
1,38 |
0,94 |
0,10 |
0 |
|
∑ |
40,94 |
13,56 |
14,70 |
2,83 |
Discussion and feedback