The Structure of Macrozoobenthos Community as a Bioindicator of Water Quality in Gilimanuk Bay, Jembrana Regency, Bali
on
Advances in Tropical Biodiversity and Environmental Sciences 5(2): 57-63, August 2021 e-ISSN:2622-0628
DOI: 10.24843/ATBES.v05.i02.p04 Available online at: https://ojs.unud.ac.id/index.php/ATBES/article/view/70759
57
The Structure of Macrozoobenthos Community as a Bioindicator of Water Quality in Gilimanuk Bay, Jembrana Regency, Bali
Yohana Christanti Ndale1*, I Wayan Restu1, Ni Putu Putri Wijayanti1
1Department of Aquatic Resources Management, Faculty of Marine and Fisheries, Udayana University Jl. Kampus Unud Bukit Jimbaran, Kuta Selatan, Badung, Bali
*Corresponding author: yohanachristanti98@gmail.com
Abstract. Gilimanuk Bay is a water area located in Melaya District, Jembrana Regency, West Bali Region. In this area, there are development and human activities that have an impact on the quality of the waters so that they interfere with the life of organisms such as macrozoobenthos. Macrozoobenthos can be the bioindicator that determining the condition in a water area. The decline of the macrozoobenthos community structure is an indicator of a disturbance in the ecosystem in these waters. The purpose of this research to know how community structure of macrozoobenthos and the condition of the water quality in Gilimanuk Bay. This research was conducted in June to July 2020. The research used the quantitative descriptive method, with 3 of the research stations. Based on the result of the research, it has found 45 species of macrozoobenthos that included from 5 classes, there are Gastropods, Bivalves, Crustaceans, Polychaeta and, Sipunculidea. The highest total abundance was at station 3, namely 534.33 ind/m2, station 1 is 522.00 ind/m2 and the lowest abundance is at station 2, namely 371.33 ind/m2. The diversity index obtained was classified as moderate, which ranges from 1.53-1.89, the uniformity index is classified as moderate, which ranges from 0.47-0.57, while the dominance index is low to moderate, which ranges from 0.29-0.44. Based on the macrozoobenthos community structure and the interrelation with water quality, Gilimanuk Bay is classified as moderately polluted waters.
Keywords: Community structure; Gilimanuk Bay; Makrozoobenthos
-
I. INTRODUCTION
Gilimanuk Bay is a water area located in Melaya District, Jembrana Regency, West Bali Region. This area is located adjacent to Gilimanuk Port and is one of the well-developed tourist objects so that there are many developments to support existing tourism. The rapid progress of development and supported by increasing human activity in various sectors of life will have an impact on the quality and quantity of the aquatic ecosystem in the region. This also affects the quality of the waters, so that one day it can exceed the balance of seawater and in particular can disrupt the development of organisms in these waters. The existence of these organisms can be a bioindicator in determining the condition of waters. Bioindicators are groups or communities of organisms whose existence or behavior in nature is related to environmental conditions, if there is a change in water quality it will affect the existence and behavior of these organisms. One of the biotas that can be used as a bioindicator in determining the condition of waters is macrozoobenthos [1].
Macrozoobenthos are aquatic organisms that live on the bottom of waters that are relatively passive or have low
mobility so that they can to respond to water quality conditions continuously [2]. The presence of benthic groups that live permanently, do not easily or quickly migrate, and have varying adaptability to environmental conditions, making macrozoobenthos often used as bioindicators for water quality assessment. Macrozoobenthos is very sensitive to changes in the quality of the water in which it lives so that it will affect the structure of its community. The decline of the macrozoobenthic community structure is usually an indicator of a disturbance in the ecosystem in these waters [3].
The structure of the macrozoobenthos community found in waters needs to be known so that the condition of the water quality in the area can also be known. Therefore, it is necessary to research the structure of the macrozoobenthos community as a bioindicator of the quality of the aquatic environment in Gilimanuk Bay, Jembrana Regency, Bali.
-
II. METHODS
This research was conducted in Gilimanuk Bay, Jembrana Regency, Bali in June-July 2020 with sampling carried out 3 times, once every 2 weeks. The method used
in this research is the descriptive method with a quantitative approach. Determination of the research station using a purposive sampling method. While the sampling method used is the random sampling method.
Research Procedure
-
a. Determination of Point Location
The research location is divided into 3 stations. Each station is ± 200 m apart and consists of 3 sampling points. The distance between the points is 10 m towards the sea. The total sample taken at all stations is 9 sample points. The station design and research points are in Figure 1.
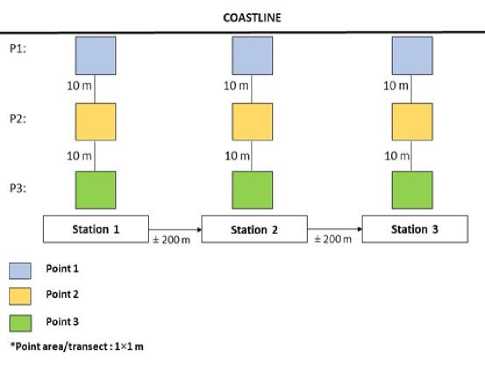
Figure 1. Station Design and Research Points
-
b. Macrozoobenthos Sampling
Samples were taken using a transect measuring 1 × 1 m and a shovel. Transects are used to determine the sampling area and then shovel them with a depth of ± 20 cm. The sample was then filtered with a 1 × 1 mm sieve to separate the macrozoobenthos from the substrate. The obtained macrozoobenthos was put into the jar according to the respective point of extraction and given 70% alcohol as a preservative then attached with label paper as a marker of the point of taking the macrozoobenthos. After that, the sample was put into a cool box to be further identified at the Fisheries Laboratory of Udayana University.
-
c. Sampling and Measurement of Water Quality
Sampling and measurement of water samples are carried out at each point every 2 weeks. Water quality measurements such as temperature, pH, salinity, turbidity, and DO were carried out directly in Gilimanuk Bay while BOD measurements were carried out at Bali Provincial Health Laboratory Center.
Data Analysis
-
a. Abudance of Macrozoobenthos
Abundance of macrozoobenthos was calculated using the formula according to Brower et al [4], namely:
ni
Di= A
Noted: Di is the species abundance (ind/m2); ni is the
number of individuals of type i; and A is the area of the sampling plot (m).
-
b. Diversity of Macrozoobenthos
Diversity index (H') describes the diversity, productivity, stress on the ecosystem, and the stability of the coastal ecosystem to be studied. According to Fachrul [5], the Shannon-Wiener diversity index is formulated by: H' = -∑ Pi in Pi
Noted: H' is the diversity index; Pi is ni/N; Ni is the number of the ith species; N is the total number of all species.
TABLE I
DIVERSITY INDEX CRITERIA
|
Criteria |
Description |
|
H '< 1 |
Low diversity |
|
1< H' < 3 |
Moderate diversity |
|
H' > 3 |
High diversity |
-
c. Uniformity of Macrozoobenthos acrozoobenthos
Uniformity is the individual composition of each species found in a community. The formula for the uniformity index according to Fachrul [5] is:
H' H'
E= =
H max ln S
Noted: E is the uniformity index; H' is the diversity index; S is the number of species.
TABLE II UNIFORMITY INDEX CRITERIA
|
Criteria |
Description |
|
E < 0.4 |
Low uniformity |
|
0.4 < E < 0.6 |
Moderate uniformity |
|
E > 0.6 |
High uniformity |
-
d. Dominance of Macrozoobenthos
The dominance index for macrozoobenthos is used to determine the dominant macrozoobenthos in an area, calculated using the Simpson formula according to Fachrul [5], namely:
∙ 2
→Pi2 = □
i=ι
Noted: D is the dominance index; Ni is the value of each species (number of individual species it-i); N is the total value of all species; Pi is the ratio of the number of individuals of type i to the total number of individuals found.
TABLE III
DOMINANCE INDEX CRITERIA
|
Criteria |
Description |
|
0 < C < 0.3 |
Low dominance |
|
0.3 ≤ < 0.6 |
Moderate dominance |
|
0.6 < C ≤ 1 |
High dominance |
-
III. RESULTS AND DISCUSSION
Abudance of Macrozoobenthos
Based on observations of macrozoobenthos in the waters of Gilimanuk Bay, there were found 45 macrozoobenthos species with a station species distribution of 26-28 species. The macrozoobenthos consists of 5 classes, namely the Gastropods, Bivalves, Crustacean, Polychaeta, and Sipunculidea classes. The results of macrozoobenthos abundance can be seen in Table IV.
Abundance at station 1 obtained a value of 534.33 ind/m2. The high abundance value at station 1 is due to the dominance of the species Terebralia sulcata. The number of species is supported by the type of substrate, namely muddy sand, the condition of the substrate that is not flooded, and the presence of mangrove solids as a source of food. This is supported by the statement of Noersativa et al [6] that Terebralia sulcata is found in many colonies in places that have mangrove substrates that are not inundated by tidal water. The high and low abundance value at station 1 is influenced by fishing pressure such as collecting shellfish by the community in Gilimanuk Bay which results in the number of species, especially those of the Bivalves class, found to be less than other stations. Meisaroh et al [7] stated that human activities such as taking marine biota can affect the high and low abundance of macrozoobenthos in the waters.
Station 2 is an area located at a stopover for small fishing boats and tourist boats and there are other human activities such as trading and recreation. The abundance at station 2 is the lowest value, which is 371.33 ind /m2. This is influenced by several factors such as the presence of competition or predators, as well as unfavorable aquatic environmental conditions due to anthropogenic activities that produce waste. According to Syury et al [8], anthropogenic activities in the vicinity of the area will cause environmental pressure so that it affects the number of species and the density of certain macrozoobenthos. Silaen et al [9] also stated that the abundance of macrozoobenthos can be influenced by local environmental factors such as water quality and the presence of pollutants such as garbage, food availability, predation, and competition.
TABLE IV
MACROZOOBENTOS ABOUT RESULTS
|
Species |
Abudance (ind/ m²) | ||
|
S.1 |
S.2 |
S.3 | |
|
Class: Gastropods | |||
|
Assiminea brevicula |
7.67 | ||
|
Cerithidea cingulata |
52.67 |
35.67 | |
|
Cerithium coralium |
21.00 |
2.00 |
21.00 |
|
Chicoreus capucinus |
1.00 | ||
|
Clypeomorus |
1.67 |
3.67 | |
|
moniliferus | |||
|
Conus sp. |
1.33 |
1.00 | |
|
Cymbiola vespertilio |
2.00 | ||
|
Cypraea annulus |
2.67 | ||
|
Cypraea errones |
2.67 |
1.33 | |
|
Cypraea miliaris |
1.33 | ||
|
Cypraea moneta |
4.33 | ||
|
Hebra corticata |
1.00 | ||
|
Monodonta labio |
3.00 |
2.67 | |
|
Nassarius coronatus |
1.33 |
2.33 | |
|
Nassarius fraudator |
3.67 | ||
|
Nassarius globosus |
0.33 |
4.00 | |
|
Nassarius venustus |
1.67 | ||
|
Natica fasciata |
3.33 | ||
|
Nerita sp. |
2.00 |
7.00 |
3.33 |
|
Polinices mammilla |
0.67 |
2.33 | |
|
Pseudovertagus aluco |
2.00 |
0.67 | |
|
Strombus luhuanus |
1.67 |
0.33 | |
|
Terebralia sulcata |
348.67 |
235.33 |
285.33 |
|
Vexillum rugosum |
2.67 |
2.33 |
3.33 |
|
Class: Bivalves | |||
|
Anadara antiquata |
3.67 | ||
|
Anomalodiscus | |||
|
20.00 |
24.00 |
49.00 | |
|
squamosus | |||
|
Circe scripta |
15.00 | ||
|
Fragum unedo |
2.00 | ||
|
Gafrarium tumidum |
11.67 |
9.33 |
13.33 |
|
Hiatula chinensis |
24.33 | ||
|
Meretrix meretrix |
0.67 |
1.00 | |
|
Pitar citrinus |
1.00 |
6.00 | |
|
Placamen chloroticum |
2.33 |
1.67 |
2.00 |
|
Protapes gallus |
15.00 |
14.67 |
44.67 |
|
Semele carnicolor |
6.00 | ||
|
Solen vagina |
2.67 | ||
|
Vasticardium flavum |
1.33 |
0.33 | |
|
Class: Crustacean | |||
|
Dotilla myctiroides |
5.33 |
4.33 |
42.33 |
|
Macrophthalmus |
5.00 |
5.67 | |
|
convexus | |||
|
Uca coarctata |
2.33 | ||
|
Uca dussumieri |
9.00 | ||
|
Uca perplexa |
2.00 |
1.00 | |
|
Uca tetragonon |
6.00 | ||
|
Class: Polychaeta | |||
|
Nereis sp. |
3.33 |
1.67 |
12.33 |
|
Class: Sipunculidea | |||
|
Siphonosoma sp. |
1.67 | ||
|
Total Abudance |
534.33 |
371.33 |
552.00 |
|
Amount of Species |
26 |
26 |
28 |
Based on the research, station 3 found 28 types of macrozoobenthos species with an average abundance of 552.00 ind/m2 where this value is the highest abundance value when compared to other stations. This is thought to be caused by the condition or characteristics of the area which has a muddy sand substrate and is densely packed with mangroves. This is suitable for macrozoobenthos life because mangroves which are abundant in nutrients are a good living environment for macrozoobenthos. Besides, in this area no buildings or ships around it so there is not much human activity that affects the area. Nugraha et al [10] stated that the amount of human activity will affect the community structure of organisms. Judging from the DO parameters of the waters, station 3 has the highest DO value than other stations. According to Sidik et al [11], the DO value in waters affects the number and types of macrozoobenthos in the waters. The higher the dissolved oxygen content, the greater the number of macrozoobenthos. At this station, few factors influence the absence of macrozoobenthos.
Diversity of Macrozoobenthos
The highest diversity index for macrozoobenthos was at station 3, which was 1.89, station 2 was 1.64 and the lowest diversity index was at station 1 with a value of 1.53. The level of diversity can be influenced by the number of species and the abundance of species at that location. According to Ucu [12], the high and low diversity index values can be caused by several factors, including the number of species or individuals obtained and the presence of several types found in abundant amounts of ecosystem conditions. A community has high species diversity if the community is composed of many species with an even number, conversely, if the community is composed of very few species, the number of species is not evenly distributed, and only a few species are dominant, then the species diversity is low.
According to Wahyuningsih et al [13], the diversity index value can be used as an estimate of the condition of the aquatic environment. Based on the Shannon-Wiener index value category, the diversity of macrozoobenthos in Gilimanuk Bay is in the moderate diversity category. Setiawan [14] stated that if 1 <H' <3, the diversity index in a water area is included in the moderate category. The diversity index obtained is included in the moderate category indicating that the waters of Gilimanuk Bay have fairly good productivity, the ecosystem conditions are quite balanced with moderate ecological pressure, and the pollution is still classified as moderate so that it is still suitable for macrozoobenthos life. The results of the macrozoobenthos diversity index can be seen in Figure 2.
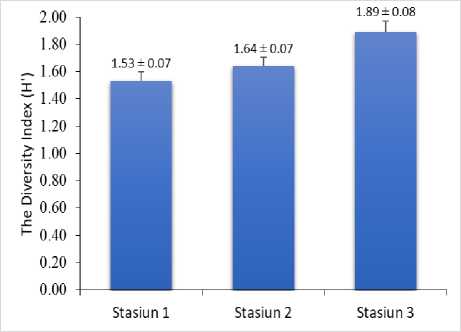
Figure 2. The Diversity Index of Macrozoobenthos
Uniformity of Macrozoobenthos
The lowest uniformity index value is at station 1, namely 0.47, indicating that there are one or several macrozoobenthos species that are relatively large in number, while several other species have relatively small numbers. The highest uniformity index value is found at station 3 which is equal to 0.57, this shows that the ecological balance at station 3 is better than other stations in a community. The higher the value of the uniform distribution of individuals between species, the more evenly the ecosystem balance will increase. This shows that the quality of the environment is getting better and more suitable for biota, although there is still competition between species for food [15]. Based on the category of the uniformity index value, it shows that the macrozoobenthos uniformity in Gilimanuk Bay is included in the moderate uniformity index category. This is based on the statement of Facrul [5], that if the measure of the uniformity index is 0.4<E<0.6, then the uniformity is in the moderate category. The moderate level of uniformity shows that the distribution of macrozoobenthos species is not evenly distributed and there are several types of species that dominate in these waters. The results of the macrozoobenthos uniformity index can be seen in Fig 3.

Figure 3. The Uniformity Index of Macrozoobenthos
Dominance of Macrozoobenthos
The highest macrozoobenthos dominance index is found at station 1 which is 0.44, station 2 is 0.42 and the lowest dominance index is at station 3 with a value of 0.29. Based on the Simpson index value category, it shows that stations 1 and 2 are included in the moderate dominance index category, while station 3 is included in the low dominance category. This is based on the statement of Fachrul [5], that if the benchmark value of the dominance index is 0<C<0.3, then the dominance is low or no type dominates. Meanwhile, if the benchmark value for the dominance index is 0.3≤C<0,6, then the dominance is moderate. The results of this dominance index further confirm that the environmental conditions in the waters of Gilimanuk Bay are quite stable and the environmental quality is sufficient to support the survival of macrozoobenthos even though there are several species that have begun to dominate but have not yet dominated strongly [16].
The dominance index values of stations 1 and 2 fall into the moderate category because not only one type is found to be abundant or dominant but there are other types that are found quite a lot such as Terebralia sulcata, Cerithidea cingulata, Cerithium coralium, Anomalodiscus squomosus, Protapes gallus, and Hiatula chinensis. This is because these species can adapt well to environmental conditions that have a muddy sand substrate. Wulandari et al. [17] stated that macrozoobenthos from the Gastropods class are found a lot in waters because they have a high tolerance for environmental changes. Fajri and Putra [18] said that Bivalves live in muddy or sandy substrates. Station 3 has a low category dominance index indicating that there are no dominant species in these waters and macrozoobenthos are evenly distributed. According to Arfiati et al. [19], the results of the low dominance index indicate that the living macrozoobenthos are in good habitat conditions. This is supported by the water quality at station 3 which is still in the normal category. The results of the macrozoobenthos dominance index can be seen in Figure 4.
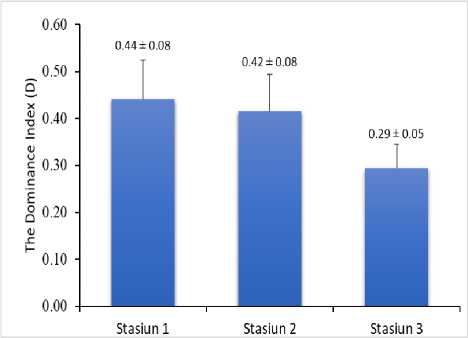
Figure 4. The Dominance Index of Macrozoobenthos
Water Quality Parameters
Measurement of water quality parameters at the three stations includes temperature, pH, salinity, turbidity, DO, and BOD. The measurement results have varied values but are still within normal limits. The results of water quality measurements can be seen in Table V.
TABLE V
RESULTS WATER QUALITY MEASUREMENT
|
Parameter |
S.1 |
S.2 |
S.3 |
Quality Standard |
|
Temperature (°C) |
29.30 |
29.00 |
28.73 |
28-32 |
|
pH |
7.24 |
7.20 |
7.52 |
7-8,5 |
|
Salinity (ppt) |
31.53 |
31.40 |
32.97 |
29-34 |
|
Turbidity |
5.93 |
9.47 |
7.67 |
< 5 |
|
(NTU) | ||||
|
DO (mg/L) |
7.46 |
7.43 |
7.65 |
> 5 |
|
BOD (mg/L) |
2.68 |
3.22 |
1.81 |
<20 |
|
Water quality |
plays |
a |
role in |
supporting |
|
macrozoobenthos |
life. Based |
on the |
results of | |
measurements in the field, the temperature values obtained ranged from 28.73-29.300C. The pH value ranges from 7.20-7.52. Then for the salinity value ranges from 31.4032.97 ppt. DO values ranged from 7.43-7.65 mg/L. The BOD value in Gilimanuk waters ranges from 1.81-3.22 mg/L. This value is still in the normal category according to seawater quality standards according to the Bali Governor Regulation number16 of 2016 [20].
Turbidity has a value ranging from 5.71-9.48 NTU, which is quite high or exceeds the quality standards that have been established. This is because these waters have a basic substrate in the form of muddy sand that is easily suspended. The presence of this suspended bottom substrate or sediment causes the turbidity value to increase. In addition, it is also caused by shipping activities that produce waste and weather conditions at the time of the research. Based on the Bali Governor Regulation number 16 of 2016 [20], the turbidity value is not more than 5 NTU. According to Sukawati et al [21], a community with favorable environmental conditions will lead to the formation of a large number of species with even abundance. However, if a community has unfavorable environmental conditions, it will tend to consist of a few species, only a few species can survive in these environmental conditions, so that these species are more dominant than other species.
-
IV. CONCLUSION
Based on the structure of the macrozoobenthos community in the waters of Gilimanuk Bay, there were found 45 spesies of macrozoobenthos. The abundance values found ranged from 371.33-552.00 ind/m2, the diversity index values ranged from 1.53-1.89, the
uniformity index values ranged from 0.47-0.57 and the dominance index values ranged from 0, 29-0.44. Based on this value, the condition of Gilimanuk Bay waters is included in moderately polluted waters. This is due to the pressure on catching or harvesting shellfish by the community, the existence of competition or predators and the occurrence of dominance in several species, but none of them have too strong dominance.
Based on the criteria for the macrozoobenthos diversity index value, the waters of Gilimanuk Bay are included in the category of moderately polluted waters where these waters have good productivity, fairly balanced ecosystem conditions and moderate ecological pressure, so that they are still suitable for macrozoobenthos life. Based on the criteria, the uniformity index value is in the medium category and the dominance index value is in the low to moderate category so that this category can confirm again that the environmental conditions in the waters of Gilimanuk Bay are quite stable and the environmental quality is sufficient to support the survival of macrozoobenthos in these waters.
ACKNOWLEDGEMENTS
We acknowledge Balai Taman Nasional Bali Barat (Balai TNBB) and all parties involved in this research.
REFERENCES
-
[1] Juwita, R. 2017. Keanekaragaman Makrozoobentos Sebagai Bioindikator Kualitas Perairan Sungai Sebukhas di Desa Bumi Agung Kecamatan Belalau Lampung Barat. Skripsi. Lampung, Indonesia: Universitas Islam Negeri Raden Intan.
-
[2] Sobari, A.I., Watiniasih, N.L., dan Pebriani, D.A.A. 2020. Keanekaragaman Makrozoobentos Sebagai Bioindikator Kualitas Perairan di Taman Hutan Raya Ngurah Rai, Bali. Current Trends in Aquatic Science, III (1): 88-96.
-
[3] Hidayani, M.T. 2015. Struktur Makrozoobentos Sebagai Indikator Biologi Kualitas Perairan Sungai Tallo, Kota Makasar. J. Agrokompleks, 4(9): 90-96.
-
[4] Brower, J.E, Zar J.H., and Von C.N. 1990. Field and Laboratory Methods for General Ecology. (3rd) edition. USA: W.C. Brown Publishers.
-
[5] Fachrul, M.F. 2007. Metode Sampling Bioekologi. Jakarta: Bumi Aksara.
-
[6] Noersativa, F.N., Anggoro, S. dan Hendrarto, B. 2015. Sumberdaya Perikanan Bentos: Terebralia sp. di Ekosistem Hutan Mangrove (Studi Kasus di Kawasan Mangrove Desa Bedono, Kec. Sayung, Kab. Demak). Management of Aquatic Resources Journal, 4(1): 82-90.
-
[7] Meisaroh, Y., Restu, I.W, dan Pebriani, D.A.A. 2019. Struktur Komunitas Makrozoobenthos Sebagai
Indikator Kualitas Perairan di Pantai Serangan Provinsi Bali. J. of Marine Aquatic Sci, 5(1): 36-43.
-
[8] Syury, R.P., Dharma, I.B.G.S., Elok, F. 2019. Diversitas Makrozoobentos Berdasarkan Perbedaan Substrat di Kawasan Ekosistem Mangrove Desa Pejarakan, Buleleng. Journal of Marine Research and Technology, 2(1): 1-7.
-
[9] Silaen, I.F., Hendrarto, B., dan Supardjo, M.N. 2013. Distribusi dan Kelimpahan Gastropoda pada Hutan Mangrove Teluk Awur Jepara. Journal of Management of Aquatic Resources, 2(3): 93-103.
-
[10] Nugraha, I.B.A.S., Julyantoro, P.G.S., dan Saraswati, S.A. 2018. Struktur Komunitas Moluska di Perairan Pantai Grand Bali Beach Sanur, Bali. Current Trends in Aquatic Science, 1(1): 64-71.
-
[11] Sidik, R.Y., Dewiyanti, I. dan Octavina, C. 2016. Struktur Komunitas Makrozoobentos di beberapa Muara Sungai Kecamatan Susoh Kabupaten Aceh Barat Daya. Jurnal Ilmiah Mahasiswa Kelautan dan Perikanan Unsyiah, 1(2): 287-296.
-
[12] Ucu, Y.A. 2011. Struktur komunitas Moluska Di Padang Lamun Perairan Pulau Talise, Sulawesi Utara. Jurnal Oseanologi dan Limnologi di Indonesia, 37(1): 71-89.
-
[13] Wahyuningsih, F., Arthana, I.W., dan Saraswati, S.A. 2020. Struktur Komunitas Echinodermata di Area Padang Lamun Pantai Samuh, Kecamatan Kuta Selatan, Kabupaten Badung. Current Trends in
Aquatic Science, III (2): 52-58.
-
[14] Setiawan, D. 2009. Studi Komunitas
Makrozoobenthos di Perairan Hilir Sungai Lematang Sekitar Daerah Pasar Bawah Kabupaten Lahat. Jurnal Penelitian Sains, 9, 12-14.
-
[15] Zarkasyi, M. M., Zayadi, H., dan Laili, S., 2016. Diversitas Pola Distribusi Bivalvia di Zona Intertidal Daerah Pesisir Kecamatan Ujung Pangkah Kabupaten Gresik. Jurnal Ilmiah Biosainstropis (BioscienceTropic), 2(1): 1-10.
-
[16] Samson, E. dan Kasale, D. 2020. Keanekaragaman dan Kelimpahan Bivalvia di Perairan Pantai Waemulang Kabupaten Buru Selatan. Jurnal Biologi Tropis, 20(1): 78-86.
-
[17] Wulandari., Wahyuningsih, H., dan Muhtadi, A. 2016. Struktur Komunitas Makrozoobenthos di Kawasan Mangrove Desa Bagan Deli Kecamatan medan Belawan. J. Univ. Sum. Utara, 14(4): 82-93.
-
[18] Fajri, N.E. dan Putra, R.M. 2014. Community of Bivalves in Mangrove Area Mesjid Lama Village, Talawi Sub-district Batubara Regency, Sumatera Utara Province. JOM Bidang Perikanan dan Ilmu Kelautan, 1(1): 1-16.
-
[19] Arfianti, D., Herawati, E.Y., Buwono, N.R., Firdaus, A., Winarno, M.S., dan Puspitasaria, A.W. 2019.
Struktur Komunitas Makrozoobentos pada Ekosistem Lamun di Paciran, Kabupaten Lamongan, Jawa Timur. J of Fisheries and Marine Res., 3(1): 1–7.
-
[20] Peraturan Gubernur Bali. 2016. Peraturan Gubernur Bali Nomor 16 Tahun 2016 tentang Baku Mutu Lingkungan Hidup dan Kriteria Baku Kerusakan
Lingkungan Hidup. Bali, Indonesia: Pemerintah Propinsi Bali.
-
[21] Sukawati, N.K.A., Restu. I.W., dan Saraswati, S.A. 2018. Sebaran dan Struktur Komunitas Moluska di Pantai Mertasari Kota Denpasar, Provinsi Bali. J. of Marine and Aquatic Scie., 4(1): 78-85.
Discussion and feedback