Effect of Different Stocking Densities on the Growth and Survival Rate of Tilapia (Oreochromis niloticus) Seeds in Batur Lake Floating Net Cages
on
Advances in Tropical Biodiversity and Environmental Sciences 5(2): 50-56, August 2021 e-ISSN:2622-0628
DOI: 10.24843/ATBES.v05.i02.p03 Available online at: https://ojs.unud.ac.id/index.php/ATBES/article/view/69738
50
Effect of Different Stocking Densities on the Growth and Survival Rate of Tilapia (Oreochromis niloticus) Seeds in Batur Lake Floating Net Cages
Hikmah Nurazizah1, I Wayan Arthana1, and Gde Raka Angga Kartika1
1Department of Aquatic Resources Management, Faculty of Marine and Fisheries, Udayana University Jl. Kampus Unud Bukit Jimbaran, Kuta Selatan, Badung, Bali
*Corresponding author: hikmahnurazizah1998@gmail.com
Abstract. Stocking density is an important factor in cultivation, it can save land use, and increase the efficiency of fish farming. The purpose of this research was to determine the different density information on tilapia seeds measuring 2-3 cm as an alternative to using tilapia (O. niloticus) seeds 7-9 cm in size so that they can be developed in Batur Lake. The research was conducted in January - March 2020 in the floating net cages in Trunyan Kintamani village, Bangli, Bali. The research used a completely randomized design method with three treatments and three repetitions. The Tilapia seeds used are 2-3 cm with different stocking densities, 100 ind/m3, 150 ind/m3, and 200 ind/m3. The parameters observed were SGR (Specific Growth Rate), absolute growth, SR (Survival Rate), FCR (Feed Conversion Ratio) and water quality including temperature, DO, pH, TDS. The results of this study indicated that stocking density did not have a significant effect on the growth and survival rate of tilapia seeds, because the temperature was too cold so that the tilapia seeds failed to adapt properly at the beginning of stocking and the physiological conditions of the fish were disturbed so that the fish experienced stress and went to died. Water quality parameters measured include temperature with a range value of 25.86-25.880C, pH with a range value of 9.08-9.13, DO (Dissolved oxygen) with a range value of 7.9-8 mg/L and TDS (Dissolved solids) with a range value of 1040.25-1041.58 mg/L.
Keywords: growth; survival rate; tilapia
-
I. INTRODUCTION
Aquaculture of Tilapia (O. niloticus) is currently practiced by local farmers in Indonesia. According to the KKP [1] the total production of tilapia aquaculture in Indonesia has increased between 2015-2017 is 13.13%, and it is known that in 2017 the production of tilapia aquaculture in Indonesia was 1.26 million tons. However, tilapia aquaculture production in Bali Province has decreased, where tilapia production decreased in 2016 by 118.5 tons, while in 2017 it was 17.5 tons. From these particulars, it is known that the production of tilapia in Bali is not optimal due to the availability of fish seed cannot be met by the local tilapia fish farmers. Increasing production can be done by increasing stocking density. Stocking density is one aspect of cultivation that needs to be known because it determines the growth rate, feed conversion ratio and survival [2].
Stocking density is an important factor in determining the success of a cultivation activity [3], the importance of stocking density is to save land use and increase the efficiency of fish farming [4]. Fish density is also a factor that greatly affects the growth of tilapia. The arrangement of stocking density is carried out to minimize competition
between individual fish one of them is competition for space to move. In addition to better growth, the right stocking density can also reduce the mortality rate, so it is expected that the survival rate is high. The stocking density can determine the level of maintenance intensity, the higher the stocking density means the more fish quantity/biomass per unit area, the higher the level of maintenance.
Based on Diansari research [3], density of fish can reduce water quality, slow fish growth, low fish survival rates and high levels of fish size diversity and high density in aquaculture activities can result in low production. In addition, it can cause competition for space and seizure of dissolved oxygen in fish, it can also cause fish to experience stress, thus inhibiting metabolism and resulting in decreased fish appetite [5]. This research was conducted to determine differences tilapia fish stocking density of 23 cm size as an alternative to the use of tilapia fish (O. niloticus) size 7-9 cm to be developed at Batur Lake.
-
II. METHODS
The experimental design used a completely randomized design consisting of three treatments and three
replications. The test material used tilapia (O. niloticus) variabel cotrol with different stocking densities. The treatments were treatment a (stocking density 100 ind/m3), treatment B (stocking density 150 ind/m3), treatment C (stocking density 200 ind/m3).
Location and Technique sampling
The research was conducted in the floating net cages (KJA) of Batur Lake, Trunyan Village. Particulars was collected for 42 days from January to March 2020, with sample measurements every two weeks. (Figure 1).
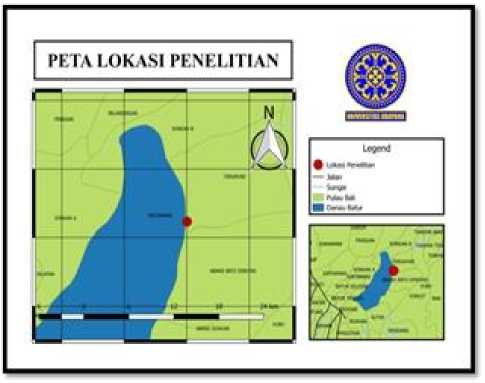
Figure 1. KJA Batur Lake
Tools and Materials
The tools used in the research were pH meters, DO meters, thermometers, TDS meters, rulers, scissors, ropes, scales, basins, 3x1 m nets, scoop nets, the materials used in this research tilapia fish size 2-3 cm and use crumble pellet feed.
Research Parameters
The parameters measured were the specific daily growth rate (SGR), absolute length growth, feed conversion ratio (FCR), and survival rate. The supporting parameters in this study are water quality which includes temperature, DO (dissolved oxygen), pH and TDS. The formula used in the study is as follows:
SGR= LnWt-LnW0 χ 100% t
Noted: SGR is the daily specific growth rate (% / day), Wt is the average weight of fish at the end of the study (g/head), Wt is the average weight of fish at the beginning of the study (g/fish), and t is the time [6].
L= Lt – Lo
Noted: L is the absolute length growth (cm), Lo is the body length at the end of the study (cm), and L is the length of the fish body at the start of the study (cm) [6].
SR= — x 100% No
Noted: SR is survival rate (%), Nt is amount of fish at the end of study, and No is amount of fish at start study [7].
FCR=
F (Wt+D)-Wo
Noted: FCR is feed conversion ratio, F is weight of feed given during the study (grams), Wt is total fish weight at the end of the study (grams), D is total weight of fish that died during the study (grams), and Wo is total weight fish at start study (grams) [8].
Data analysis
Analyzed data using the One Way ANOVA method with the Statistical Product and Service Solution (SPSS) program, if the stocking density had a significant or significant effect on the growth and survival of tilapia seeds, the Duncan test was performed with significant 5%.
-
III. RESULT AND DISCUSSION
Absolute Length
The growth includes the growth of tilapia fish length, weight and length of absolute growth. Based on the observation that the absolute growth of tilapia fish ranged from 1.66 to 1.76 cm that the highest value in the treatment of B with an average of 1.76 cm and then followed treatment C with an average value of 1.72 cm, and the length of the absolute lowest in treatment A with a range value of 1.66 cm. The research was conducted in Lake Batur using tilapia fish 2-3 cm with different stocking densities of 100, 150, 200 ind/m3 for 42 days. Based observed that the length and weight growth has increased in every week, in because the feed utilized optimally by the fish. This concurs with Taufik et al. [9] that the feed is a source of energy for the fish to move, grow and defend against disease.
Growth is a change in weight and length over a certain period of time [10]. Growth was influenced by two factors, namely internal factors of which the nature of heredity and age, while external factors, namely the aquatic environment and disease [11]. In the maintenance of optimal water quality affects the growth of the weight and length of fish, and feed is vital to the growth of the fish weight. Most of the feed given to the process of metabolism and the rest is used for other activities such as growth. This concurs with Yolanda [12] that sufficient amounts of nutrients in the feed is not only able to provide energy for the body's metabolic processes tilapia, but also meet the needs of tilapia to grow. Absolute length of tilapia seeds (Figure 2).
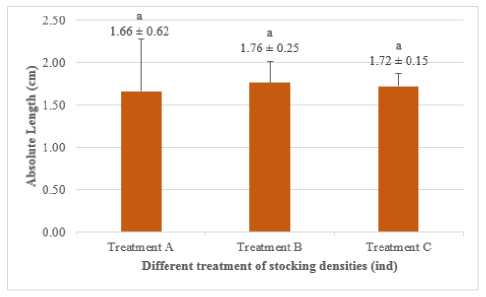
Figure 2. Absolute length of tilapia
Growth in treatment B had the highest absolute length value of 1.76 cm. Then the lowest growth in treatment A with the lowest absolute value of 1.66 cm long. From the results of the One-Way ANOVA all treatments did not have a significant effect on the growth of tilapia seeds. This is because the stocking density still provide space and energy utilization is relatively small tilapia fish. In addition, the growth of tilapia is supported by the availability of sufficient amount of feed and the optimal stocking density. Research conducted by Putra et al. [13] results higher absolute length of between 3.55 to 4.14 cm. This result is higher than this study due to the addition of the rGH (Recombinant growth hormone) hormone in the feed so that it provides additional protein levels in the feed.
The low growth is influenced by the quality of the water, at the time of the research the rainfall was high enough so that the low temperature was around 25.86-25.88 °C which caused the growth of fish seeds to slow down and become dead, this was because the temperature greatly affected metabolic processes. Sugiyanto [14] says that rainfall in pool maintenance caused the temperature decreases so that the metabolism of the fish pond is low. Low temperatures result in most of the energy stored in the fish's body being used for adaptation to the environment, and disrupt fish growth due to digestive system disorders. This agrees with Kelabora [15]) that changes in temperature or temperature instability affect the growth and survival of fish seeds.
Specific Growth Rate (SGR)
The specific growth rate (SGR) was used to determine the weight of tilapia (O. niloticus). Based on the research that the SGR value ranged from 2.51-3.21%/day with the highest SGR in treatment B, namely 3.21%/day, followed by treatment A, namely 3.02%/day, treatment C which was 2.51%/day. The results of the One-Way ANOVA all treatments did not have a significant effect on SGR of tilapia seeds. Specific growth rate of tilapia seeds (Figure.3).
The average results of SGR tilapia fish during the maintenance period ranged from 2.51 to 3.21%/day. The measurement results of specific growth rate of tilapia fish
(O.niloticus) in treatment B showed the highest value, in because the fish can utilize optimally feed given, so that the feed is absorbed and converted into meat [16]. Ali et al. [17] stated that fish growth in ponds is influenced by the interaction of various factors such as food, space, temperature, salinity, season and physical activity. In addition, the growth of tilapia is also supported by the availability of sufficient quantity of feed and is supported by an optimal stocking density [18].
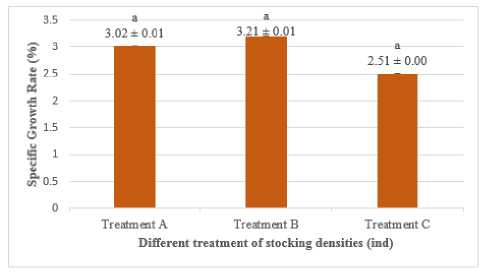
Figure 3. Specific growth rate of tilapia
The specific growth value of treatment C has the lowest value, namely 2.51, the low SGR value is thought to be due to the environmental conditions of Batur Lake which have a fairly fast and wavy current, so that the tilapia seeds adapt longer to the lake environment and cause seed growth is not optimal. The strong currents make tilapia seeds need extra energy to maintain a swimming balance, the nutrients obtained from the feed should be used for growth to be reduced. The strong currents in floating net cages in Batur Lake are also thought to be a factor in inhibiting the growth of tilapia seeds in this research. This results in disruption of the physiological conditions of the fish, namely a decrease in appetite and the energy absorbed from the feed is not optimal [19] said that growth was influenced by fish species, the environment and food.
The feed given during the cultivation period greatly affects growth, with environmental conditions that are not suitable for tilapia seed habitat, a feed with more nutrients is needed for the growth process. In a research conducted by Putra et al. [13] the range value SGR for 2 months was 3.55-4.28%/day. Because the addition of rGH hormones that stimulate the growth of feed on fish seed Gurame [20]. The same thing with Ihsanudin [21] that the SGR value is 9.72-10.92%/day, that the addition of rGH to tilapia feed at different time intervals increases the growth rate of fish by improving the performance of nutrient metabolism in the fish body and increase the level of feed consumption [22]. The low SGR value in Batur Lake is due to unfavorable environmental conditions and decreased appetite for fish.
Survival Rate (SR)
The survival rate (SR) is the percentage of the number of fish that are alive during the rearing period. Based on the research, the SR value ranged from 15.2-18.1%. The highest SR value was found in treatment C which was 18.1%, then followed by treatment B which was 15.8%, treatment A was 15.2%. The results of the One Way ANOVA all treatments did not have a significant effect on SR of tilapia seeds. Survival rate of tilapia seeds (Figure 4).
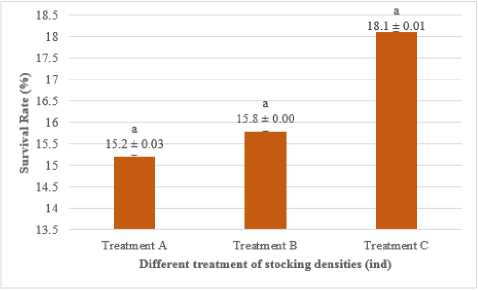
Figure 4. Survival rate
Survival rate tilapia fish during the research range value 15.2 to 18.1%. The results of the One-Way ANOVA all treatments did not have a significant effect on the survival of tilapia seeds. Tilapia seeds are said to have not been able to survive in the floating net cages of Batur Lake because of the environmental conditions of Batur Lake which have strong and wavy currents, so growth is not optimal. This concurs with Noviana et al. [23] stated that weather conditions affect tilapia seeds to become stressful and susceptible to disease.
The results of the research have a very low SR value because the fish seeds are too small and the water temperature is quite cold around 25.86-25.88 C. The water temperature between the morning and evening is quite cold which is supported by high rainfall, this is what causes many tilapia fish to die. According to Pal et al. [24] show that there are effects of climate and geographical conditions of lakes that can affect temperature fluctuations in lake waters. Graph of tilapia seed mortality over 42 days (Figure 5).
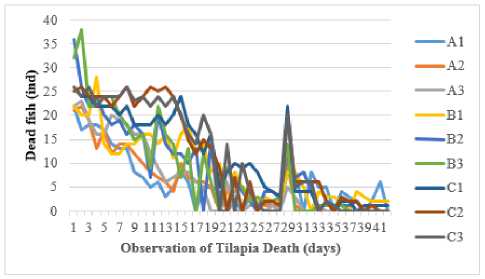
Figure 5. Mortality of tilapia
The graphic above explains that many of the tilapia seeds died at the beginning of the research. This is presumably because the temperature was too cold to reach 24 ˚C so that the fish seeds failed to adapt and many died at the beginning of stocking.
This agrees with Kordi 25] that tilapia is not suitable for living in a fairly cold area. Temperature affects the metabolism and growth of fish. In addition, the temperature is too drastic can cause fish physiological disorders that cause fish stress [26]. This is different from the cultivation of gouramy seeds with a size of 3-6 cm carried out in Batur Lake which has a higher SR between 72-82% because carp have an additional breathing apparatus in the form of a maze [27]. And the effect of feed given impact on the survival of cultured fish seed for fish feed as energy to survive and growth [11].
Feed Conversion Ratio (FCR)
The feed conversion ratio (FCR) is the ratio between the weight of the feed given to the weight of the fish produced. The results showed that the FCR value ranged from 2.052.84 with the highest FCR or feed conversion rate in treatment C, namely 2.84, followed by treatment A, namely 2.34 and the lowest in treatment B, namely 2.1. The results of the One-Way ANOVA all treatments did not have a significant effect on the FCR of tilapia seeds. Feed conversion ratio of tilapia seed (Figure 6).
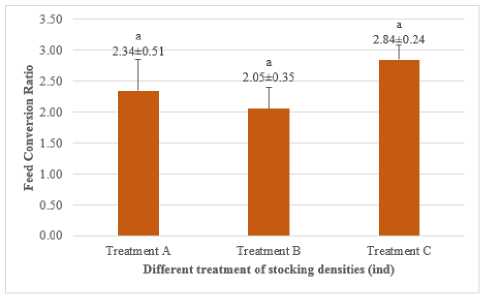
Figure 6. FCR of tilapia
The FCR seed of tilapia seeds during the study ranged from 2.05-2.84. The results of the One-Way ANOVA all treatments had no significant effect on the FCR of tilapia. The use of feed for tilapia (O. niloticus) is determined from the growth and the amount of feed given. The highest feed conversion ratio value in treatment C, namely 2.84, is thought to be due to the density of fish, this agrees with Barrows et al. [28] stated that the value of the feed conversion ratio is influenced by several factors such as density, weight of each individual, age, water temperature and feeding (quality, quantity and frequency of feeding). While the lowest FCR in treatment B is 2.05, it is assumed that the fish can take advantage of the feed given optimally, so that the feed is absorbed and converted into meat. This is in accordance with the opinion of Stickney [29] that the
value of the feed conversion ratio is closely related to feed quality. The lower the feed conversion value, the more efficient the fish is in utilizing the feed they consume for growth, so that the fish body weight increases because the feed can be digested optimally.
The results of the Ihsanudin [21] that the FCR value from 0.77 to 1.29 with the addition of rGH on feed with different time intervals gives a significantly different effect due to the growth of feed utilization is very efficient, due to the pattern of appetite relatively large fish so that the needs of feed used for growth is met. The same thing with Sarpawi [30] that the FCR value of 0.58-0.89 different density of pandu fish seed can take advantage of feed, and can adapt well to high salinity media. This is different from the FCR value of the study in Batur Lake where the size of the feed conversion ratio value is thought to be due to different nutrient absorption in each species, age, size and number of tested fish.
Barrows et al. [28] stated that the value of the feed conversion ratio is influenced by feed protein. Feed protein that is in accordance with the nutritional needs of fish results in more efficient feeding, besides that it is influenced by the amount of feed given, with less feed given the more efficient feeding is given. According DKPD [31] the value of the food conversion ratio (FCR) were quite good ranging between 0.8-1.6. This means that 1 kilogram of consumption tilapia is produced from 0.81.6 kg of feed. According to Susanti [32] a low feed conversion value means that the quality of the feed given is good. Meanwhile, when the value of high feed conversion means the feed quality is poor. The lower the feed ratio value, the better the quality of the feed given.
Water quality
The Water quality parameters measured during the research, namely pH, DO, temperature and TDS. The results of water quality measurements show that the pH value obtained ranges from 9.08-9.13. Based on all treatments have almost the same pH value, the highest pH value is found in treatment C which is 9.13, followed by treatment B which is 9.11, and finally treatment A which is 9.08. The value of dissolved oxygen or DO obtained ranged from 7.9 to 8 mg /L, where the highest value was found in treatment A and treatment C, namely 8, then followed by treatment B, namely 7.9 mg/L. Temperature ranges between 25.86-25.88 C. TDS values ranged from 1040.25-1041.58 mg/L, the highest value was in treatment C followed by treatment B, namely 1041.50 mg/L, then treatment A was 1040.25 mg / L (Table I).
Water quality is a parameter of success in an aquaculture. The current condition of Batur Lake waters tends to change, especially the water quality due to the influence of community activities around the lake.
Conditions Batur Lake is the water system is closed and there is no outlet affects the quality of water and the pressure will increase in the presence of fishing activities that generate waste as their neighborhood vegetable farming, the tourist area, the cultivation of fish floating net (KJA) and other uses [33]. Tilapia is a fish species that has a high tolerance to changes in the marine environment, but the water quality in aquaculture container must remain properly managed so that growth remains optimal [34].
TABLE I
AVERAGE WATER QUALITY IN BATUR LAKE
|
Parameters |
Treatment | ||
|
A (300 ind/m3) |
B (450 ind/m3) |
C (600 ind/m3) | |
|
pH |
9.08 |
9.11 |
9.13 |
|
DO (mg/L) |
8 |
7.9 |
8 |
|
Temperature (°C) |
25.86 |
25.88 |
25.87 |
|
TDS (mg/L) |
1040.25 |
1041.50 |
1041.58 |
Water quality parameters measured in the research include temperature, pH, DO, and TDS, water temperature greatly affects the metabolism and growth of fish and affects the amount of feed consumed by fish. The temperature in each treatment ranged from 25.86-25.88 C. The temperature is cool enough for the growth of tilapia, causing physiological disorders and easily stressed fish [26], but in the [35] the temperature including the optimal temperature for tilapia fish farming. The pH value during the research ranged from 9.08 to 9.13, including less than optimal pH for tilapia fish farming it is in accordance with [35] that the optimal pH range of 5 to 8.5. According to Effendi (2003) that the pH influence on the survival and growth rates of fish because most aquatic organisms are sensitive to changes in pH so that when the pH in the range which is not optimal then growth will be stunted fish. According to Dauhan et al. [36] the high and low pH waters tend to be associated with dissolved oxygen, where the higher the tendency of dissolved oxygen alkaline pH and contrarily.
Results of dissolved oxygen in the Batur lake between 7.9 to 8 mg/L, dissolved oxygen is an indicator of water quality, ecological conditions, the productivity and health of the waters [37]. DO in the water can be an important parameter because it is needed in the oxidation process and become a major limiting factor for the activity and survival of fish that affects the metabolic processes in the body of the fish. According to Delong et al. [38], fish are able to live in a DO range of 5-7.5 mg/L, in the study DO values ranged from 7.9-8 mg/L. This indicates that the DO value is within the recommended minimum so that the fish are still able to survive. The effect of decreasing dissolved oxygen in water can cause stress and even mass death [39].
Total dissolved solids (TDS) is a measure of the amount of dissolved material in a water. The high TDS value can be caused by an increase in fish activity, food waste and fish metabolic waste products. The TDS value during the research ranged from 1040.25-1041.58 mg/L, and it can be said that it is not good enough in aquaculture activities. It is based on Government Regulation No. 82 of 2001, in which the maximum limit of TDS waters is <1.000 mg / L, the limit can be used as a basic reference TDS in water for farming activities [40].
-
IV. COCLUSION
Different stocking density that does not give effect to the growth and the survival of tilapia fish (O. niloticus) are aquaculture in Batur Lake.
ACKNOWLEDGMENT
I am grateful to Mr I Made Puja as the owner in floating net cages in Trunyan which helps a lot when the field. To friends who have helped in the retrieval of research. Bidikmisi and scholarship that has helped in the study.
REFERENCE
-
[1] Kementerian Kelautan dan Perikanan. 2018. Marine and Fisheries in Figures. Jakarta: Pusat data statistik dan informasi. Hal 19-20.
-
[2] Utami, Kesuma Putri. 2018. Pengaruh Kepadatan Yang Berbeda Terhadap Efesiensi Pemanfaatan Pakan, Pertumbuhan dan Kelulushidupan Ikan Tawes (Puntius javanicus) pada Sistem Resirkulasi. Jurnal Sains Akuakultur Tropis, 2(2):53-63.
-
[3] Diansari RRVR, Arini E, Elfitasari T. 2013. Pengaruh kepadatan yang berbeda terhadap kelulushidupan dan pertumbuhan ikan nila (Oreochromis niloticus) pada sistem resirkulasi dengan filter zeolit. J. of Aqua. Manag. and Tech., 2(3): 37-45.
-
[4] Ahmad T, Sofiarsih L, and Rusmana. 2007. The growth of patin (Pangasius hypopthalmus) in a close system tank. Indonesian Aquaculture Journal, 2(1): 67-73.
-
[5] Kadarini, T. Sholichah, L. dan Gladiyakti, M. 2010. Pengaruh Padat Penebaran terhadap Benih Ikan Hias Silver Dollar (Metynnis hypsaucen) dalam Sistem Resirkulasi. Di dalam: Prosiding Balai Riset Budidaya Ikan Hias. Depok. 8 hlm.
-
[6] Zonneveld, N. E., A. Huisman., dan J. H. Boon. 1991. Prinsip-prinsip Budidaya Ikan. Jakarta: PT.
Gramedia Pustaka Utama. 318 hlm
-
[7] Effendi, M.I, 1997. Biologi Perikanan. Yogyakarta: Yayasan Pustaka Nusantara 163 hlm.
-
[8] Djajasewaka. H dan Djajadireja. R. 1985. Pengaruh Makanan Buatan Dengan Kandungan Serat Kasar
Berbeda terhadap Pertumbuhan Ikan Mas. Buletin Penelitian Perikanan Bogor, (I): 55–57.
-
[9] Taufik, T., Firdus, F., dan Arisa, I. I. 2016. Pertumbuhan Benih Ikan Bawal Air Tawar (Colossoma macropomum) Pada Pemberian Pakan Alami yang Berbeda. Jurnal Ilmiah Mahasiswa Kelautan dan Perikanan Unsyiah, 1(3): 355-365.
-
[10] Satyani, D., Nina, M., dan Lili, S. 2010. Gambaran Pertumbuhan Panjang Benih Ikan Botia (Chromobotia macracanthus) Hasil Budidaya pada Pemeliharaan dalam Sistem Hapa dengan Padat Penebaran 5 Ekor Perliter. Di dalam: Prosiding Forum Inovasi dan Teknologi Akuakultur: 395-402.
-
[11] Kordi. 2009. Budidaya Perairan. Buku kedua. Bandung: PT Citra Aditya Bakti.
-
[12] Yolanda, S., L. Santoso, dan E. Harpeni. 2013. Pengaruh Substitusi Tepung Ikan Dengan Tepung Ikan Rucah Terhadap Pertumbuhan Ikan Nila Gesit (Oreochromis niloticus). e-Jurnal Rekayasa dan Teknologi Budidaya Perairan, 1(2): 95-100.
-
[13] Putra A.W, Fajar Basuki, Tristiana Yuniarti. 2016. Pengaruh Penambahan recombinant Growth Hormone (rGH) Pada Pakan Dengan Kadar Protein Tinggi Terhadap Pertumbuhan Dan Tingkat Kelulushidupan Benih Ikan Gurame (Osphronemus goramy). Journal of Aquaculture Management and Technology, 5(1): 17-25.
-
[14] Sugiyanto, H.N. 2016. Efektifitas Pemberian Enzim Papain Terhadap Pertumbuhan Ikan Nila (Oreochromis niloticus) Di Keramba Jaring Apung Waduk Cirata. [Skripsi]. Fakultas Perikanan Dan Ilmu Kelautan Universitas Padjajaran, Jatinangor.
-
[15] Kelabora, Dominggas M. 2010. Pengaruh Suhu terhadap Kelulusan hidup dan Pertumbuhan Benih Ikan Mas (cyprinus carpio). Jurnal Perikanan Terubuk, 38(1): 0126-6265.
-
[16] Nofyan, E. 2005. Pengaruh Pemberian Pakan dari Sumber Nabati dan Hewani terhadap Berbagai Aspek Fisiologi Ikan Gurami (Ospheronemus gourami L). Jurnal Iktiologi Indonesia, 5(1): 19–23.
-
[17] Ali, M., F. Iqbal, A. Salam, S. Iram, dan M. Athar, 2005. Comparative study of body composition of different fish speciesm from brackish water pond. Int. J. Environ. Sci. Tech, 2(3): 229-232.
-
[18] Cortez J., E.H. Villarreal Colmenares., L.E. Cruz-Suarez., R. Civera-Cerecedo., H. NolascoSoria and A. Hernandes-Llamas. 2005. Effect of Different Dietary Protein and Lipid Levels on Growth and Survival of Juvenile Australia Red Claw Crayfish (Cherax quadricarinatus). Aquaculture Nutrition, 11(4): 283-291.
-
[19] Handajani, H. dan W. Widodo. 2010. Nutrisi Ikan. UMM Press, Malang, 271 hlm.
-
[20] Fitriadi, M.W., Fajar, B., Ristiawan, A.N. 2014. The Effect of Recombinant Growth Hormone (rGH) through Oral Methods with Different Time Intervals of the Survival and Growth of Giant Goramy Larvae Var Bastard (Osphronemus goramy L). J. of Aqua. Manag. and Tech., 3(2): 77–85.
-
[21] Iman, I., S. Rejeki., T. Yuniarti. 2014. The Effect of Growth Hormone Recombinant by Oral with Different of Time to the Growth and Surive of Larasati Tilapia Fish Juvenile (Oreochromis
niloticus). J. of Aqua. Manag. and Tech. 3(2): 94-102.
-
[22] Raven P. A, Sakhrani D., Beckman B, Neregard L, Sundstrom L. F, Bjorsson B. Th, Devlin R. H. 2012. Growth and Endocrine Effect of Recombinant Bovine Growth Hormone Treatment in Non-Transgenic and Growth Hormone Transgenic Coho Salmon. General and Comparative Endocrinology. 177: 143- 152.
-
[23] Noviana, P, Subandiyono dan Pinandoyo. 2014. Pengaruh Pemberian Probiotik dalam Pakan Buatan terhadap Tingkat Konsumsi Pakan dan Pertumbuhan Benih Ikan Nila (Oreochromis niloticus). Program Studi Budidaya Perairan, Jurusan Perikanan Fakultas Perikanan dan Ilmu Kelautan, Universitas Diponegoro. Semarang. Journal of Aquaculture Management and Technology, 3(4): 183–190.
-
[24] Pal, M., Samal, N.R., Roy, P.K., Malabika, B. Roy. 2014. Temperature and dissolved oxygen stratification in the lake Rudrasagar: Preliminary investigations. Sustainability, Agri Food and Environmental Research, 2(1): 1-12.
-
[25] Kordi, K. 2013. Budidaya Nila Unggul. Jakarta Selatan: Agro Media Pustaka 148 hlm
-
[26] Athirah, A., Mustafa, A dan Michael A. Rimmer. 2013. Perubahan Kualitas Air Pada Budidaya Ikan Nila (Oreochromis niloticus) Di Tambak Kabupaten Pangkep Provinsi Sulawesi Selatan. Di dalam: Prosiding Forum Inovasi Teknologi Akuakultur 2013. Sulawesi Selatan.
-
[27] Susanto, H. 2002. Pembenihan dan Pembesaran Patin. Jakarta: Penebar Swadaya.
-
[28] Barrows, P. A and Hardy. 2001. Probiotic for Chickens. In: Probiotics the Scientific Basis. R. Filler (Ed). Chapman and Hall. London.
-
[29] Stickney, R.R. 1979. Principles of Warm Water Aquaculture. John Wiley and Sons Inc. New York. Pp 223-229.
-
[30] Sarpawi Ahmad, I. N., Fajar Basuki., Sri Hastuti. 2014. Analisis Kelulushidupan dan Pertumbuhan Benih Ikan Nila Saline Strain Pandu (Oreochromis
niloticus) Yang Di Pelihara Di Tambak Tugu, Semarang dengan Kepadatan Berbeda. Journal of Aquaculture Management and Technology, 3(2): 2532.
-
[31] Dinas Kelautan dan Perikanan Daerah. 2010. Petunjuk Teknis Pembenihan dan Pembesaran Ikan Nila. Sulawesi Tengah: Dinas Kelautan dan Perikanan. 2 hlm
-
[32] Susanti, D. 2004. Pengaruh Penambahan Berbagai Silase Produk Perikanan dalam Ransum Pakan terhadap Pertumbuhan dan Kelulushidupan Benih Ikan Nila Gift. [Skripsi]. Semarang: Universitas Diponegoro, 19 hlm.
-
[33] Suryono, T., F. Sulawesty, S. Sunanisari, A.A. Meutia, Triyanto, G.S. Haryani, A.B. Santoso, Y. Sudarso, Cynthia H., T. Tarigan, G.S. Aji, R.L. Toruan, S. Nomosatryo, E. Mulyana, I. Ridwansyah dan Y. Mardiati. 2006. Kajian Karakteristik Limnologi untuk Pengelolaan Habitat Perairan Danau Batur. Provinsi Bali. Laporan Teknis DIPA 2006. Cibinong. Program Penelitian dan Pengembangan Ilmu Pengetahuan dan Teknologi: Pusat Penelitian Limnologi Lembaga Ilmu Pengetahuan Indonesia. 233p.
-
[34] Kordi, M. G. H, 2010. Pemeliharaan Ikan Nila secara Intensif. Jakarta: Akademia.
-
[35] Standar Nasional Indonesia No. 7550: 2009. Produksi Ikan Nila (Oreochromis niloticus) Kelas Pembesaran di Kolam Air Tenang. Jakarta: Badan Standarisasi Nasional.
-
[36] Dauhan R. E. S, E. Efendi. Suparmono. 2014. Efektifitas Sistem Akuaponik dalam Mereduksi Konsentrasi Amonia pada Sistem Budidaya Ikan. Jurnal rekayasa dan teknologi budidaya perairan, 3 (1): 297–302.
-
[37] Wetzel, R.G. 2001. Lymnology Lake and River Ecosytem 3rd Ed. London: Academic Press.
-
[38] Delong, D.P., Losordo,T.M., and Racocy J.E. 2009. Tank Culture of Tilapia. Southern Regional Aquaculture Center, Publication 282: 1-8.
-
[39] Boyd, C.E. 1988. Water Quality in Warmwater Fish Pond. Fourth Printing. Alabama USA: University Agicultural Experiment Station, 359p.
-
[40] Effendi, H., Utomo, B.A., dan Darmawangsa, G.M. 2015. Phytoremediation of Freshwater Crayfish (Cherax ouadricaarinatus) Culture Wastewater with Spinach (Ipomoea aquatica) in Aquaponic System. Aquarium, Conservation and Legislation, 8(3): 421430.
Discussion and feedback