Implementation of ANN-CFB Methods in Measuring Community Satisfaction Level of Denpasar City on the Aspect of Government Services
on
Advances in Tropical Biodiversity and Environmental Sciences 3(2): 29-32, September 2019 ISSN: 2622-0628
DOI: 10.24843/atbes.v03.i02.p03 Available online at: https://ojs.unud.ac.id/index.php/ATBES/article/view/53759
29
Implementation of ANN-CFB Methods in Measuring Community Satisfaction Level of Denpasar City on the Aspect of Government Services
I Wayan Santiyasa* and Luh Eka Kusumayanti
Faculty of Mathematics and Natural Sciences, Udayana University Kampus Bukit Jimbaran, Badung, Bali
*Corresponding author: santiyasa@unud.ac.id
Abstract. The concept of a smart city is indeed presented as an answer for efficient management of resources. Support for applications that are constantly evolving and the creation of a creative ecosystem in the field of technology, is a good firs t step towards a smart city. But in reality smart city is not only related to technology. This concept is a combination of new technology and intelligent thinking about the use of technology. As a city full of allure, Denpasar City along with its development and population growth, began to emerge various problems such as decreasing the qu ality of public services, congestion on the road, accumulation of garbage and other social problems. To solve these problems, Denpasar needs a smart, creative and innovative solution run by the ranks of government officials, from leaders to the lowest levels, and supported by the full commitment of all its citizens. Various efforts have been made by the Denpasar City government to facilitate services to the community, ranging from building a system to facilitate services to the community such as the health service system, population service system, government service system (e-Gove), and the public complaints system. To find out whether the efforts made by the government are related to the services provided to the community by implementing a smart city system. In this study various measurements of satisfaction levels were carried out to obtain significant conclusions. Of the five aspects studied, namely aspects of government services, aspects of government transparency, aspects of health services, aspects of population service, aspects of transportation services and aspects of water supply and electricity services, in general the people of Denpasar expressed satisfaction with a level of satisfaction of 76,312 and the level of satisfaction with aspects of health services have the highest level of satisfaction that is equal to 88,574.
Keywords: Smart City; service; satisfaction; community
-
I. INTRODUCTION
The concept of a smart city is indeed presented as an answer for efficient management of resources. Support for applications that are constantly evolving and the creation of a creative ecosystem in the field of technology, is a good first step towards a smart city. But in fact smart city not only related to technology. This concept is a combination of new technology with an intelligent mindset about the use of technology in an organization [1].
As a city full of charm, Denpasar City has a panorama of nature, culinary, plus its creative community. But along with the development and population growth, various problems began to emerge, such as the decline in the quality of public services, congestion on the highway, the accumulation of garbage and other social problems. To solve these problems, Denpasar needs a smart, creative and innovative solution run by the ranks of government officials, from leaders to the lowest levels, and supported by the full commitment of all its citizens.
Various attempts were made by the Denpasar City government to overcome various existing problems, as a form of service to the Denpasar City government towards
its people. Starting from building a system to facilitate services to the community such as health care systems, population service systems, government service systems (e-Gove), and public complaints systems [2]. Where this system initially runs marginally at each Local Government Work Unit (SKPD) in Denpasar City. But over time, the Denpasar City government began to integrate the system used to improve the quality of service to its people.
To find out whether the efforts made by the government related to the services provided to the community by implementing a smart city system need to be measured properly. In this study various measurements of satisfaction levels were carried out to obtain significant conclusions [3]. In this study six aspects were examined, namely aspects of government services, aspects of government transparency, aspects of health services, aspects of population services, aspects of transportation services and aspects of water supply services and electricity to measure the level of leadership of the Denpasar City community through the application of smart cities.
Artificial Neural Network (ANN) is a network of a
group of small processing units that are modeled to resemble the human nervous system [4]. The way ANN works is based on the workings of the human brain starting from receiving input, processing the input, giving processing results, and tolerating errors or errors ANN model allows to solve complex problems into smaller elements [5], so that the process of solving problems becomes more efficient [6]. The principle of the ANN model is that a network is built with input associated with a weighing factor [7], then all inputs are added to determine the function of neuron activation (Figure 1).
weights
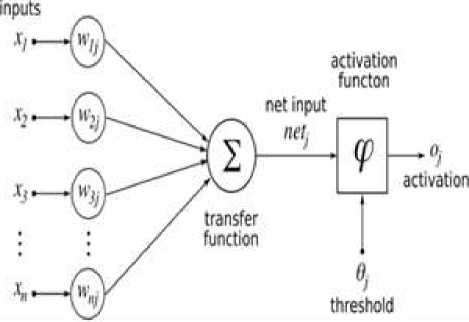
Fig 1. ANN Model
Artificial Neural Network Cascade Forward Backpropagation (ANN-CFB) has a method similar to the Feed Forward Neural Network in using backward propagation algorithms in updating its weight [8], but in CFB each layer is connected to all previous neuron layers [9].
-
II. RESEARCH METHODS
This section describes the design of the logic flow of forecasting system of the level of community satisfaction in Denpasar City using Artificial Neural Network Cascade Forward Backpropagation [10][11], which is represented through a flowchart in Figure 2. The expected result is that the system is able to display the forecast results that are closest to the actual data. The CFB algorithm [12], workflow flowchart can be seen in Figure 3.
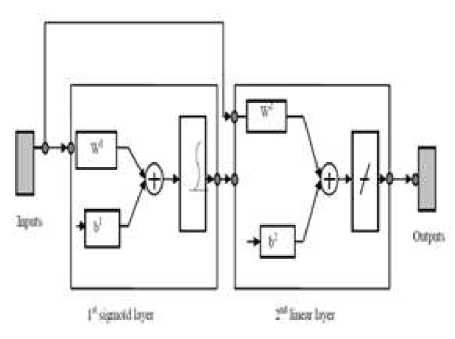
Fig 2. Cascade Forward Backpropagation Model
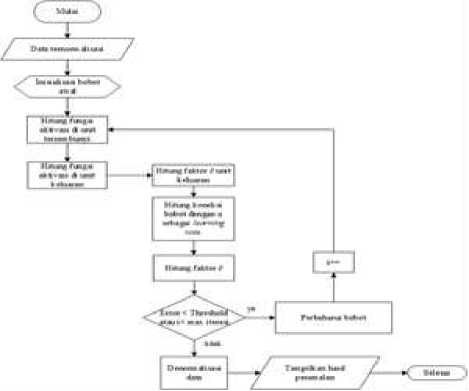
Fig 3. Flowchart of CFB Algorithm
-
III. RESULTS AND DISCUSSION
The conduct of four types of studies in conducting a Denpasar community satisfaction study aims to determine differences in the level of community satisfaction in terms of their gender, age group, level of education, and type of work. From table 1, the level of satisfaction of Denpasar City's men is higher by 5.35, which is 79,394 compared to the female population of 74,044.
In table 1, it can be seen that the level of satisfaction of the Denpasar community as a whole both men and women
TABLE 1
LEVEL OF COMMUNITY SATISFACTION ACCORDING TO GENDER
|
Sex |
Criteria |
Governmen t service |
Government transparency |
Health services |
Population services |
Mobility & transportation |
Clean water & waste |
Level of satisfaction | ||||||
|
Female |
Satisfied |
388 |
71.06 |
385 |
70.51 |
478 |
87.5 |
395 |
72.34 |
364 |
72.90 |
360 |
69.9 |
74.044 |
|
Not Satisfied |
158 |
28.94 |
161 |
29.49 |
68 |
12.5 |
151 |
27.66 |
182 |
33.33 |
186 |
34.07 | ||
|
Male |
Satisfied |
522 |
79.82 |
464 |
77.95 |
586 |
89.6 |
482 |
77.8 |
488 |
74.62 |
442 |
76.58 |
79.394 |
|
Not Satisfied |
132 |
20.18 |
190 |
29.05 |
68 |
10.4 |
172 |
26.3 |
166 |
25.38 |
212 |
32.42 | ||
|
Mean Level of Satisfaction |
1200 |
75.439 |
74.231 |
88.574 |
75.072 |
73.759 |
73.24 |
76.719 | ||||||
have satisfaction levels almost equal to only 5.35 so that the statistics are not significantly different. Likewise, the level of community satisfaction with indicators of government services, government transparency,
population services, mobility and transportation as well as clean water services and waste management cannot be stated significantly differently because it only has a difference of 2,199. The level of satisfaction that is
significantly different from health services in Denpasar clean water and waste handling the level of satisfaction is
City has been very good at 88,574. While based on age 71,044 still lower than the level of satisfaction with
group, the highest level of satisfaction is related to health government services and transparency of 76,363. The data
services with a satisfaction level of 88,222 while for can be seen in table 2.
population services, mobility and transportation as well as
|
TABLE 2 LEVEL OF COMMUNITY SATISFACTION BY AGE | |
|
Sex |
Government Government Health Population Mobility & Clean water Level of Criteria service transparency services services transportation & waste satisfaction |
|
14-19 |
Satisfied 152 76.8 119 73.24 161 84.3 123 70.8 119 70.6 123 70.3 74.338 Not Satisfied 46 23.2 79 26.76 37 15.7 75 79.2 79 29.4 75 29.7 |
|
20-29 |
Satisfied 470 74.8 490 77.83 585 90.4 497 76.82 421 71.13 445 72.71 77.284 Not Satisfied 177 25.2 157 22.17 62 9.58 150 23.18 224 28.87 202 27.29 |
|
30-49 |
Satisfied 253 77.9 225 78.62 296 89.7 240 72.73 239 72.24 215 75.5 77.815 Not Satisfied 77 22.1 105 21.38 34 10.3 90 27.27 92 27.88 115 24.5 |
|
>50 |
Satisfied 19 76.9 16 74.8 23 88.5 21 80.77 19 73.08 20 70.6 77.438 Not Satisfied 7 23.1 8 25.2 3 11.5 5 19.23 7 26.92 6 29.4 |
|
Total |
1200 76.602 76.123 88.222 75.278 71.809 72.279 76.719 |
In terms of education level, it turns out that the level of satisfaction of the Denpasar community is directly proportional to the level of education where the community with elementary / junior high school education level of satisfaction is 74,180, the level of high school education is 76,535 and the community with undergraduate education has a satisfaction level of 79,44.
While the level of satisfaction with smart market indicators is almost similar to the level of satisfaction in terms of age groups, where the highest level of satisfaction in health service indicators is around 87,568 while for government services and transparency
around 76,432 and mobility and transportation and clean water services and waste management are 72,596 as shown in table 3. The interesting thing about the results of this study is that the level of community satisfaction in Denpasar City is directly proportional to the level of education for each smart market indicator studied. Unfortunately, the population of Denpasar City when viewed from table 3 is around 52%, so it is a bit interesting to decrease the percentage of satisfaction level obtained in this study and the percentage of the population with an undergraduate education level of 45%.
TABLE 3
LEVEL OF COMMUNITY SATISFACTION ACCORDING TO EDUCATION
|
Level of Education |
Criteria |
Government service |
Government transparency |
Health services |
Population services |
Mobility & transportation |
Clean water & waste |
Level of satisfaction | ||||||
|
SD/SMP |
Satisfied |
30 |
74.2 |
29 |
73.67 |
38 |
83.8 |
34 |
72.75 |
32 |
70.6 |
31 |
70.08 |
74.18 |
|
Not Satisfied |
16 |
25.8 |
17 |
26.33 |
8 |
16.2 |
12 |
27.25 |
14 |
29.4 |
15 |
29.92 | ||
|
SMA |
Satisfied |
435 |
77.7 |
431 |
76.47 |
542 |
87.7 |
450 |
74.82 |
408 |
71.3 |
416 |
71.2 |
76.535 |
|
Not Satisfied |
183 |
22.3 |
187 |
23.53 |
76 |
12.3 |
168 |
25.18 |
210 |
28.7 |
202 |
28.8 | ||
|
Sarjana |
Satisfied |
395 |
78.8 |
199 |
77.68 |
489 |
91.2 |
198 |
76.5 |
341 |
71.8 |
432 |
80.6 |
79.441 |
|
Not Satisfied |
141 |
21.2 |
137 |
22.32 |
47 |
8.77 |
138 |
23.5 |
195 |
28.2 |
104 |
19.4 | ||
|
Total |
76.923 |
75.940 |
87.568 |
74.690 |
71.233 |
73.959 |
76.719 | |||||||
When viewed from the level of community satisfaction from the point of view of employment, of the 1,200 respondents, the highest level of satisfaction was still in health services at 89,726, followed by a level of satisfaction with population administration services of 77,743 and government services of 76,015. While the level of community satisfaction in the other three indicators is almost the same, which is around 71,327.
It is interesting from this study that the level of community satisfaction with the type of work as army and
police has the highest satisfaction value of 83,333 which is higher than those who become government employees with a satisfaction level of 77,200. This difference becomes significant because it has a difference value of more than 5% that is equal to 5,133, even lower than the level of satisfaction of people who work as entrepreneurs who have a satisfaction level of 78,694. Whereas the people whose types of work as students or housewives and as workers / laborers have the lowest level of satisfaction which is around 72,050 as shown in table 4.
TABLE 4
LEVEL OF COMMUNITY SATISFACTION ACCORDING TO WORK
|
Kind of work |
Criteria |
Government service |
Government transparency |
Health services |
Population services |
Mobility & transportation |
Clean water & waste |
Level of satisfaction | ||||||
|
Laborers |
Satisfied Not Satisfied |
1140 60 |
67.91 32.09 |
1138 62 |
66.84 33.16 |
1180 20 |
89.3 10.7 |
1151 49 |
73.80 26.20 |
1136 64 |
65.78 34.22 |
1137 63 |
66.31 33.69 |
71.658 |
|
Satisfied |
1083 |
72.01 |
1121 |
81.1 |
1174 |
94.3 |
1110 |
80.80 |
1087 |
22.97 |
1096 |
75.12 | ||
|
Entrepreneur |
Not Satisfied |
117 |
27.99 |
79 |
18.9 |
26 |
5.88 |
90 |
21.53 |
113 |
27.03 |
104 |
24.88 |
78.964 |
|
Government employee |
Satisfied |
1147 |
78.80 |
1141 |
76.4 |
1181 |
92.4 |
1152 |
84.38 |
1111 |
64.4 |
1126 |
70.4 |
72.200 |
|
Not Satisfied |
53 |
21.20 |
59 |
23.6 |
19 |
7.6 |
48 |
19.20 |
89 |
35.6 |
74 |
29.6 | ||
|
Satisfied |
1195 |
84.38 |
1193 |
78.13 |
1194 |
87.5 |
1195 |
71.27 |
1193 |
78.13 |
1194 |
87.5 | ||
|
TNI/Polri |
Not Satisfied |
5 |
15.63 |
7 |
21.88 |
6 |
12.5 |
5 |
15.63 |
7 |
21.88 |
6 |
12.5 |
83.333 |
|
Student, college, |
Satisfied |
1095 |
76.97 |
1056 |
68.42 |
1133 |
85.3 |
1069 |
71.27 |
1046 |
60.23 |
1047 |
66.45 |
72.442 |
|
household |
Not Satisfied |
105 |
23.03 |
144 |
31.58 |
67 |
14.7 |
111 |
28.73 |
154 |
33.27 |
153 |
33.55 | |
|
Mean Level of |
1200 |
76.015 |
74.178 |
89.726 |
77.743 |
69.499 |
73.155 |
76.719 | ||||||
|
Satisfaction | ||||||||||||||
In this study using 1,200 respondents scattered in all villages in four sub-districts in Denpasar City, using 6 smart city measuring indicators that were examined in terms of gender, age group, level of education and type of work generally obtained the level of satisfaction of the City community Denpasar against the indicator used is 76,719. By using the Likert method, the level of community satisfaction has been included in the good class group or satisfied with a fourth scale Likert value of 3,888.
-
IV. CONCLUSION
In a study of Denpasar City community satisfaction related to the preparation of Denpasar as a smart city by using the Likert method to explore community satisfaction with eight smart city indicators, 1,200 random respondents were taken representing 27 villages and 16 villages in four sub-districts in Denpasar City. concluded as follows:
-
1. The level of satisfaction of the Denpasar City community on the six smart city indicators, generally can be said to be good or satisfied with a level of satisfaction of 76,719, with the highest level of satisfaction at the level of health services of 88,523.
-
2. The level of satisfaction of the people of Denpasar City in relation to indicators of transportation services and handling of waste is always the lowest in terms of the gender of the community, from the age group, in terms of education level and from the community work profession in Denpasar City. This requires special attention by the Denpasar City Government if it wants to realize Denpasar as a smart city.
REFERENCES
-
[1] Supangkat, S.H. 2015. Pengenalan dan Pengembangan Smart City. Bandung: e-Indonesia Initiatives Institut Teknologi Bandung.
-
[2] Narad, S. and Chavan, P. 2016. Cascade Forward Back-propagation Neural Network Based Group Authentication Using (n, n) Secret Sharing Scheme. Procedia Computer Sci. 78, pp.185 -191.
-
[3] Rukmana, P., Aprilia, V.R., Suhartono, D. and Wongso, R. 2014. Summarizing Text for Indonesian Language by Using Latent Dirichlet Allocation and Genetic Algorithm. Proceeding of the Electrical Engineering Computer Science and Informatics, 1(1), pp.148-153.
-
[4] Krizhevsky, A., Sutskever, I., Hinton, G.E. 2012. Imagenet classification with deep convolutional neural networks. In Advances in neural information processing systems (pp. 10971105).
-
[5] LeCun, Y., Boser, B.E., Denker, J.S., Henderson, D., Howard, R.E., Hubbard, W.E., Jackel, L.D. 1990. Handwritten digit recognition with a back-propagation network. In Advances in neural information processing systems (pp. 396-404).
-
[6] Zhang, Z., 2016. Derivation of Backpropagation in Convolutional Neural Network (CNN). University of Tennessee, Knoxville, TN.
-
[7] Vihikan, W.O., Putra, D., Gede, I.K. and Dharmaadi, I., 2017. Foreign Tourist Arrivals Forecasting Using Recurrent Neural Network Backpropagation through Time. Telkomnika, 15(3).
-
[8] Law, R. And Au, N. 1999. A neural network model to forecast Japanese demand for travel to Hong Kong. Tourism Management, 20(1), pp.89-97.
-
[9] Badde, D.S., Gupta, A.K. and Patki, V.K., 2013. Cascade and feed forward back propagation artificial neural network models for prediction of compressive strength of ready mix concrete. IOSR Journal of Mechanical and Civil Engineering, 3(1), pp.1 -6.
-
[10] Lashkarbolooki, M., Shafipour Z. S., & Hezave A. Z. 2013. Trainable Cascade-Forward Backpropagation Network Modelling of Spearmint Oil Extraction in Packed Bed Using SC-CO2. The Journal of Supercritical Fluids Vol 73: 108 – 115.
-
[11] T engeleng, Siddi & Nzeukou Armand. 2014. Performance ofUsing Cascade Forward Back Propagation Neural Network forEstimating Rain Parameter with Rain Drop Size Distribution. Atmosphere Mdpi Journal Vol 5: 454-472.
-
[12] Guiming, S. & Jidong, S., 2016. Remote Sensing Image EdgeDetection Based on Improved Canny Operator. IEEE 8th International Conference on Communication Software and Networks, pp. 652-65.
Discussion and feedback