Does the Gap Between East and West Still Exist? a Study of Indonesia’s Disparities
on
Udayana Journal of Social Sciences and Humanities, Vol. 3 No. 1, February 2019
DOI: https://doi.org/10.24843/UJoSSH.2019.v03.i01.p01
| 1
Does The Gap Between East and West Still Exist? A Study of Indonesia’s Disparities
Pardomuan Robinson Sihombing
Magister of Statistics Candidate Padjajaran University Bandung-Indonesia robinson@bps.go.id
Abstract Indonesia is a large country with many classical problems. One of the problems still faced by Indonesia is the disparity between Western Indonesia and Eastern Indonesia. Western Indonesia is synonymous with developed and prosperous regions, while East Indonesia is identical to the developing region, the area that left behind. The Indonesian government is implementing various programs to reduce disparities between the two regions. This study aims to map the most striking aspects of the disparity between Western and Eastern Indonesia using discriminant analysis. The variables used are poverty, gini ratio, unemployment, HDI, GEI, GDI, economic growth, sanitation access, and IDI. The results showed that the most distinguishing aspects of the two regions were poverty, unemployment, GDI, and access to sanitation. Thus, it is expected that the policies implemented by the government can prioritize these issues to accelerate equity throughout Indonesia.
Keywords: disparity, developed area, developing area, Indonesia.
JEL Classification: D63, O10, P25
-
I. INTRODUCTION
Indonesia is the largest archipelagic country in the Asia Pacific consisting of more than 17,000 islands. The landscape of the area stretching from Sabang to Merauke has made the government have to work harder to ensure that the distribution of development has been felt by the entire region. However, this is certainly not easy. The breadth of the country's territory was also followed by many socio-economic problems. One of the classic problems faced by Indonesia is disparities among region. At present, there are still dichotomies of Western Indonesia and Eastern Indonesia. Western Indonesia, which consists of Sumatra, Java, and Bali, is synonymous with developed and prosperous regions. The factor of the proximity of the location to the country's capital, which is located on the island of Java, is one of the causes of the region's advance. Almost all indicators show that the quality of socioeconomic factors in this region is better than Eastern Indonesia. Meanwhile, Eastern Indonesia is synonymous with developing regions with high poverty, and a quality of life that is not as high as in Western Indonesia. Eastern Indonesia consists of
Kalimantan, Sulawesi, NTB, NTT, Maluku and Papua. These regions, especially NTT, Maluku and Papua, often experience socio-economic problems. Government programs to reduce this disparity are certainly not arranged recklessly. There are considerations used to determine the priority of problems that will be resolved first. It is expected that the programs created and implemented can be integrated so that they can solve the problem comprehensively. The government's goals not only reduce disparities but also realize inclusive economic growth.
This study tries to formulate indicators that are still a significant differentiating factors between Western Indonesia and Eastern Indonesia. A significant differentiating factors between the two regions is expected to help the government to consider the priority of the program to be implemented. Thus, the disparity between Western Indonesia and Eastern Indonesia can be reduced effectively.
-
II. LITERATURE REVIEW
Disparity is still a big problem in Indonesia. Disparity is related to many things, one of the main things being poverty. Poverty is often the upstream and downstream problem in Indonesia. There is a simple mechanical relationship between changes in headcount poverty, economic growth (higher average income) and changes in the income distribution. Two important conclusions emerge from the discussion so far. First, both economic growth and redistribution can be used to reduce poverty, and should, therefore, be considered as policy alternatives at the outset. Second, economic growth will reduce income poverty unless it is accompanied by a significant worsening of the income distribution (Angelsen & Wunder, 2006). According to data released by BPS, in the first semester of 2018, five provinces with the highest percentage of poor people were in Eastern Indonesia. These eastern provinces of Indonesia, where farmers lead a largely subsistence existence, contain very high rates of rural poverty. In these regions, indigenous communities have been living on the margins of development processes and government (or international) programs. Migration to urban areas is often the only way to find employment and - thus - escape poverty (Indonesia Investments, 2017). Poverty in Eastern Indonesia has been a problem for a long time. In their research, Miranti and Resosudarmo (2005) conclude that in all three measures of poverty (incidence of poverty, poverty gap, and severity of poverty), provincial poverty in the East on average is statistically worse compared with that in the West.
Poverty is almost always related to income inequality. Theoretically, the relationship between poverty and inequality is not always clear and direct, perhaps even the opposite (Beteille, 2003). But based on research by Arsani (2017), in Indonesia poverty and inequality show a positive and mutually influencing relationship. Areas with high poverty tend to have high inequality as well. Populations in the poor category tend to have difficulty obtaining equal access (in many ways) than the population at higher economic levels. This makes the probability of gaining prosperity smaller. Thus, it will encourage inequality. Research conducted by Ginting (2014) shows that the development of inequality between western and eastern Indonesia still occurs.
Furthermore, the existence of poverty and income inequality will lead to the emergence of differences in access to decent jobs so that it will lead to unemployment, both apparent unemployment, and covert unemployment. The absence of work will lead to poverty and inequality. And these problems will be repeating again, so these three things are often identified with the vicious circle of poverty. The importance of job creation accompanied by welfare improvement programs (decent salaries, insurance, pension funds, etc.) is the key to reducing
economic disparity. Without that, job creation will not have an impact on reducing disparity. Mitchell (2002) argued that while a vibrant private sector is essential for a healthy economy, it will never provide enough work for those who want it. Public sector job creation is the only way we will return to full employment and reduce economic inequality. The countries that avoided the high unemployment in the 1970s (like Japan, Switzerland, Austria, Norway) all maintained a sector that acted as an employer of the last resort.
The vicious circle of poverty, income inequality, and unemployment will lead to inequality of access to achieve development outcomes. One indicator is the value of the human development index (HDI). According to the results of a survey conducted by the Statistics Indonesia (2013) shows that the human development disparity in the eastern region in 2013 was 11.11 points, while in the western region only 7.66 points. The range of disparities has been smaller compared to 2011, which was 11.18 points (eastern region) and 8.32 points (western region). From this fact it can be seen that the decline in the range of disparities in the eastern region is slower than the western region. This indicates that human development in the eastern region is relatively stagnant. The lack of infrastructure in Eastern Indonesia makes the achievement of human development in the region relatively slow compared to Western Indonesia. In general, these gaps occur due to achievement in the education sector, namely literacy and the average length of school and achievement in decent living standards as reflected by the average per capita expenditure while the achievements in the health sector are relatively similar between the western and eastern regions.
Although the achievements in the health sector are relatively similar between the western and eastern regions, some previous studies have shown that access to proper sanitation (which is part of healthy life) has not been evenly distributed. The lack of access to proper sanitation will have a serious impact. At present it is estimated that 1.1 billion people in the world do not have access to clean water supplies and 2.6 billion people lack adequate sanitation (UNICEF &WHO, 2004). Every day nearly 1,000 children die because of diseases related to poor water and sanitation quality (UN Environment, 2015). The absence of proper sanitation will also trigger the emergence of various diseases. As a country located in the tropics, Indonesia is a country that is susceptible to various diseases transmitted by mosquitoes. The lack of access to proper sanitation will make mosquitoes breed quickly. Based on the results of basic health research (Riskesdas) organized by the Ministry of Health (2013), malaria prevalence in 2013 was 6.0%. The five provinces with the highest incidence and prevalence were Papua (9.8% and 28.6%), East Nusa Tenggara (6.8% and 23.3%), West Papua (6.7% and
-
19.4%), Central Sulawesi (5.1% and 12.5%), and Maluku (3.8% and 10.7%). Of the 33 provinces in Indonesia, 15 provinces have malaria prevalence above the national figure, most of them in Eastern Indonesia. This fact must be considered to prioritize health programs in Eastern Indonesia to support the acceleration of reducing disparities.
In terms of the economy, equitable development is often identified with high economic growth. Although not always related, economic growth is still the most frequently used indicator. According to Kuznets (1955) there is a positive correlation between economic growth with the inequality of income distribution, the higher the economic growth, also reflected by per capita income, the greater the difference between the poor and the rich, especially in the early stages of development. In Indonesia, several studies show that economic growth is indeed in line with the level of development equality. The result of the study conducted by BPS in 2013 shows that the quality of Indonesia's economic growth has been satisfactory but quite partially, and constantly increasing every year (Badan Pusat Statistik, 2013).
Not only the economic factors, but social inequality also contributes to regional disparities. Gender inequality is one of the biggest social inequality problems. In gender-unequal situations, women often lack access to household income and have less control over household resources. Although the direction of causality is not clear, countries with above-average gender inequality, as a group, have higher extreme poverty rates than countries that are more gender equal (USAID, 2015). There are two measures of gender equality used in Indonesia, namely the Gender Empowerment Index (GEI) and the Gender Development Index (GDI). GEI shows whether women can play an active role in economic and political life; meanwhile, GDI measures achievements using the same dimensions and variables as the HDI, but reveal injustice achievements of men and women. Gender equality is important because it will directly or indirectly affect the overall disparity. From the economic sides, when women are poor, their rights are not protected. They face obstacles that may be extraordinarily difficult to overcome. It results in deprivation in their own lives and losses for the broader society and economy, as women's productivity is well known as one of the greatest generators of economic dynamism (United Nation, 1995). The result of The United Nations Fourth World Conference on Women (1995) point 49 said that: Women contribute to the economy and to combating poverty through both remunerated and unremunerated work at home, in the community and the workplace. The empowerment of women is a critical factor in the eradication of poverty and reduce disparities.
The economic and social factors mentioned earlier certainly cannot be separated from government policies. Government policy is inherent
in the political system adopted by the state. As one of the largest democracies in the world, Indonesia has quite some regulations that apply nationally and locally. Local regulations are often associated with sociocultural systems in a region. These regulations are indicative of the political conditions of the local area. Several works have reported a negative relationship between democracy and inequality using specific historical episodes or cross-national studies. Acemoglu and Robinson (2000) argued this was the case based on the economic history of 19th-century Europe and some 20th-century Latin American examples. Sirowy and Inkeles (1990) and Gradstein and Milanovic (2004) have argued that the crossnational empirical evidence on democracy and inequality is ambiguous and not robust. However, when the economic and social conditions in an area not too stable, the effects of politics and democracy will not touch all levels of society, sometimes even worsen disparities. The study that conducts by Stigler (1970) which states that democracy may transfer political power to the middle class—rather than the poor. Therefore, the political policies taken must be carefully considered so as not to bring a bad impact to equitable development.
-
III. METHODS
Penelitian ini menggunakan sejumlah indikator sosial ekonomi dari 34 provinsi tahun 2017. Seluruh indikator diperoleh dari Badan Pusat Statistik. Sejumlah indikator lain yang dipergunakan sebagai pembanding (misal: data tahun 2010) juga diambil dari sumber yang sama, namun hanya terdiri dari 33 provinsi karena pada periode tersebut, Kalimantan Utara belum dimekarkan dari Kalimantan Timur.
The socio-economic indicators used and their definitions are as follows:
1.
Poverty: the poverty rate is approached by using the percentage of the population below the poverty line. The formula used to calculate the poverty rate (P0) is (Badan Pusat Statistik, 2017):
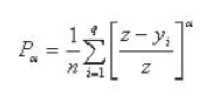
Where:
α = 0
z = poverty line
yi = Average monthly per capita expenditure of population below the poverty line (i=1, 2, 3, ....,
q), yi < z
q = The number of people who are below the poverty line.
n = total population
-
2. Gini Ratio: By definition of BPS, Gini Ratio is a measure of income distribution calculated based on income class. Mathematically, the Gini Ratio is calculated based on the Lorentz
curve approach depicting the proportion of cumulative income by income group and population. The Gini ratio value is derived from the ratio of the diagonal triangle region, which represents the equilibrium, with the area of the Lorentz curve. Gini ratio value ranges from 0-1, value 0 describes the perfect equalization, so the higher the Gini ratio then indicates the higher the economic inequality. Another mathematical approximation that is equivalent to that definition is that the Gini ratio is half of
the absolute relative difference average (Sen,
1977) with the following formula:
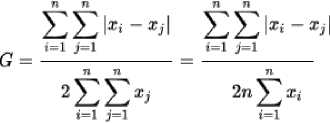
(Eq.3)
-
3. Unemployment: Unemployment is proxied by the unemployment rate. The unemployment rate is the percentage of unemployment to the total labor force. The value of the Unemployment rate is obtained from the BPS website.
-
4. Human Development Index: HDI is a summary measure of average achievement in key dimensions of human development: a long and healthy life, being knowledgeable and have a decent standard of living. The HDI is the geometric mean of normalized indices for each of the three dimensions. (UNDP, 2010)
-
5. Sanitation access: access to enjoying sanitation facilities that meet health requirements, including toilets using goosenecks or clovers with lids, landfills using septic tanks or Waste Water Treatment Systems, and these sanitation facilities are used by own household or together with certain other households
-
6. GRDP: GRDP is represented by economic growth. Economic growth is an increase in market value adjusted for inflation of goods and services produced by an economy over time. Conventionally measured as a percentage rate increase in real gross domestic product, or real GDP, usually in per capita. The calculation of economic growth using the national balance sheet (Bjork, 1999).
The data of economic growth in this research is taken from the BPS website.
The formula used to calculate economic growth is:
Economic Growth =
*100%
GRDPconstt-i
Where:
GRDPconstt = GRDP at year t, at 2010 Constant market prices
GRDPconstt-1 = GRDP at year t-1, at 2010 Constant market prices
-
7. GEI: Gender Empowerment Index shows whether women can play an active role in economic and political life.
-
8. GDI: Gender Development Index measures achievements using the same dimensions and variables as the HDI, but reveal injustice achievements of men and women.
-
9. IDI: Indonesian Democracy Index is an objective and empirical measurement tool for the condition of provincial political democracy in Indonesia (Bappenas & Badan Pusat Statistik, 2013). IDI are classified into three groups:
IDI > 0.8: high
0.8 ≤ IDI ≤ 0.6: medium
IDI < 0.6: low
Furthermore, to find the distinguishing factors between Western Indonesia (developed regions) and Eastern Indonesia (developing regions), discriminant analysis is used. Discriminant analysis is one of the analyzes used in classifying in multivariate analysis techniques. Based on Johnson (2002), This analysis focuses on separating a group of objects into groups that have been defined/preformed.
The discriminant analysis model is a linear combination of independent variables:
= + + +⋯+
(1)
when
Z = discriminant score
b = discriminant coefficient
-
X = independent variables
Before the discriminant analysis is done, the data must fulfill the following assumptions:
-
1. Multivariate Normality Test
The multivariate normality test aims to determine whether the independent variables are the multivariate normal distribution. Tests can be done by testing the significance of kurtosis for each group and overall data.
-
2. Homoscedasticity Test of Variances and Covariances
This test aims to see whether there are similarities in variance between the two populations. In this case, you can use Box's M test.
Then, based on Hair (2010), the discriminant analysis stages are:
-
1. Test the significance of the discriminant function
-
2. Tests the strength of the discriminant function relationship
-
3. Forms the equation of the discriminant function 4. Classify objects by paying attention to cutting score, using the formula
_ n1 Z 1 + n 2 Z 2
cu
nl + n2
(2)
-
5. Calculate the classification accuracy that is formed
. ∙ ri9 ℎt prediction
Accuration = 100%
totai prediction
-
IV. RESULTS
Reporting Research Results
This study uses several variables to determine the main problem which is a differentiating factor in Western Indonesia and Eastern Indonesia.
Table 1. Indicators Description, 2017
|
Indicators |
Eastern Indonesia |
Western Indonesia |
Indone sia |
|
Poverty |
12.63 |
9.27 |
10.95 |
|
Gini Ratio |
0.36 |
0.36 |
0.36 |
|
unemploy |
4.97 |
5.23 |
5.10 |
|
ment | |||
|
HDI |
67.63 |
71.87 |
69.75 |
|
sanitation |
60.74 |
70.77 |
65.75 |
|
GRDP |
5.60 |
4.88 |
5.24 |
|
GEI |
67.67 |
68.33 |
68.00 |
|
GDI |
88.67 |
91.46 |
90.07 |
|
IDI |
72.69 |
74.27 |
73.48 |
In Table 1 it can be seen that there are differences in values for most development variables in Western Indonesia and Eastern Indonesia. However, to find out which variables are the differences between West Indonesia and Eastern Indonesia, the analysis will be continued using discriminant analysis.
There are several assumptions that must be fulfilled to use discriminant analysis. These assumptions consist of normal multivariate assumptions and homogeneity of variance. The testing of these two assumptions can be seen in Table 2 and Table 3.
Table 2. Multivariate-Normality Test's Result
|
Region |
Mardia mKurtosis |
chi2(1) |
Prob>chi2 |
|
Indonesia |
84.54 |
1.096 |
0.2951 |
|
Eastern Indonesia |
74.45 |
0.817 |
0.3661 |
|
Western Indonesia |
73.01 |
1.298 |
0.2545 |
By using the Mardia mKurtosis test, it can be seen that the data used has met normal multivariate assumptions, both for Indonesia and for each region.
Table 3. Homogeneous Test's Result
Test of equality of covariance matrices across 2 samples
Modified LR chi2 = 77.41653
Eox ’(15,3364) = 1.13 Prob > F = 0.1789
Box cħi2∣45) = 54.68 Prob > chi2 = 0,1529
Table 3 shows the result of the homogeneity test of variance. By looking at the Box F and Chi2
values, it can be concluded that the homogeneous assumption of variance has been fulfilled. Thus the test will be continued with discriminant analysis.
By using discriminant analysis, it is obtained
the accuracy of grouping as shown in Table 4 below: Table 4. Classification Results
|
code |
Predicted Group Membership |
Total | |||
|
East ern |
West ern | ||||
|
Origi nal |
Count |
Eastern |
13 |
4 |
17 |
|
Western |
3 |
14 |
17 | ||
|
% |
Eastern |
76.5 |
23.5 |
100.0 | |
|
Western |
17.6 |
82.4 |
100.0 | ||
a. 79,4% of original grouped cases correctly classified.
The discriminant function produced is as follows:
Z- score = 22․04 - 0․036poverty + 10․94GR + 0․13unemployment - 0․368HDI + 0․004sanitation + 0․273GRDP + 0․011GEI -0.152GDI + 0.144IDI
Where the discriminant equation for each region is as follows::
Eastern Indonesia:
Z- score = -684.64 + 3.75poverty + 9.16GR
+ 1.388unemployment
+ 9.708HDI - 1.701sanitation
+ 0.770GRDP - 1.903 GEI
- 9.796GDI + 0.175IDI
Western Indonesia:
Z- score = -723.74 + 3.81poverty - 10.25GR
+ 1.157unemployment
+ 10.36HDI - 1.709sanitation
+ 0.285RDP - 1.924GEI
- 10.067GDI - 0.081IDI
Furthermore, using ANOVA, which variables will be obtained are the distinguishing factors in Western Indonesia and Eastern Indonesia.
Table 5. Univariate ANOVA Summaries
Univariate ANOVA summaries
|
Variable |
Model KS |
Resid NS |
Total MS |
R-aq |
Mj. R-aq |
: |
Pr > Γ |
|
poverty |
96.36523 |
1008.896? |
981.24427 |
0.0872 |
0.0587 |
3.0565 |
0.0900 |
|
giniratio |
.00004944 |
.04795482 |
.04650315 |
0.0010 |
-0.0302 |
03299 |
0.8570 |
|
hdi |
152.97911 |
394.66185 |
381.33813 |
0.2793 |
0.2568 |
12.404 |
0.0013 |
|
sanitation |
854.907 |
5298.2073 |
5163.5619 |
0.1389 |
0.1120 |
5.1634 |
0.0299 |
|
™P |
4.4497058 |
74,342692 |
72.224723 |
0.0565 |
0.0270 |
1.9153 |
0.1760 |
|
gei |
3.7755571 |
1635.9692 |
1586.5038 |
0.0023 |
-0.0289 |
07385 |
0.1316 |
|
gdi |
55,719172 |
323.14432 |
315.34356 |
0.1690 |
0.1430 |
6.503 |
0.0157 |
|
idi |
21.258503 |
863.42933 |
831.91021 |
0.0241 |
-0.0064 |
78935 |
0.3309 |
Number of obs = 34 Model df = 1 Residual df = 32
In table 5, it can be seen that with an error rate of 10 percent, it can be concluded that a significant differentiating factor between Western Indonesia and
Eastern Indonesia is poverty, HDI, access to sanitation, and GDI.
-
V. DISCUSSION
The dichotomy of Western Indonesia and Eastern Indonesia is a classic problem but has not yet been resolved. Western Indonesia is synonymous with Indonesia region developed and prosperous, while Eastern Indonesia more often identified with the poor and developing regions. After the reform era, development in eastern Indonesia began to receive attention, but the results were not satisfactory. Various programs have been implemented by the Indonesian government to reduce inequality in Eastern Indonesia. This study tries to map out any problems that are still lame in Western Indonesia and Eastern Indonesia. Mapping important issues are done to ensure that the programs planned and implemented are on target. By knowing the problems that exist in Eastern Indonesia, the government can scale priorities to accelerate equity throughout Indonesia. Based on the results of the discriminant analysis presented in the previous section, it was found that the variables that make a difference in Western and Eastern Indonesia are poverty, HDI, access to sanitation, and GDI. This significant difference is the result of an inappropriate policy. The disparities that have occurred in Western Indonesia and Eastern Indonesia have been caused in part by centralized policies in the past. Basri and Munandar (2009) argue that an economic system is centralized even though it has been successfully implemented in Singapore, but this is not suitable when applied in Indonesia.
Poverty, as an important indicator of economic aspects, is a striking differentiating factor between Eastern Indonesia and Western Indonesia. Roughly speaking, the average poverty rate in Eastern Indonesia is 12.63 percent. This figure is far greater than the average poverty in Western Indonesia which is only 9.27 percent. Provinces with the highest poverty rates are also found in Eastern Indonesia, namely Papua Province. In Papua, the poverty rate reaches 27.76 percent, which means that 1 in 4 people still live in poverty. It is in line with the results of research conducted by Priasto Aji (2015) that said while most of the poor live on the island of Java, the poverty rate is far higher in Eastern Indonesia. Various policies have been carried out to reduce poverty in Eastern Indonesia. Because poverty is closely related to inequality, efforts to reduce inequality are also intensified. Poverty generally falls with economic growth, but the speed of poverty reduction depends on how equally growth is shared. If the pattern of growth benefits the rich more than the poor, the pace of poverty reduction slows (Aji, 2015). One of the efforts to alleviate poverty in Eastern Indonesia is through infrastructure development. Although it does not have a direct
effect at a glance, infrastructure development will moderate many changes. Improved public infrastructure can make a significant contribution to reducing poverty and closing gaps in income inequality (ADB, 2012). In addition to infrastructure development, the Indonesian government is also focusing on poverty reduction to achieve more inclusive economic growth, especially for the 3T (Terdepan, Tertinggal, Terluar, means: Frontier, Disadvantaged, Outermost) regions, where most are in Eastern Indonesia. It is to reduce the poverty rate from 11.25 percent in 2014 to 6-8 percent in 2019 (Pemerintah Indonesia, 2014).
Another striking difference between West Indonesia and Eastern Indonesia is the Human Development Index (HDI). The average HDI in Western Indonesia is 71.87, much higher than the average HDI in Eastern Indonesia which is only 67.63. For a long time, Papua became the province with the lowest HDI score. In 2017, Papua's HDI score was only 59.09. If described according to its components, education becomes a component that can be prioritized. Education is prioritized because it will indirectly affect the other two components. By reducing the uneducated rate to half of its value, the HDI of eastern provinces will increase by 2.8%, while it will increase the HDI of western provinces by 1.4%. Any change in the rate of uneducated will affect the development of eastern provinces more than it affects their western counterparts (Azzizah, 2015). Many factors cause educational disparities in Western and Eastern Indonesia, one of which is language barriers. According to Azzizah (2015) In schools and universities most textbooks are in Indonesian, but at the tertiary level, especially in highly specialized courses and at the advanced level of study, textbooks in English are also widely used. However, problems may also emerge in terms of the usage of Indonesian for official school textbooks. The disparity in education between the Western and the Eastern parts of Indonesia may occur because of this condition. Moreover, facilities and educators also become a major problem to reach good education in Eastern Indonesia. To face the problem of physical facilities in the school, the government continues to work to renovate schools that were previously untouched by assistance. Meanwhile, to overcome the problem of educators, the government has organized a 3T teacher program. It is hoped that this program can overcome the problem of lack of educators. Although this program is not perfect because the teachers deployed in the 3T area are only temporary, they are expected to improve the quality of education gradually.
Another thing that is quite crucial is the effect of poverty on HDI in Eastern Indonesia. While poverty is still a significant differentiating factor between Western Indonesia and Eastern Indonesia, it turns out that poverty is also related to HDI. Based on (Azzizah, 2015), the poverty rate has a huge
influence on the rate of school enrollment (which is an HDI component), particularly in the eastern provinces. Thus, a simultaneous program is needed to comprehensively address these two problems.
Another problem that is a differentiating factor between West Indonesia and Eastern Indonesia is access to sanitation. Clean water and sanitation are one of the main indicators for achieving more inclusive economic growth. It is also in line with the aim of number 6 of the SDGs. One SDGs target number 6 is proper sanitation and hygiene access for all, and ending open defecation, paying special attention to the needs of women and girls and people in vulnerable situations. Achieving universal sanitation access is very important to accelerate poverty eradication to eliminate the disparity.
Another factor that differentiates between Western Indonesia and Eastern Indonesia is the gender development index. This index reflects equality of access between men and women. The average GDI value in Western Indonesia is 91.46; this value is much higher than the value of the GDI in Eastern Indonesia which is only 88.67, where the lowest value is in the Papua province of 79.38. Based on the results of several previous studies, gender inequality is indeed more common in poorer regions, compared to prosperous regions. Jayachandran (2015) in his paper stated that gender gaps favoring males—in education, health, personal autonomy, and more—are systematically larger in poor countries than in rich countries, and the relationship between development and gender inequality can be explained by the process of development, society-specific factors are also at play. Women in developing countries fare worse relative to men compared to women in developed countries on a variety of measures, ranging from college enrollment to control over one’s life. Gender inequality is experienced differently in many developing countries as compared to developed countries, and various definitions are given from different perspectives that direct policy makers how to address the issues (Batana, 2008). Gender inequality will affect poverty, economic growth, and public welfare. Therefore, eliminating gender inequality might require explicit policy intervention. Moreover, one might not want to wait patiently as the problem of gender inequality resolves itself via economic growth (Jayachandran, 2015). There are many ways that can be taken to reduce gender inequality, including increasing women's participation in employment and parliament, encouraging the use of technology and financial intermediation for women driven by small businesses, and making policies that reduce the risk of death in women.
-
VI. CONCLUSION
By utilizing the latest data, several distinguishing factors are obtained between Western
Indonesia (which is identical to developed regions) and Eastern Indonesia (which is identical to developing regions). The differentiating factor is poverty, access to sanitation, human development index and gender development index. These four factors are worth considering to prioritizing. Replication of this research periodically can be used to see the extent of equality between Western Indonesia and Eastern Indonesia. It is hoped that there will no longer be a significant differentiating factor between Western Indonesia and Eastern Indonesia. Additional indicators can be made to enrich the evaluation of disparities in Western Indonesia and Eastern Indonesia.
REFERENCES
Acemoglu, D., & Robinson, J. A. (2000). Why Did the West Extend the Franchise? Quarterly Journal of Economics, 1167-1199.
ADB. (2012). Asian Development Outlook 2012. Manila: Asian Development Bank.
Aji, P. (2015, October). Summary of Indonesia's Poverty Analysis. ADB Papers on Indonesia.
Angelsen, A., & Wunder, S. (2006). POVERTY AND
INEQUALITY: ECONOMIC GROWTH IS BETTER THAN ITS REPUTATION. In D. Banik, Poverty, Politics and Development: Interdisciplinary
Perspectives. Bergen: Fagbokforlaget.
Arsani, A. M. (2017). Inequality and Poverty Alleviation: Globalization, Access, and Gender. 2nd International Conference on Indonesian Economy and Development (ICIED 2017). Jakarta: Atlantis Press.
Azzizah, Y. (2015). Socio-Economic Factors on Indonesia Education Disparity. International Education Studies, 8 No 12, 218-230.
Badan Pusat Statistik. (2013). Indeks Pembangunan Manusia 2013. Jakarta: Badan Pusat Statistik.
Badan Pusat Statistik. (2013). Analisis Statistik Lintas Sektor: Analisis Pertumbuhan Inklusif 2013. Jakarta: Badan Pusat Statistik.
Badan Pusat Statistik. (2017, April 13). Retrieved from BPS: https://bps.go.id/Subjek/view/id/23#subjekViewTab1|a ccordion-daftar-subjek1
Bappenas & Badan Pusat Statistik. (2013). Indeks Demokrasi Indonesia 2011, Demokrasi Indonesia: Ledakan Tuntutan Politik vs Inersia Politik. Jakarta: Bappenas dan Badan Pusat Statistik.
Basri, F., & Munandar, H. (2009). Lanskap Ekonomi Indonesia: Kajian dan Renungan Terhadap Masalah-masalah Struktural, Transformasi Baru dan Prospek Perekonomian Indonesia. Jakarta: Kencana.
Batana, Y. (2008). Multidimensional Measurement of Poverty in Sub Saharan Africa. Oxford Poverty and Human Development Working Paper(13).
Bjork, G. J. (1999). The Way It Worked and Why It Won’t: Structural Change and the Slowdown of U.S. Economic Growth. London: Praeger.
Ginting, A. M. (2014). Analisis Ketimpangan Pembangunan di Indonesia. Seminar Nasional UT 2014 (pp. 16-35). Jakarta: Universitas Terbuka.
Gradstein, M., & Milanovic, B. (2004). A Survey of the Empirical Evidence on the Links between Political Democracy and Income Inequality. Journal of Economic Surveys, 515-537.
Hair, J., Black, W., Babin, B., & Anderson, R. (2010).
Multivariate Data Analysis. New Jersey: Pearson Inc.
Indonesia Investments. (2017, January 12). Poverty in Indonesia. Retrieved from Indonesia Investments.
Jayachandran, S. (2015). The Roots of Gender Inequality in Developing Countries. Annual Review of Economics, pp. 63-88.
Johnson, R. A. (2002). Applied Multivariate Statistical Analysis 5th Edition. New Jersey: Prentice Hall.
Kementerian Kesehatan. (2013). Riset Kesehatan Dasar 2013. Jakarta: Kementerian Kesehatan.
Kuznets, S. (1955). Economic Growth and Income Inequality. The American Economics Review.
Mbaku, J. M. (1997). Inequality in Income Distribution and Economic Development: Evidence Using Alternative Measures of Development. JOURNAL OF ECONOMIC DEVELOPMENT, Volume 22, Number 2, , 57-67.
Miranti, R., & Resosudarmo, B. (2005). Understanding Regional Poverty in Indonesia: Is Poverty Worse in the East than in the West. Australasian Journal of Regional Studies, 141-154.
Pemerintah Indonesia. (2014). Rencana Pembangunan Jangka Menengah Nasional 2014-2019. Jakarta.
Sen, A. (1977). On Economic Inequality (2nd ed.). Oxford: Oxford University Press.
Sirowy, L., & Inkeles, A. (1990). The Effects of Democracy on Economic Growth and Inequality: A Review. Studies in Comparative International Development, 126-157.
Stigler, G. J. (1970). Director’s Law of public income redistribution. Journal of Law, 1-10.
UN Environment. (2015). United Nations Environment Programme. Retrieved November 30, 2018, from UN Environment: https://www.unenvironment.org/explore-topics/sustainable-development-goals/why-do-sustainable-development-goals-matter/goal-6
UNDP. (2010). Human Development Reports. Retrieved
November 27, 2018, from UNITED NATIONS
DEVELOPMENT PROGRAMME:
http://hdr.undp.org/en/content/human-development-index-hdi
UNICEF &WHO. (2004). Meeting the MDG drinking water and sanitation target: A mid-term assessment of progress. Geneva: UNICEF &WHO.
United Nation. (1995). UN Women: Beijing and it's follow up. Retrieved from UN Women:
http://www.un.org/womenwatch/daw/beijing/platform/ poverty.htm
USAID. (2015, September). Gender and extreme poverty: Getting to Zero. A USAID discussion series.
Discussion and feedback