Impulse Buying Behavior on Modern Retail
on
| 101
Udayana Journal of Social Sciencec and Humanities, Vol. 2 No. 2, Agustus 2018 DOI: https://doi.org/10.24843/UJoSSH.2018.v02.i02.p06
Impulse Buying Behavior on Modern Retail
I Nyoman Nurcaya1, Ni Made Rastini2
-
1,2Faculty of Economics and Business Udayana University Bali – Indonesia
Email: ichangnur@unud.ac.id
Abstract Retail business has a rapid development, especially in Indonesia. It is indicated by the increasing number of traditional retail business which begins to fix itself into a modern retail business or an independent modern retail business. The increased number of modern retail pushes the competition of the business world to the next level, so it requires retail entrepreneurs to optimize their strategy which known as marketing mix retail. Impulse Buying Behavior as a result of the successful strategic marketing mix retail often wished to happen to indicate the existence of the retail business. Similarly, with the modern retail which exists in Denpasar city, who is trying to develop its marketing mix strategy in the hope of impulse buying behavior. This research has a purpose of explaining the influence of Merchandise, Atmospheric outlet and promotion toward Impulse Buying Behavior with positive emotion variable as an Intervening variable on modern retail in Denpasar city. To reach that purpose, 100 (one hundred) respondents are used which selected by purposive sampling with a questionnaire as the method for data gathering. The data is processed with the SEM PLS analysis tool. The result shows that Merchandise variable, Atmospheric outlet, and promotion has a positive influence significantly on Positive emotion. The same with Merchandise variable, Atmospheric outlet and Promotion, and positive Emotion significantly influence the Impulse buying behavior. Positive Emotion variable significantly partially mediates the influence of Merchandise, Atmospheric outlet, and Promotion about Impulse buying behavior.
Keywords: Impulse Buying Behavior, Modern Ritel
-
I. INTRODUCTION
Impulse Buying Behavior is a phenomenon and an expanding tendency of shopping behavior that happens in the market and happens to be an important point that was underpinning the marketing activity [1]. Impulse Buying is also happening to be one of the unique characters that Indonesia’s civilian has. According to the winner of the top brand award in 2009, Indonesia consumers has ten unique characters, which are short-term thinking, unplanned, like to assemble, technology illiterate, context-oriented, prefer abroad’s brand, religious, prestigious, strong in the subculture, and less concerned about the environment [2].
One of the impulsive shopping factors is emotion from the consumers while shopping. Preference [3] shows positive emotion that consumers feel will push them to acquire a product immediately without any planning at first and on the other hand, negative emotion can push consumers to not do impulsive shopping.
Reference [4] says that the retail marketing mix consists of location, Merchandise, pricing, advertisement and promotion, the atmosphere in an outlet, and retail service. The retail company must ensure the position of its company is according to the customer’s expectation. Some important aspect that must be measured to know the power of retail, for example, the store location, store layout, diversity and product management, pricing strategy, a promotion that able to attract consumers, a service that
provided to strengthen and launch an identical marketing strategy.
Reference [5] says that Atmospheric outlet positively and significantly able to push them to do unplanned shopping. The atmospheric outlet from a place or a restaurant is an important factor that will affect all of the experience that obtained from that current place [6].
Unplanned buying (Impulse Buying) is a kind of purchase that was not planned by the consumer before, where this situation is purposely created by the retail entrepreneur, as their effort to survive in the industry. Some modern retail in Denpasar cities like Tiara Dewata, Matahari Duta Plaza, Ramayana, and other modern retail always optimize the occurrence of Impulse Buying with Merchandise, Atmospheric outlet arrangement, promotion, and other strategies.
Based on the background, the issues in this research are how the influence of Merchandise variable, Atmospheric outlet, Promotion against Positive emotion and Impulse buying behavior, as well as how the roles of positive emotion to mediate the influence of variables for Merchandise management, Atmospheric outlet, and Promotion about Impulse buying behavior.^
The purpose of this research is to know how is the influence of Merchandise variable, Atmospheric outlet, Promotion against Positive Emotion and Impulse buying behavior. Another purpose is to know the role of Positive emotion in mediate the influence of Merchandise variable,
Atmospheric outlet, and promotions against Impulse buying behavior.
-
II. THEORETICAL BASIS
-
2.1 Impulse Buying
-
Impulse Buying is an unplanned buying, is a behavior of buying that conducted in the store, where the buyer is different from what has been planned before[7]. The unplanned purchase is an act of purchasing without any planning before, buying decision is done while the consumer is inside the store. Impulsive buying happens when consumers suddenly feel a strong feeling to buy immediately [14].
-
2.2 Merchandise
Retailers activity include trading that sells product and direct service to the consumers. Merchandise is the products that retail sell toward the consumer in store, meanwhile merchandising can be interpreted as an effort of procurement and handling of goods [5]. Merchandising is an activity of goods’s procurement that compatible with the type of business that the store has (food type product, clothing, household needs, general product, etcetera, or combination) to serve in store with a compatible quantity, time, and price in order to reach the goal and store or retail company. Whereas according to American Marketing Asociation (quoted from Davidson ,1988) define Merchandising as “The ways in providing the right Merchandise, at the right price level, in the right amount, in the right place and in the right time” this definition later on known as The 5 Right of merchandising [5].
-
2.3 Atmospheric outlet
Store design is one of the important strategies in retail business. The atmosphere that has been designed will make customers feel comfortable to be in the store. The outlet’s looks will define the outlet into the customer’s mind. Outlet's design that will produce comfort and attractiveness for every customer's visit. Reference [8] shows atmosphere within an outlet is: Atmospheric refers to the design of an environment via visual communications, lighting, colors, music, and scent to stimulate customers perceptual and emotional responses and ultimately to affect their purchase Behavior. Store Atmosphere that “Atmosphere refers to the store’s physical characteristics that are used to develop an image and draw customers”[5]. The most fundamental thing in store design is “basically; store design aims to fulfill functional requirements while serving a fun shopping experience, so it supports the transaction."
-
2.4 Promotion
Retail business related to the marketing of goods (or services) that needed by the community, either it’s individual or households. It is necessary for every business ventures and executes the marketing process is to inform the existence of our business to the community and
potential costumers. Discussion about the crowd means talking about
Their minds and emotion. Reference [9] says modern marketing needs more than to develop a good product, determine an interesting price, and make them reachable. The company must also communicate with interested parties now and the future, and the general community. The promotion will be an activity to inform our business to the community. Reference [5] says promotion or one-way persuasion is made to lead someone or organization to an act that creates a trade in the market.
-
2.5 Positive Emotion
Someone can position certain emotions, such as happiness, anger, joy, and sadness. For example, if someone feels very unhappy and compelled, then that person is not feeling happy. On the other hand, if someone feels very happy and pretty passive, then that person probably is happy. Psychologicthe al approach put its view towards human's behavior that human's behavior is influenced by the environment.
Reference [10] show "Emotion is reaction assessment (positive or negative) of a complex nervous system of a person towards external or internal stimuli and often conceptualized as a general dimension, such as the positive and negative influences." It means that Emotion is an assessment reaction (positive or negative) from a human's neural system toward external or internal stimulus and often conceptualized as a general dimension, such as things that have positive or negative influence.
-
III. RESEARCH CONCEPT FRAMEWORK
Based on the conceptual framework that explains the linkages of each variable, then a conceptual framework is arranged as in the images of Figure 1.
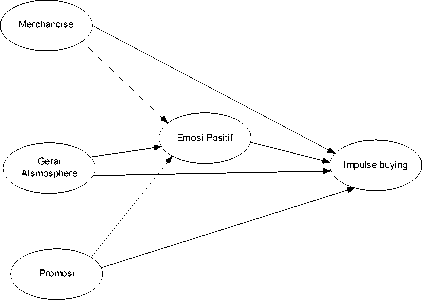
Figure 1. Research Concept Framework
-
3.1 Research Hypothesis:
Based on the conceptual framework, then the hypothesis can be arranged as follows.
-
a) Merchandise has a positive and a significant influence to Positive emotion.
-
b) Merchandise has a positive and a significant influence Impulse Buying.
-
c) The gerai atmosphere has a positive and significant influence on Positive emotion.
-
d) Gerai Atmosphere has a positive and a significant influence Impulse Buying.
-
e) Promosi has a positive and significant influence to Positive emotion.
-
f) The higher the promotion then, the higher the Impulse Buying decision.
-
g) The higher Positive emotion then, the higher the Impulse Buying decision.
-
3.2 Research Methodology
Based from the characteristic of the problem, the type of this research is associative research which aims to explain the influence of Merchandise variable, Atmospheric outlet and promotion against Impulse Buying with positive emotion as the Intervening variable.
This research is done in some retails in Denpasar city, considering Denpasar city as the central government and business which make the mobility of its citizen higher, for example when using modern retail as a place to fulfill needs. It can be used as a barometer for strategy’s reference of the same industry in different places.
The population of the research is all citizens who have been purchasing needs spontaneously(unplanned) in modern retail in Denpasar city. The quantity of sample that defined for this research is 95 respondents with the consideration that the size of the sample is five times from the number of indicators that available (5 x 19 = 95 respondents). Sampling technique in this research is a nonprobability sampling technique, which is a sampling technique that doesn't give the same opportunities or chance for every element or the member of the population to be chosen as sample. Sampling technique in question is a Purposive Sampling, which is a sampling technique with certain criteria. The sample criteria are the sample has been shopping in one of the retails in Denpasar, and has done Impulse Buying.
Variable measurement in this research uses a Likert scale. This scale is used to measure attitude, opinion, and response somebody toward an activity. In this closed-question questionnaire use the Likert scale between 1 to 5, where 1 represents a measurement of strong disagreement, 2 represent a disagreement, 3 represent a neutral statement, 4 represent an agreement, 5 represent a strong agreement.
Data collection technique is done in 2 ways, by questionnaire, which is a question list that addressed to respondents related to research's indicators.
-
3.3 Research Instrument Test
A valid instrument is an instrument that can be used to measure things that must be measured. This research use questionnaire as a research instrument, the validity, and reliability test is needed so that the questionnaire is feasible to use as a source.^
Validity is a measurement that indicates the status of the instrument whether it's valid or not. Validity testing refers to how far an instrument can run its function that can be used to measure what it wants to measure [11]. Validity test can be done with Pearson Correlation analysis, by seeing the correlation value of indicators toward the total score, with the formula:
N(∑XY) - (∑X∑Y)
r = y∣Uj∑χ^7∑χj2^^
(1)
Keterangan:
R = correlation coefficient^
N = quantity of sample^
X = value per question
Y = total score for every question^
Sugiyono (2013) says that question items that have the positive correlation with total score and high correlation prove that the questions item has high validity, with minimum requirements the value of r ≥ 0,3 if ≤ 0,3 it can be said that questions item is not valid.
Instrument reality is measured with the value of α Cronbach. Reference [12] says that a variable instrument is defined reliably if the value of α Cronbach > 0,6.
-
3.4 Data Analysis Method
Data analysis technique that used is Partial Least Square / PLS [ 13]. PLS is a method that has a unique advantage to use on any data scale, no need for many assumptions and the size of the data sample is not supposed to be big, distribution-free where the indicators stay between 3 to 7, other than that PLS can be used to confirm theories(Hypothesis) and build relations that there is no theoretical basis yet to test the proposition.
-
IV. RESULT AND EXPLANATION
-
4.1 Validity Test
-
An instrument that used in research must pass the validity test, which is a test to measure the power of an instrument to measure what it should measures. An instrument is defined as valid if it has a correlation coefficient between items with a total score within the instrument is bigger than 0,300 with error rate Alpha 0,05. The result of the analysis shows that each indicator already have a correlation value (r) above 0,3 so the instrument can be declared as valid.
-
4.2 Reliability Test
An instrument that used in research must pass the validity test. Reliability test toward the instruments in this research use Alpha Crobach value, to know unidimensionality of question items against the latent variable. Alpha Cronbach value declared as reliable if the value is bigger and equal to 0,60 (Ghozali, 2004). The recapitulations of research's instrument reliable test can be seen in Table 1.
|
TABLE 1 THE RECAPITULATION OF RESEARCH'S INSTRUMENT^ | |||
|
No |
Variables |
Alpha |
Keterangan |
|
1 |
Merchandise |
0,914 |
Reliable |
|
2 |
Atmospheric outlet |
0,901 |
Reliable |
|
3 |
Promotion |
0,860 |
Reliable |
|
4 |
Positive Emotion |
0,900 |
Reliable |
|
5 |
Impulse Buying Behaviour |
0,916 |
Reliable |
|
Source: Processed Data | |||
Table 1 shows that the value of Cronbach’s Alpha for every variable is bigger than 0,60. Therefore it can be concluded that the instruments have fulfilled the requirements for reliability requirements.
-
4.3 PLS Analysis
-
a. Rating outer model or measurement model
Model validity must be discussed first before talking about direct influence's significance for each exogenous variable against the endogenous variable. Rating outer model or measurement model uses three criteria in the implements of data analysis technique with SmartPLS, which are convergent validity, discriminant validity dan average variance extracted (AVE), and composite reliability (Ghozali, 2008). The use of analysis data technique by using Smart PLS, the outer model is rated by seeing the convergent validity (the size of the loading factor for each construct). This search uses a minimum limit of loading factor, which is 0,5.
|
TABLE 2 OUTER LOADINGS | |||||
|
Positive Emotio n |
Atmospher e Outlet |
Impulse Buying |
Merchandis e |
Promotio n | |
|
x1.1 |
0,837 | ||||
|
x1.2 |
0,837 | ||||
|
x1.3 |
0,887 | ||||
|
x1.4 |
0,838 | ||||
|
x2.1 |
0,777 | ||||
|
x2.2 |
0,856 | ||||
|
x2.3 |
0,854 | ||||
|
x2.4 |
0,781 | ||||
|
x3.1 |
0,830 | ||||
|
x3.2 |
0,822 | |
|
x3.3 |
0,872 | |
|
y1.1 0,839 | ||
|
y1.2 0,882 | ||
|
y1.3 0,875 | ||
|
y1.4 0,878 | ||
|
y2.1 |
0,853 | |
|
y2.2 |
0,841 | |
|
y2.3 |
0,869 | |
|
y2.4 |
0,884 | |
|
Source: Processed Data | ||
The result of convergent validity as showed in Table 2 seems that the value of the outer model has passed the convergent validity criteria, where all indicators have a loading factor above 0,50. Then it can be concluded that the construct has a good convergent validity value.
-
b. Discriminant validity
Crossloading is used to measure Discriminant validity from the measurement model with the reflective indicator (factor). If correlation construct with the measurement items is bigger than the other construct size, then it shows that the latent indicators precisely predicts the size of the following construct than the other constructs.
TABLE 3
CROSS LOADINGS
|
Positive Emotio n |
Atmospher e Outlet |
Impulse Buying |
Merchandis e |
Promotio n | |
|
x1.1 |
0,572 |
0,428 |
0,642 |
0,837 |
0,596 |
|
x1.2 |
0,562 |
0,437 |
0,651 |
0,837 |
0,662 |
|
x1.3 |
0,653 |
0,477 |
0,691 |
0,887 |
0,627 |
|
x1.4 |
0,631 |
0,528 |
0,689 |
0,838 |
0,591 |
|
x2.1 |
0,500 |
0,777 |
0,558 |
0,452 |
0,473 |
|
x2.2 |
0,522 |
0,856 |
0,600 |
0,425 |
0,412 |
|
x2.3 |
0,552 |
0,854 |
0,660 |
0,463 |
0,501 |
|
x2.4 |
0,485 |
0,781 |
0,533 |
0,468 |
0,550 |
|
x3.1 |
0,592 |
0,489 |
0,667 |
0,638 |
0,830 |
|
x3.2 |
0,561 |
0,488 |
0,650 |
0,609 |
0,822 |
|
x3.3 |
0,624 |
0,512 |
0,686 |
0,591 |
0,872 |
|
y1.1 |
0,839 |
0,517 |
0,625 |
0,591 |
0,639 |
|
y1.2 |
0,882 |
0,629 |
0,740 |
0,627 |
0,629 |
|
y1.3 |
0,875 |
0,498 |
0,695 |
0,648 |
0,612 |
|
y1.4 |
0,878 |
0,540 |
0,708 |
0,610 |
0,570 |
|
y2.1 |
0,692 |
0,555 |
0,853 |
0,633 |
0,644 |
|
y2.2 |
0,681 |
0,645 |
0,841 |
0,649 |
0,651 |
|
y2.3 |
0,699 |
0,671 |
0,869 |
0,751 |
0,729 |
|
y2.4 |
0,678 |
0,609 |
0,884 |
0,674 |
0,706 |
Source: Processed Data
Data on Table 3 explain that the value of cross loading indicates the existence of a good discriminant validity. It can be seen from the indicator correlation value against the construct (loading factor) is higher on the representated construct than the following indicator correlation value tersebut with other construct.
-
c. Evaluating reliability
According to Ghozali (2008:40) says that reliability of a construct can be valued from composite reliability that works to measure internal consistency internal consistency where the value must be above 0,60 and compares the root of AVE with the correlation between construct with the value must be above 0,50^
TABLE 4
COMPOSITE RELIABILITY
|
Construct |
Composite Reliability |
|
Positive Emotion |
0,925 |
|
Atmospheric outlet |
0,890 |
|
Impulse Buying |
0,920 |
|
Merchandise |
0,912 |
|
Promotion |
0,879 |
Source: Processed Data
Table 4 shows that the value of composite reliability from all construct is above 0,60 then it can be said that it’s already passed the reliable criteria. Other ways to test reliability is to compare the root value of Average Variance Extracted (AVE) for every construct with the correlation between one construct to another construct.
TABLE 5
VALUE OF AVE
|
Construct |
AVE |
Roots Value of AVE |
|
Positive Emotion |
0.755 |
0.869 |
|
Atmospheric outlet |
0.669 |
0.818 |
|
Impulse Buying |
0.743 |
0.862 |
|
Merchandise |
0.722 |
0.850 |
|
Promotion |
0.709 |
0.842 |
Source: Processed Data
Roots of AVE in Table 5 will be compared with the correlation value between independent variables as shown in Table 6^
TABLE 6
CORRELATION BETWEEN LATENT VARIABLES
|
Positive Atmosphere |
Impulse Buying |
Merchandise |
Promotion | ||
|
Emotion |
Outlet | ||||
|
Positive Emotion |
1,000 | ||||
|
Atmospheric outlet |
0,630 |
1,000 | |||
|
Impulse |
0,798 |
0,721 |
1,000 | ||
|
Buying Merchandise |
0,713 |
0,551 |
0,787 |
1,000 | |
|
Promotion |
0,705 |
0,590 |
0,793 |
0,727 |
1,000 |
|
Source: Processed Data | |||||
|
Table |
6 indicates |
that the |
roots of |
AVE for |
every |
construct is far greater than the following construct correlation value than another construct. The biggest correlation coefficient is 0,798 which already greater than the smallest AVE root 0,818. Therefore, it can be said that the variable is already reliable.
-
d. Structural Model Test (inner model)
Inner model is a relation between constructs based on substantive theory. On the rating model with PLS, it started by seeing the R-squares for every latent dependent variable. The test’s value of inner model can see the relation between construct by comparing the significance value and R-square from research model (Ghozali, 2008:42)
TABLE 7 R-SQUARE VALUE
|
Construct |
R Square |
|
Positive Emotion |
0,625 |
|
Atmospheric outlet | |
|
Impulse Buying |
0,812 |
|
Merchandise | |
|
Promotion |
Source: Processed Data
The value of R-square Positive Emotion variable is 0,625 on Table 7 can be interpreted that 62,50% variability of Positive Emotion constructs explained by Merchandise variable, Atmospheric outlet and Promotion, meanwhile 37,50% is explained by variable outside the model. So on with Impulse Buying variable with the value of R Square woth as 0,812 means that 81,20% of the variability is explained by Merchandise, Atmospheric outlet, Promotion, and Positive Emotions meanwhile 18,80% is explained by the variable that stays outside the model.
Relations between construct in this research is provided in Figure 2
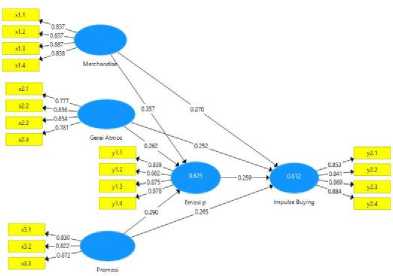
Source: Attached to Processed Data^ Figure 2. Diagram of Hypothesis Test Results
Figure 2 indicates that the following structural model is called reflexive where covariance measurement's indicator is influenced by latent construct or reflects a variation of unidimensional construct that symbolized with elips followed with some arrows from construct to indicator. This model hypothesizes that a change from latent construct will affect the indicator change.
-
e. Hypothesis Test
Hypothesis test about the path of coefficient or the influence of Merchandise, Atmospheric outlet and Promotion against Positive Emotion and Impulse buying is served on Table 8
|
TABLE 8 RESULT FOR INNER LOADINGS | |||||
|
Original Sample (O) |
Sample Mean (M) |
Standard Deviation (STDEV) |
T Statistics (|O/STERR|) |
P Value | |
|
Positive Emotion-> Impulse Buying |
0,259 |
0,255 |
0,074 |
3,510 |
0,000 |
|
Atmospheric outlet -> Emosi Positif |
0,262 |
0,263 |
0,083 |
3,148 |
0,002 |
|
Atmospheric outlet-> Impulse Buying |
0,252 |
0,256 |
0,068 |
3,728 |
0,000 |
|
Merchandise -> Positive Emotion |
0,357 |
0,355 |
0,092 |
3,868 |
0,000 |
|
Merchandise -> Impulse Buying |
0,270 |
0,267 |
0,075 |
3,594 |
0,000 |
|
Promotion -> Positive Emotion |
0,290 |
0,294 |
0,099 |
2,928 |
0,004 |
|
Promotion -> Impulse Buying |
0,265 |
0,267 |
0,074 |
3,578 |
0,000 |
Source: Proccessed Data
Hypothesis test in the PLS method is executed by using simulation against every relation that hypothesized, which in this case bootstrap method is done toward the sample.
The bootstrap method is also used to minimalize unnormal data problem that had been used for the research. Table 8 shows that every direct influence of every independent variable against the dependent variable indicates a significant influence because all the value of P-Value is below 0,05.
-
f. Hypothesis Test, The influence of Merchandise against
Positive Emotion
Hypothesis test shows that the influence of Merchandise against Positive Emotion shows the path coefficient value is 0,357 with the value of t-statistic is 3,868 and P-Value is 0,000. P-Value of 0,000 is smaller than 0,05 indicates that there is a significant influence of Merchandise variable against Positive Emotion. The coefficient's path shows that Merchandise gives positive influence toward Positive Emotion, which means the better the Merchandise, the better the Positive Emotion. It means that the Hypothesis is accepted.
-
g. Hypothesis Test, The Influence of Atmospheric Outlet
Against Positive Emotion
Hypothesis test shows that the influence of Atmospheric outlet against Positive Emotion shows the path coefficient value is 0,62 with the value of t-statistic is 3,148 and P-Value is 0,002. P-Value of 0,002 is smaller than 0,05 indicates that there is a significant influence of Atmospheric outlet variable against Positive Emotion. The coefficient’s path shows that Atmospheric outlet gives a positive influence toward Positive Emotion, which means the better the Atmospheric outlet, the better the Positive Emotion. It means that the Hypothesis is accepted.
-
h. Hypothesis Test, The Influence of Promotion Against
Positive Emotion^
The result of the hypothesis test shows that the influence of Promotion against Positive Emotion indicates coefficient path value of 0,290 with the value of t-statistic of 2,98 and P-Value of 0,004. With P-Value of 0,004 is smaller than 0,05 shows that there is a significant influence of Promotion against Positive Emotion. The coefficient's path shows that Promotion gives a positive influence toward Positive Emotion, which means the better the Promotion, the stronger the Positive Emotion. It means that the Hypothesis is accepted
-
i. Hypothesis Test, The Influence of Merchandise Against
Impulse Buying
Hypothesis test shows that the influence of Merchandise against Impulse Buying shows the path coefficient value is 0,720 with the value of t-statistic is 3,594 and P-Value is 0,000. P-Value of 0,000 is smaller than 0,05 indicates that there is a significant influence of Merchandise variable against Impulse Buying. The coefficient's path shows that Merchandise gives positive influence toward Impulse Buying, which means the better the Merchandise, the higher
the Impulse buying. It means that the Hypothesis is accepted.
-
j. Hypothesis Test, The Influence of Atmospheric Outlet
Against Impulse Buying
Hypothesis test shows that the influence of Atmospheric outlet against Impulse Buying shows the path coefficient value is 0,252 with the value of t-statistic is 3,728 and P-Value is 0,000. P-Value of 0,000 is smaller than 0,05 indicates that there is a significant influence of Atmospheric outlet variable against Impulse Buying. The coefficient's path shows that Merchandise gives positive influence toward Impulse Buying, which means the better the Atmospheric outlet, the higher the Impulse buying. It means that the Hypothesis is accepted.
-
k. Hypothesis Test, The Influence of Promotion Against
Impulse Buying
Hypothesis test shows that the influence of Promotion against Impulse Buying shows the path coefficient value is 0,265 with the value of t-statistic is 3,578 and P-Value is 0,000. P-Value of 0,000 is smaller than 0,05 indicates that there is a significant influence of Promotion variable against Impulse Buying. The coefficient’s path shows that Promotion gives a positive influence toward Impulse Buying, which means the better the Promotion, the higher the Impulse buying. It means that the Hypothesis is accepted.
-
l. Hypothesis Test, The influence of Positive Emotions
Against Impulse Buying
Hypothesis test shows that the influence of Positive Emotion against Impulse Buying shows the path coefficient value is 0,259 with the value of t-statistic is 3,510 and P-Value is 0,000. P-Value of 0,000 is smaller than 0,05 indicates that there is a significant influence of Positive Emotion variable against Impulse Buying. The coefficient’s path shows that Positive Emotion gives positive influence toward Impulse Buying, which means the higher the Positive Emotion, the higher the Impulse buying. It means that the Hypothesis is accepted.
-
V. CONCLUSION AND RECOMMENDATIONS
The result shows that Merchandise variable, Atmospheric outlet, and promotion has a positive influence significantly on Positive emotion. The same with Merchandise variable, Atmospheric outlet and Promotion, and positive Emotion significantly influence the Impulse buying behavior. Positive Emotion variable significantly partially mediate the influence of Merchandise, Atmospheric outlet, and Promotion about Impulse buying behavior^
To increase the number of impulse buying, then the retail’s entrepreneurs in Denpasar should increase their activity on managing Merchandise, Atmospheric Outlet, and the promotion. In Merchandise cases, Retail should add the number of products that they offer. To increase
comfortness, the temperature of the room should be improved. Promotion by using coupon should be improved.
REFERENCES
[ 1 ] Herabadi, A. G. 2003. Perbedaan individual dalam kecenderungan belanja impulsif: Sarat Emosi dan Pendek Pikir (Individual Impulse Buying Tendency:Emotion-laden and Thoughtless). Jurnal Psikologi (12), 58-70
[ 2 ] Sari, D. A. T. dan Suryani, A. 2014. Pengaruh
Merchandising, Promosi dan Atmosfir Toko Terhadap Impulse Buying Studi Kasus di Tiara Dewata SupermarketDenpasar. E-Jurnal Manajemen Universitas Udayana, 3(4), h: 851-867
[ 3 ] Shiv, B. and A. Fedorikhin. 1999. "Heart and Mind
in Conflict: The Interplay of Affect and Cognition in Consumer Decision making," Journal of Consumer Research, Vol. 26, pp. 278-292^
[ 4 ] Ma’ruf, H. 2006. Pemasaran Ritel. Jakarta:
PT.Gramedia Pustaka Utama
[ 5 ] Samuel, Hatane. 2005. “Respon Lingkungan
Belanja Sebagai Stimulus Pembelian Tidak Terencana pada Toko Serba Ada (Toserba).” Jurnal Manajemen &Kewirausahaan, Vol.7, No. 2, h. 152-170
[ 6 ] Sulek, J. W., & Hensley, R. L. 2004. The Relative
Importance of Food, Atmosphere, and fairness of wait. Cornell Hotel and Restaurant Administration Quarterly, 45 (3), 235-247. ^
[ 7 ] Sharma, P., Sivakumaran, B., and Marshall, R.
2010. Impulse Buying and Variety Seeking: A Trait Correlates Perspective. Journal of Business Research, 63(2), pp: 276-283.
[ 8 ] Levy, M. and Weitz, A. B. 2004. Retailing Management Edisi 5. New York: McGraw-Hill, Irwin.^
[ 9 ] Kotler, P. dan Keller, K. L. 2007. Manajemen Pemasaran, Edisi 13 Jilid 1 dan Jakarta: PT Index.
[ 10 ] Solomon, M.R. & Rabolt, N. 2009. Consumer Behavior in Fashion, 2nd Edition.USA: Prentice Hall
[ 11 ] Sugiyono. 2004. Metode Penelitian Bisnis. Bandung: Alfabeta
[ 12 ] Ferdinand, A. 2002. Structural Equation Modeling Dalam Penelitian Manajemen. Semarang: BP UNDIP
[ 13 ] Solimun, 2002. Structural Equation Modeling (SEM) Lisrel dan Amos: Aplikasi di Manajemen, Ekonomi Pembangunan, Psikologi Sosial, Kedokteran dan Agrokompleks. Edisi I. Penerbit Universitas Negeri Malang.
[ 14] Hausman, A. (2000). A multi-method investigation of consumer motivations in Impulse Buying Behavior. Journal of Consumer Marketing,
Vol. 17 No. 15, pp. 403-19
Discussion and feedback