The Impact of Direct Expenditures of Diving Tourism Towards The Economy of Coastal Balinese
on
157
The Impact of Direct Expenditures of Diving Tourism towards the Economy of Coastal Balinese
I Wayan Suardana1, Saroyeni Piartrini2, and Ni Made Ariani3 1Tourism and Travel Industry, Faculty of Tourism, Badung Bali Email: suar.dana@yahoo.co.id, and suardana_ipw@unud.ac.id Telp/Fax: (0361) 223798 2Accounting Major, Faculty of Economics, Badung Bali 3D4 (Diploma) Tourism, Faculty of Tourism, Badung Bali
ABSTRACT
This research illustrates the extent of correlation between the local economy and marine ecosystem services. Apart from being recreational destinations oriented to the economy, Tulamben and Pemuteran are places where coral reefs ecosystem grows and develops. Hence, it needs to be properly conserved. This study found the estimated number of tourists who dive and snorkel in these two areas, it reaches 297.752 per year, with actual annual expenditures amount to US$ 283.2 million. The economic impact of the whole diving tourism in Tulamben and Pemuteran approximately ranges from US$ 396.4 million to US$ 1.059.7 million per year. The high economic value achieved by the government and the local communities as a whole indicates a significant increase of diving activities in both areas. This result suggests that local economy and marine ecosystem services are closely related. However, tourism and the perception aroused about the environmental issues and values not only provide opportunities for macro business improvement but also pose a threat to the sustainability of the underwater ecosystem.
Keywords: direct expenditures, ecosystem services, diving
Tourism is one of the many development activities with promising remarkable progress. Concerns about poverty issue in tourism destinations catch the attention of scholars, tourism bodies, and tourists. Some of the steps taken to alleviate poverty are generally those involving the local people residing in the tourist areas in a sort of program designed to extenuate their circumstances. During the moment of rapid tourism development, a gap often emerges between the local community and the tourism industry, in which the development process does not have a direct impact on the former party. Instead, marine environmental degradation often gets worse. In Bali, water activities such as snorkeling and diving are the most common tourism attractions stimulating the local economy (Suardana, 2015). In this research, the relationship between existing tourism economy and the recreational capacity of the marine ecosystem in Bali is discussed.
Communities of coastal areas have in various degrees adapted themselves to the tourism development by providing services with the intention of securing an income that is hoped to change their economic situation. These communities grow and develop by establishing and maintaining various tourism businesses offering accommodation, diving services, and tour guides. This research studies the value of this particular ecosystem tourism in the local economy in Tulamben and Pemuteran, and considers possible impacts of marine environmental degradation on economic activities should it occurs. By identifying individual expenditures on ecosystem services (based on direct expenditure analysis), a monetary matrix is used to illustrate direct expenditures by tourists who chose Bali as their destination to enjoy diving or other recreational activities. A similar study was conducted by Naipinit and Triracharya (2010) in Thailand. In tourism management and modernization, the role of local people is highly crucial especially their involvement in enlivening tourism attractions and their indigenous coastal life. The study is in line with the findings of Amir and Jiddawi (2007, 551-558) indicating that tourism development in Kizimkazi was a success due to the dolphin conservation and local community roles. Economics multiplier is uniquely specific in each location, so tourism multiplier that has been specially employed for Bali is applied in this study. Toh et al. (2004) use input-output approach to calculate tourism multiplier, while Antara (1999) used Social Accounting Matrices (SAM). According to Toh, et al. (2004) multiplier had a smaller value which was 1,4. Antara (1999) argued that the majority of multiplier effect considered the effect of production expenditures (with multiplier at the value of 2,203), while the rest took into account the other multiplier effects such as labor, capital, and institutional.
Ecosystem services have been acknowledged as an important part of economic development. There has been a growing number of environmental management literature related to biodiversity conservation as the most crucial part in conserving ecosystem services (Brooks et al., 2006; Hanley et al., 1995; Turner et al., 2007). Costanza (1987) predicted that the value of ecosystem services would be in the range of US$ 16-54 billion per year (Margules et al., 2014). This figure was acquired by identifying various ecosystem components that gave a contribution towards people’s welfare, and by
concluding the components’ values based on the previously conducted research.
Based on the above issues, the general purpose of this research is to understand the value of Pemuteran and Tulamben maritime destination according to what is depicted through actual expenditures of travelers generated by marine tourism activities, as well as through the perception of tourists in maintaining the environmental value for the future. In particular, this study aims to analyze actual expenditures in diving tourism activity and how it contributes to the economy of the local communities in Pemuteran and Tulamben.
Tourism as an industry has provided for every interested and deep-pocketed party opportunities for business and investment, with a wide range selections worth from only hundreds of thousand rupiahs to million dollars. Moreover, the current local and national regulation regarding the issue is very supportive towards this cause. The increase of local revenue serves as the means for the government to provide opportunities for employers to continuously raise their investment, without having to think about the long-term impact of these problems. It actually has a positive and negative impact on the movement of multisectoral expansion and regional development. In addition, tourism has also added speed to economic growth and movement, though it does not necessarily strengthen the economic revenue evenly. Employment increases in all areas; economic diversification results in a multiplier effect on society. It is undeniable that the progress of tourism in Bali cannot be fully accelerated only by the Balinese themselves. Outsiders own no less than 75% of investment in the tourism sector. One of its implications on local human resources as cultural participants is that there is only a small percentage of these local workforce involved in the process of decision making to determine the direction of tourism businesses, especially in hospitality.
Tourism is an industry that produces a variety of resources, generates waste, and requires a specific infrastructure (McKercker, 1993). It also depends on high-quality resources in order to survive. Just as the case of other expenses in the economic sector, the impact of these tourism expenditures is magnified by the economic multiplier effects. Tourism multiplier indicates the total increase in output, labor income, and job opportunities arising through various industrial relations caused by these expenses.
The ecosystem services are increasingly recognized as having great importance to economic development. One shade of its importance is that it gives an understanding that ecosystem function is at the core of our life support. There is also increase in the amount of literature in the field of environmental management, and it can be seen that the preservation of biological diversity is paramount in conserving ecosystem services (Brooks et al., 2006; Hanley et al., 1995; Turner et al, 2007).
Marine ecosystem service is a natural function of marine ecosystems which is either natural or artificial, that provide direct or indirect benefits in improving the quality of the environment for the welfare of society. In general, services are defined as service products resulting from actions, either in the form of intangible and/or tangible products, in which the products do not always result in private ownership and is not always limited in physical form only. The ecosystem function
is a minimum aggregated process which includes biochemical, biophysical, and biological process, and it ensures biological productivity, organizational integrity, and everlasting ecosystem. However, there are no agreed criteria to define the function. The products of environmental services are reserves and the flow of substances or materials and energy that are influenced by the type of land use and production system of the land.
The relationship between ecosystem services with marine biodiversity becomes more apparent when we study the underlying force of change in an ecosystem. Nunes and Berg (2001) identify the diversity of functions referring to the capacity of ecosystems to absorb, to a certain extent, the shocks in the ecosystem without impeding the status quo, and it should be considered as part of the ecosystem values. The need to minimize the impacts of human activity on the ecosystem functions has been lately studied by many experts including Sullivan and O'Keefee (2011). The value of ecosystem from ecological standpoint refers to the importance of coastal ecosystem as ecotourism destination as well as a reservoir of various species of fish and other ecological functions. This perception is equated with setting a price tag on the goods and services produced from coastal and marine resources and environment (Tuwo, 2011: 220).
Costanza (1987) estimated the value of world's ecosystem services is in the range of US$16- 54 billion per year (Margules et al., 2014). The figure is obtained by identifying the various ecosystem components that contribute to human welfare, and from concluding the components’ values based on the valuation studies conducted previously. To calculate and describe the value of environment or ecosystem services as the benefits obtained by people from ecosystems is quite simple, but the process to quantify these services and to apply its economic value is a fairly complicated process. There are so many problems associated with the conventional environmental valuation techniques (such as travel costs method, contingent valuation, replacement costs, and so on). In addition, many people doubt the data models made and the values of the presented hypotheses.
This study attempts to offer some contribution in the midst of the debate by identifying the total expenditure by tourists as a direct result of the use of coastal services as tourism activity. Furthermore, the multiplier effect on the local economy can be measured through the implementation of tourism multiplier. Tourist expenditures that directly affect the coastal communities also contribute to the changing patterns of Balinese culture of the community in the area. Study of changes in the values of Balinese culture as the result of growing tourism is the main feature of this study.
The study uses a questionnaire as the instrument to collect the data. This research is a development of research in Uluwatu conducted by Margules et al., 2014, so that the principal research instrument was adopted from this research model that collaborated with others research (Musa et al., 2006 and Suardana, 2015).
The population in this study were international and domestic tourists who visited Pemuteran and Tulamben. The
seasonal visitation through a year highly influences this research, so it was conducted in three seasons of visits of the observed year.
Initial surveys were conducted during peak and low seasons to provide a variance for the data, in order to identify the existing condition on the overall spending patterns of the tourists. The first samples were taken during six month period, where as many as 125 people were involved in the survey. Sample collection at this period was aimed to identify the effectiveness of the survey in finding the required data. Method of data analysis used was qualitative and quantitative methods using descriptive statistics and simple statistical inference.
Beautiful underwater treasure supported with a selection of facilities results in a thriving diving tourism in Bali. There are several areas in Bali that have been developed as a maritime tourism attraction, and some of those areas are Tanjung Benoa and Sanur, Candidasa, Tulamben, Nusa Penida, and Pemuteran. Based on interviews and observations, most of the diving sites in Bali have minimum visibility ranging from 15 to 30 meters, which falls in ‘good’ category (Suardana, 2015). In addition to that, various coral reefs are still in prime condition, with a varied selection of diving sites.
-
1) Expenditures of Diving Visitors and Local Economic Significance
Results show that the number of tourists who go diving and snorkeling in the area of Tulamben and Pemuteran reaches 297.752 people each year. The characteristics of these visitors are beginner divers or usually referred as "picnickers" who is rather young at age, having one to five years of diving experience, and are highly educated. Most of them are repeaters whose length of stay ranging from 4 to 5 days, and they spend 1-2 hours on average on diving. These visitors generally have made diving plan 3-5 months prior their departure to Bali. This is shown by their decision of making Bali as their top choice of destination for diving activities. Additional activities complementing this tourism are spa and nightclub. They choose Bali as their diving destination because of its underwater biodiversity and diverse constellation of other tourism objects.
Of the 125 samples examined in this study, 80.8% mentioned "diving" as the main reason for their visits to Bali. Although there is a difference between the samples from Peak and Off-peak season, it is not so significant that it influences the analysis that is made. The number of visitors during peak season is estimated to reach an average of 1.189 persons per day. Meanwhile, during the period of mid-season or the between-season which is dependent on fluctuations of the winding course, the areas observed host an average of 891 users per day. Off-peak season, which falls during the rainy season, is the least favorable condition for diving activities, and therefore collect the least amount of visitors, which reaches the number of 455 users per day.
Table 1. Seasonal Visits and Annual Visitor Population
|
Averag e numbe r of days |
Estima ted averag e | ||||
|
Average |
Average |
r of | |||
|
Month |
Season |
number of daily visitors |
number of visitors |
annual visitor populat | |
|
based on |
per |
ion | |||
|
the season |
per season |
season |
(So x | ||
|
Do) + | |||||
|
(Sm x | |||||
|
Dm) + | |||||
|
(Sp x | |||||
|
Dp) | |||||
|
January February |
Off-peak |
So = 455 |
Do = 91 |
So x Do | |
|
March |
season |
41.405 | |||
|
April | |||||
|
May |
Mid- |
Sm = 891 |
Dm = |
Sm x Dm | |
|
June |
= | ||||
|
Decemb |
season |
122 |
108.702 | ||
|
er |
297.75 | ||||
|
July August Septemb |
Peak |
Sp = 1189 |
Dp = |
Sp x Dp |
2 |
|
er |
Season |
152 |
= | ||
|
October Novemb er |
180.728 | ||||
Source: research result, 2016
The analysis reveals the estimated calculation of annual visitor population is about 297.752 people per year. This information is used in the process of calculating the “total annual expenditure” (of the visitors, ed.) and “the average of individual expenses” associated with the visits to particular diving spots (or surf break, ed). Although there is uncertainty in the estimation of this kind, the approach is acceptable in the context of rapid participatory appraisal. Furthermore, since 80.8% mentioned diving as their main reason for visiting Tulamben and Pemuteran, it can be concluded that as many as 240.584 people have contributed expenditure annually with the credit goes to the aforementioned main reason as a direct consequence of using potential underwater tourism as ecosystem services.
Calculation on the expenditures of the tourists who have come to Bali for diving and snorkeling hits the average amount of US$ 850,74 per day during the off-peak season, US$ 945.77 during mid-season, and US$ 976,81during peak season, all with the cost of travel to Bali an accommodation excluded. When this amount is added with the total of annual visitor population, this figure becomes the minimum projection of the total amount of the actual annual expenditures by diving visitors in Tulamben and Pemuteran, which is amounted to US$ 283,112 million per year (see Table 2).
Table 2. Calculation of Annual Expenditures
|
Season |
Individual Visitors for Each Season |
Calculated Expenditures (Average per person in US$) |
Expenditures per Season (in US$) |
Annual Expenditures (in US$) |
|
Off-Peak Season |
37.264,5 |
850,74 |
31.702.400,73 | |
|
Mid Season |
97.831,8 |
945,77 |
92.526.381,49 |
283.112.008,1 |
|
Peak Season |
162.655 |
976,81 |
158.883.225 | |
|
Source: research result, 2016 | ||||
Based on the data presented in Table 2 above, the macroeconomic effects of expenditure in the context of Bali’s economy are calculated, using the economic value multiplier. Two tourism multipliers available for Bali are input and output multiplier application (Toh et al., 2004), and multiplier application based on SAM (Antara, 1999) as illustrated in Table 3. These figures indicate that the overall economic effects of diving tourism in Bali range from USD 396,4 million to USD 1.059,7 million per year. Moreover, the value of actual expenditure in Bali which is amounted to USD 283.112 million per year will contribute to the foreign exchange for Indonesia as a whole.
Table 3. Ratio of Monetary Effect of Diving Tourism in Bali
|
Estimated Annual Expenditure |
IO Application ( x 1,4) (Toh 2014) |
SAM (x 3,743) (Antara, 1999) |
|
283.112.008,1 |
396.356.811,4 |
1.059.688.246 |
Source: research result, 2016
This figure represents a significant contribution in its relation to Bali’s economy. The annual expenditure effect of US $ 283.122 has an impact on the improvement of the local economy, in addition to the growth of local economy resulted from the accompanying activities. The accompanying results of the growing popularity of diving tourism appear in the forms of restaurant, souvenir, food stalls, photo services, and other businesses. These activities contribute much directly to the public, but they are not calculated in macro. When compared with the equivalent value of economy in developed countries like the United States or Australia, this might be an important sign for policymakers to give more attention to the issues of protecting coral reef ecosystems, and to the size of the direct use value of coral reefs, fish and Bali’s marine ecosystems.
Based on the public perception it was found that diving or snorkeling activities and businesses require qualified divers. Most of the tourists diving in Bali waters nowadays are certified divers who soon become the members of a diving institution. About 90.8% of Bali visitors have got diving certificates from various diving associations and have been members of those bodies. PADI certifies even 28% of these tourists and the other
20% are certified by CMAS. If business patterns and certification of diving and snorkeling activities are monitored, it generally will require a long process. For visitors who are members of foreign certification bodies, their expenditure during their stay in Bali will be referred to the country granting the license or certificate. In addition, diving tools that are standard equipment for the particular water sport are imported from other countries.
2. Perception of Tourists on the Importance of Environmental Quality and Diving Tourism Services in Bali
In order to determine the quality of diving tourism service, tourists’ perceptions, experiences, and knowledge about environmental condition should also be measured, along with their level of satisfaction. In this study, satisfaction level is measured using indicators related to the overall perception of the experience they gained during their diving tours. The indicators are, 1) diving becomes their first choice of tourism, 2) the experience gained is as expected, 3) in general, the diving sites in Bali meet the expectation, 4) the overall services offered are as expected, 5) their overall demand for diving are met, and 6) they are satisfied with diving services in Bali. Based on these indicators it is found out that tourists diving in Bali generally have a good opinion that services provided live up to their expectations. The indicator of satisfaction by the tourists is measured as a whole, so that specific observation on service indicators is not detailed. On the other hand, Aksu et al (2010), Bosque et al. (2009), and Moses et al.,(2006), state that it is of great importance to measure tourists’ experience starting from their arrivals to their actual diving activities. They need to experience all the products of diving tourism themselves. For the sake of increasing satisfaction on services, a more comprehensive measurement of tourists’ satisfaction with the services during their stay in Bali is required. Therefore, this study complements tourists’ satisfaction level by measuring the gap between their expectations and perception on diving in Bali. Determining satisfaction level, the 17 indicators of satisfaction by Moses et al. (2006) and Cronin et al. (2000) are used.
The divers’ perception on local environmental conditions is diverse. Satisfaction is a long-term strategy that takes commitment, funding, and human resources. To survive, a destination must be able to create sustainable quality built from satisfaction level by first figuring out the gap between expectations and perceptions (Hasan, 2013: 108). This will suggest that if the expectation is more significant than the perception, it means the tourists are disappointed or dissatisfied; if expectation level is parallel to perception, it suggests that their anticipation is confirmed; and if the expectation is lower than the perception, it shows that the tourists are satisfied.
If the tourists’ expectation before their diving tour and their perception afterward are compared, the gap between the two factors is acquired, as illustrated in Table 4. and Figure 1.
Table 4. Expectation and Satisfaction of Divers
|
Indicator |
N |
Satisfactio |
Mea n |
Expectati on S.D |
df | |
|
n Mea n |
S. D | |||||
|
Underwater |
25 |
4.38 |
.835 |
4.20 |
0.782 | |
|
visibility |
0 |
0.18 | ||||
|
Coral reef |
25 |
4.00 |
1.00 |
4.00 |
1.242 | |
|
0 |
3 |
0.00 | ||||
|
Marine life |
25 |
3.91 |
1.02 |
3.70 |
1.052 | |
|
0 |
7 |
0.21 | ||||
|
Value for |
25 |
3.91 |
.831 |
4.06 |
1.008 | |
|
money |
0 |
-0.14 | ||||
|
Cleanness |
25 |
3.76 |
1.24 |
3.47 |
0.777 | |
|
0 |
6 |
0.29 | ||||
|
Accommodat |
25 |
4.26 |
.766 |
3.75 |
0.654 | |
|
ion |
0 |
0.50 | ||||
|
Transport and |
25 |
4.05 |
.895 |
4.00 |
0.720 | |
|
transfer |
0 | |||||
|
arrangements |
0.05 | |||||
|
Quality of the |
25 |
3.99 |
.842 |
3.56 |
0.891 | |
|
food |
0 |
0.43 | ||||
|
The dive boat |
25 |
3.89 |
.746 |
3.38 |
0.912 | |
|
services |
0 |
0.51 | ||||
|
Professionalis |
25 |
4.15 |
.805 |
4.00 |
0.649 | |
|
m of the dive |
0 | |||||
|
masters |
0.15 | |||||
|
Staff Attitude |
25 |
4.02 |
.770 |
3.93 |
0.788 | |
|
0 |
0.09 | |||||
|
The staff’s |
25 |
3.73 |
1.01 |
3.50 |
0.861 | |
|
concern about |
0 |
2 | ||||
|
diving safety |
0.23 | |||||
|
Diver |
25 |
3.98 |
.884 |
3.98 |
0.747 | |
|
crowding at |
0 | |||||
|
some of the | ||||||
|
dive sites |
0.00 | |||||
|
Rental dive |
25 |
4.12 |
.749 |
4.05 |
0.712 | |
|
equipment |
0 |
0.06 | ||||
|
The beauty of |
25 |
4.32 |
1.00 |
3.38 |
0.824 | |
|
the fish |
0 |
9 | ||||
|
species |
0.94 | |||||
|
Sea water |
25 |
3.67 |
1.28 |
3.02 |
1.064 | |
|
temperature |
0 |
0 |
0.65 | |||
|
Dive |
25 |
3.82 |
1.33 |
2.97 |
0.973 | |
|
briefings |
0 |
4 | ||||
|
before each | ||||||
|
dive |
0.85 | |||||
|
Airports |
25 |
3.92 |
1.21 |
3.45 |
1.154 | |
|
services |
0 |
2 |
0.47 | |||
|
Access to |
25 |
3.06 |
1.15 |
3.81 |
0.986 | |
|
dive spot |
0 |
1 |
-0.75 | |||
|
The number |
25 |
4.02 |
.803 |
3.45 |
0.981 | |
|
of divers |
0 |
0.57 | ||||
|
Total |
250.0 | |||||
|
78.95 |
73.65 |
0 | ||||
|
Mean |
3.947 |
3.682 | ||||
|
6 |
6 |
0.265 | ||||
It can be seen from the figure that there is a difference in the value of perception and expectation which stands at 0.10 and service performance of 3,948—a figure that represents tourists’ satisfaction. This suggests that diving destinations in Bali are able to meet the expectations of tourists regarding the particular services. Of the twenty indicators provided, accessibility of the diving sites needs to be improved because at some places, such as Tulamben and Amed, service related to this issue is less than stellar.
Comparison Expectations Values and Perceptions Values of the Divers
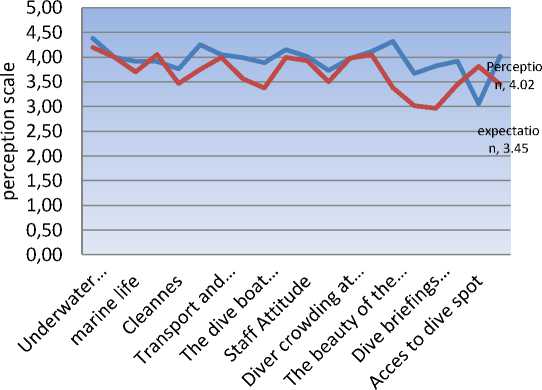
Figure 1. Comparison between Expectation and Perception of Tourists
Most of the visitors who engage themselves in diving activities in Bali fall into the category of “picnickers” characterized with their young age, and high education. They are mostly repeaters who stay in diving areas for 4 to 5 days and dive for about 1 or 2 hours in the open waters. Their average daily expenditure amounts to USD 850.74 during the off-peak season, USD 945.77 during mid-season, and US$ 976.81 during peak-season. When added to the total number of annual visitors, these figures become the minimum total estimation of the actual annual expenditure amounted to US$ 283.112 million per year. The overall economic effect of the tourists ranges from US$ 396.4 million to US$ 1.059,7 million per year. The value of actual expenditure amounts to USD 283.112 million per year, and this contributes to the revenue for Tulamben and Pemuteran areas.
Measures to tackle the negative impacts of improperly regulated tourism development on the environment in the area of Tulamben should be taken immediately. This study only identifies visitors’ spending patterns that affect the economic value of the underwater ecosystem. Furthermore, there is also dire need to include the impacts of tourism on social aspects of the community in the coastal area of Tulamben and Pemuteran. This is important because local people are the main actors and supporters for the sustainability of marine ecosystems in the region.
ACKNOWLEDGEMENT
Gratitude is rendered to the Ministry of Research and Technology of the Republic of Indonesia, Rector of Udayana
University through its Community Service and Research Institute, and thanks also to the Dean of Faculty of Tourism for funding this research.
REFERENCES
-
[1] antara, m. 1999. Linkages between Tourism and Agriculture in Bali, Indonesia: A Social Accounting Matrix Approach, Sustainable Tourism: The Balinese Perspective. Denpasar Bali. 1-9.
-
[2] Aksu, Akın Ebru Tarcan İçigen and Rüya Ehtiyar. 2010. A Comparison of Tourist Expectations and Satisfaction: A Case Study from Antalya Region of Turkey. Turizam. Volume 14, Issue 2. pp. 66-77.
-
[3] Amir, and Jiddawi. 2007. Dolphin Tourism and Community Participation in Kizimkazi Village Zanzibar. Journal of Development Studies. Vol. 43. No.2, 340-359, ISSN0022-0388. February 2007. NewYork. Rotledge, Taylor andFrancis.
-
[4] Bosque, Ignacio Rodrı´Guez del and He´ctor San Martin, Jesus Collado and Maria del Garcia de los Salmones. 2009. A Framework for Tourism Expectations. International Journal of Cultural, Tourism and Hospitality Research. Vol 3. No 2. pp 139-147.
-
[5] Brooks, T.M., Mittermeier, R.A., Fonseca, G.A.B.d., Gerlach. J. Hoffmann, M, Lamoreux, J.F. Mittermeir, C.G. Pilgrim, J. D and Rodrigues, A.SL. 2006. Global Biodiversity Conservation Priorities Science, 313. pp 58-61.
-
[6] Clason,D.L. and Dormody, T.J. 1993. Analyzing Data Measured by Individual Likert-Type Items, Journal of Agriculture Education 35, pp 31-35.
-
[7] Costanza, R., d’Arge, R. deGroot. Farber,. Grasso., Hannon., Limburg. Naeem, O,Neil, Paruelo, Raskin, Sutton, Belt. 1987. The Value of the World’ Ecosystem Service and Natural Capital Nature, 387. pp 253-260.
-
[8] Cronin, J.J. and Taylor S.A. 1992. Measuring Service Quality: A Reexamination and Extension. Journal of Marketing. 56 (July), pp. 55-68.
-
[9] De-Veaux, R.D.,Velleman,P.F., and Bock, D.E. 2009. Intro Stats 3rd Edition,Pearson Education, Boston.
-
[10] Dmitrovic, Tanja, Cvelbar, Ljubica Knezevic., Kolar, Tomaz, and Brecic, Maja Makovec. 2008. Conceptualizing Tourist Satisfaction at the Destination Level, International Journal of Culture, Tourism and Hospitality Research, Vol.3, No. 2, pp. 116-126.
-
[11] Hasan, Ali. 2013. Marketing and Selection of Cases. Yogyakarta: CAPS.
-
[12] Hanley. N., Spash, C and Walker, L. 1995. Problem in Valuing the Benefits of Biodiversity Protection, Environmental and Resource Economics 5. pp 249.
-
[13] Margules, T.P. Mustika, Ponting, J. 2014. Direct Expenditure Review in Relation to Contributions Ecosystem Services to the Local Economy in Uluwatu, Bali, Indonesia. Concervation International Indonesia. Unpublish.
-
[14] Mc Kercher, B. 1993. Some Fundamental Truths about Tourism: Understanding Tourism Social and Environmental Impacts, Journal of Sustainable Tourism 1. pp 8-14.
-
[15] Musa, G., Kadir, S.A., & Lee, L. 2006. Layang-Layang: an Empirical Study on SCUBA Divers’ Satisfaction. Tourism in Marine Environments, 2 (2). pp 89-102.
-
[16] Nunes, P. and Bergh, J.v.d. 2001. Economic Valuation of Biodiversity: Sense or Nonsense, Ecological Economics. 39. pp 203-222.
-
[17] Schuler, J. Sheldon K.M. and Frohlich, S M. 2010. Implicit need for achievement moderators the relationship between competence need satisfaction and subsequent motivation. Journal of Research in Personality 44. Pp.1-12.
-
[18] Sierra, J.J., & McQuitty, S. 2005. Service Providers and Customers. Social Exchange Theory and Service Loyalty. The Journal of Service Marketing. Vol 19 (6). pp 392-400.
-
[19] Sirdeshmukh, D., Singh, J., and Sabol, B. 2002. Consumer Trust, Value, and Loyalty in Relational Exchanges. Journal of Marketing Vol 66, 1; proquest, pp 55-37.
-
[20] Sönmez, S. and Graefe, A.R.1998. Determining Future Travel Behavior from Past Travel Experience and Perceptions of Risk and Safety. Journal of Travel Research, 37(2):172-177.
-
[21] Suardana. 2015. Motivation, Satisfaction, and Divers Loyalty in Bali, Dissertations. Udayana University.
-
[22] Toh. R.K Khan, H., and Erawan SD. 2004. Research Note Bomb Blasts in Bali: Impact on Tourism, Tourism Analysis 9. pp 219-224.
-
[23] Turner, W.R. Brandon K. Brooks, T.M. Costanza, R. Fonseca. G.A.Bd. and Portela, R. (2007). Global Conversation of Biodiversity and Ecosystem Service, BioScience 57, pp. 868-873.
-
[24] Um, Chon, S. K., and Ro, Y.2006. Antecedent of Revisit Intention.
Annals of Tourism Research. Vol. 33. No.4, pp 1141-1158
Discussion and feedback