APPLICATION OF MAMDANI FUZZY METHOD TO DETERMINE ROUND BREAD PRODUCTION AT PT VANESSA BAKERY
on
E-Jurnal Matematika Vol. 8(3), Agustus 2019, pp.204-210
DOI: https://doi.org/10.24843/MTK.2019.v08.i03.p254
ISSN: 2303-1751
APPLICATION OF MAMDANI FUZZY METHOD TO DETERMINE ROUND BREAD PRODUCTION AT PT VANESSA BAKERY
-
A. A. I. Dwi Fibriayora1§, G. K. Gandhiadi2, N. K. T. Tastrawati3, Eka N. Kencana4
1Department of Mathematics – Udayana University [Email: ayorafibri@gmail.com] 2Department of Mathematics – Udayana University [Email: gandhiadi@unud.ac.id] 3Department of Mathematics – Udayana University [Email: taritastrawati@yahoo.com] 4Department of Mathematics – Udayana University [Email: i.putu.enk@gmail.com]
§Corresponding Author
ABSTRACT
Mamdani Fuzzy is a method that interprets input values and makes conclusions based on IF-THEN rules and producing the output. In this research Mamdani fuzzy method is applied to determine the amount of round bread production at PT Vanessa Bakery. The step involve: determining the fuzzy system, the membership functions, as well as the fuzzy rules. The defuzzification process is applied to determine the amount of total production and to calculate the MAPE value of the Mamdani fuzzy method. The calculated MAPE as much as 5.94%, indicates this method has an excellent forecasting ability because the value is less than 10%. Thus, the Mamdani fuzzy method can be used at PT Vanessa Bakery.
Keywords: fuzzy logic, Mamdani method, total production
-
1. PRELIMINARY the form of incomplete information, doubts, or
The implementation of production activities in a business entity is based on production planning. Production planning can be interpreted as an activity determining the produced product, the source of raw materials, the amount of production, and the time to complete the production process. Determination of the amount of production in production planning aims to meet market demand with the appropriate number of products.
PT Vanessa Bakery is one business entity that produces bread. This business entity is located on Astasura Street I Number 46, Peguyangan, Denpasar, Bali. The problem of PT Vanessa Bakery is the difficulty in determining the amount of bread production. Bread production uses predictions without prior calculation. In PT Vanessa Bakery's round bread products, the percentage of bread returns reaches 16% per year from the total production. Thus, it is necessary to calculate the amount of PT Vanessa Bakery round bread production, in order to reduce the return on goods.
Demand, sales returns, and stock are uncertain elements. Fuzzy logic can be used to solve problems that contain elements of uncertainty. The element of uncertainty can be in
inaccurate information. Each fuzzy set has a limited membership value from the membership function that represents it. That allows maximum fuzzy settings to be set in the given situation (Robandi, 2006).
The Fuzzy Inference System (FIS) method works on the basis of fuzzy reasoning principles, for example the determination of goods production, decision support systems, and data classification systems. FIS is a method that interprets input values, draws conclusions based on IF-THEN rules given, and then produces output. The Mamdani Fuzzy Method is the most common method when discussing fuzzy methodologies. The advantages of the Fuzzy Mamdani method are intuitive, widely accepted, and very suitable given human input (Naba, 2009).
The application of Mamdani Fuzzy method in determining the amount of production has been done, including by Fajar Solikin and Norma Endah Haryati. Fajar Solikin (2011), conducted research using the Mamdani method and Sugeno's method in optimizing the production of goods. The research obtained the results of the method that most closely approximated the truth value was the production obtained by processing data using the Mamdani method. Norma Endah Haryati (2014), conducted a
study using the Mamdani method based on demand prediction on planning the number of wood floor products. The conclusion obtained in this research is that the Mamdani method can be used to determine the number of products based on inventory data and demand prediction.
Thus, in determining the amount of rounded bread production at PT Vanessa Bakery the author uses the Mamdani Fuzzy method by considering the demand, sales returns, and stock. The purpose of this research was to application Mamdani fuzzy method to determine the amount of rounded bread production at PT Vanessa Bakery.
The data used in this research is secondary data. Data obtained from PT Vanessa Bakery (Mr. Peter Kurniawan Susilo), it is demand, sales returns, stock, and total production data of round bread per week (January 2016 to May 2017). The steps taken in this research are as follows: 1. Establish the fuzzy system
Fuzzy systems are used to predict a fuzzy logic function. The formation of fuzzy systems is supported by forming fuzzy variables, fuzzy sets, the universe, and the domain.
-
a. Fuzzy variables in this study consist of input variables (demand, sales returns, stock) and output variables (total production).
-
b. Fuzzy sets are used in the variable of demand, sales returns, stock and total production a LOW, MEDIUM, and HIGH.
-
c. The universe is obtained from the maximum and minimum value on the data of each fuzzy variable.
-
d. The domain is determined by the boundaries of the discussion for each fuzzy set.
-
2 . Establish the membership function
Membership functions for demand, sales returns, stock, and total production variable use a shoulder shape curve representation because it has three fuzzy sets.
-
3 . Arrange a rule base that contains rules in the form of an implication function. The fuzzy rules that can be formed are obtained from the results of the number of each fuzzy set in the input variable (Bojadziev & Bojadziev, 2007). Rules that can be formed are as follows:
Table 1. The Rules of Demand, Sales Returns, Stock, and Total Production Variables
|
R |
D |
SR |
S |
TP | ||||
|
1 |
IF |
L |
AND |
L |
AND |
L |
THEN |
L |
|
2 |
L |
L |
M |
L | ||||
|
3 |
L |
L |
H |
M | ||||
|
4 |
L |
M |
L |
L | ||||
|
5 |
L |
M |
M |
L | ||||
|
6 |
L |
M |
H |
M | ||||
|
7 |
L |
H |
L |
L | ||||
|
8 |
L |
H |
M |
L | ||||
|
9 |
L |
H |
H |
M | ||||
|
10 |
M |
L |
L |
L | ||||
|
11 |
M |
L |
M |
M | ||||
|
12 |
M |
L |
H |
H | ||||
|
13 |
M |
M |
L |
L | ||||
|
14 |
M |
M |
M |
M | ||||
|
15 |
M |
M |
H |
H | ||||
|
16 |
M |
H |
L |
L | ||||
|
17 |
M |
H |
M |
M | ||||
|
18 |
M |
H |
H |
H | ||||
|
19 |
H |
L |
L |
M | ||||
|
20 |
H |
L |
M |
H | ||||
|
21 |
H |
L |
H |
H | ||||
|
22 |
H |
M |
L |
M | ||||
|
23 |
H |
M |
M |
H | ||||
|
24 |
H |
M |
H |
H | ||||
|
25 |
H |
H |
L |
M | ||||
|
26 |
H |
H |
M |
H | ||||
|
27 |
H |
H |
H |
H |
Where:
R = Rules
D = Demand
SR = Sales Returns
S = Stock
TP = Total Production
L = Low
M = Medium
H = High
The implication function used is Min function to obtain α-predicate of each rule that express on the equation (1)
ba∩b = m i ((BaCx)-BbC))) (1)
Where
μa∩b = membership value results of operating operators AND fuzzy sets A and B
μ λ(x) = membership degree of fuzzy set Tl
B bC)) = membership degree of fuzzy set B
-
4 .Look for fuzzy set solutions using the maximum
method on the equation (2).
(Bsf(xt)>Bkf(xi))
μ (x) = m ax
(2)
Where
μ (xt) = fuzzy set solutions
Bsf (χ t) = membership value of fuzzy solutions to i-th rule
Bkf (χ t) = membership value of consequent fuzzy to i-th rule
-
5 .Look for a crisp solution as output using the centroid method in the equation (3)
Z ∗=∑ ‰^( Zj ) (3)
∑ "=ι^(zi ) (3)
Where
Z ∗ = center of fuzzy region
zj = output value at j-th rule
μ( zj ) = membership degree output value at j-th rule
-
6 .Calculate the value of Mean Absolute Percentage Error (MAPE) by using the results of the defuzzification fuzzy mamdani method and original data
MAPE = ( ιoo%)∑ ‰ι | Xt-Ft | (4)
∖ Yl J X^
with xt is the actual data at t period, Ft is the forecasting value at t period, and n is a lot of data. Forecasting ability is very good if it has a MAPE value of less than 10% (Margi dan Pandawa, 2015).
-
3 . RESULT AND DISSCUSSION
The formation of the PT Vanessa Bakery fuzzy bread rounded system consists of fuzzy variables, fuzzy sets, the universe, domains, and parameters can be seen in Table 2.
Table 2. Fuzzy System of Round Bread of PT Vanessa Bakery
|
Variable |
Fuzzy Set |
Universe |
Domain |
Parameter |
|
D |
L |
[0, 4000] |
[0, 1957) |
(0; 1268;1957) |
|
M |
(1268, 2772) |
(1268; 1957; 2772) | ||
|
H |
(1957, 4000] |
(1957; 2772; 4000) | ||
|
SR |
L |
[0, 800] |
[0, 403) |
(0; 253; 403) |
|
M |
(253, 662) |
(253; 403; 662) | ||
|
H |
(403, 800] |
(403; 662; 800) | ||
|
S |
L |
[0, 250] |
[0, 113) |
(0; 54; 113) |
|
M |
(54, 198) |
(54; 113; 198) | ||
|
H |
(113, 250] |
(113; 198; 250) | ||
|
TP |
L |
[0, 5000] |
[0, 2500) |
(0; 1250; 2500) |
|
M |
(1250, 3750) |
(1250; 2500; 3750) | ||
|
H |
(2500, 5000] |
(2500; 3750; 5000) |
Based on Table 2, the membership functions of each variable are represented as follows:
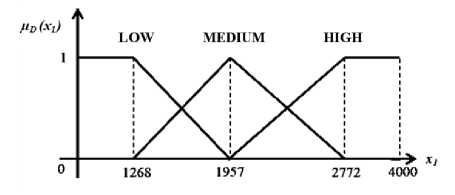
Picture 1. Curve of Membership Function of Round Bread Demand
Membership functions of demand variable:
1 ; X1 ≤ 1268
1957 -
Pdlow ( Xi ) = S ; 1268 ≤ X1 ≤ 1957
689
0 ; X1 ≥ 1957
Pdmedidm ( Xi)=
0 ; X1 ≤ 1268 or x1 ≥ 2772
X1 - 1268
; 1268≤Xi ≤ 1957
689
2772 - X1
04 r ; 1957 ≤ *1 ≤ 2772
0 ; χι ≤ 1957
, λ _ j X1 - 1957
Pdhigh ( Xi ) = S ; 1957 ≤ Xi ≤ 2772
815
1 ; Xi ≥ 2772
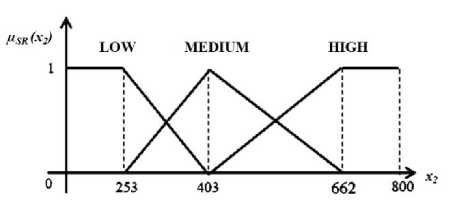
Picture 2. Curve of Membership Function of Round Bread Sales Returns
Membership functions of sales returns variable:
1 ; X2 ≤253
403-
Psrlow (X2 ) = j 150 ;253≤X2 ≤403
0 ; X2 ≥403
(0 ; X2 ≤253or x2 ≥662
⎪ x2-253
⎪662-x2
;253≤x2 ≤403
;403≤x2≤662
Psrhigh ( X2 ) = S 259 ; 403≤x2≤662
1 ; x2≥662
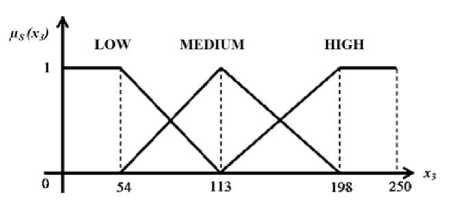
Picture 3. Curve of Membership Function of Round Bread Stock
Example, 1st period data, D = 2370, SR = 253, and IT = 82.
-
1. Membership value fuzzy set of demand variable
Ij-DLOW (2370) = 0
IjDMEDI UM (2370) = 2772—2370 = 0,49
Olb
,,Γ727∩λ _ 2370-1957 — ∩
L1DHIGH (2370) = 0,51
-
2. Membership value fuzzy set of sales returns variable
Membership functions of stock variable:
{1 ;X3≤54
113-X3
59 ; 54≤X3 ≤113
0 ; *3 ≥113
⎪⎧
IjSMEDIUM ( x3)=S
0 ; X3≤54or x3≥198
X3 -54
;54≤*3 ≤113
IjSRLOW(253) =1
Ijsrmedium(253) =0
IjSRHIGH(253) =0
3. Membership value fuzzy set of stock variable
IjSLOW (82) = 113—82 = 0,53
IjSMEDIUM (82) = 82—54 = 0,47
IjSHIGH(82) =0
⎪198 -x3
⎩ 85
;113≤X3≤198
IjSHIGH ( x3 )
0
I *3 -113
{ 815
; *3 ≤113
; 113≤*3 ≤198
; *3 ≥198
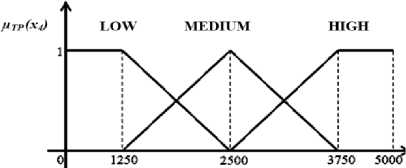
Picture 4. Curve of Membership Function of
Round Bread Total Production
Membership functions of total production
variable:
The implication function used is Min function to obtain the α-predicate of first rule up to 27th rule.
[R1] IF D LOW AND SR LOW AND S LOW
THEN TP LOW
α-pred1 = µDL∩SRL∩SL
= min (µDL(2370),µSRL(253),µSL(82))
= min (0, 1, 0,53)
= 0
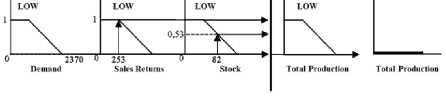
Picture 5. Application implication function for R1
IjTPLOW (X4 )
2500 - X2 ={ 1250
0
X4 ≤ 1250
1250 ≤ X4 ≤ 2500
X4 ≥ 2500
Ijtpmedium (X4 )
(0 ; X4 ≤ 1250 or x4
|
X1 - 1250 | |
|
;1250≤X4 | |
|
=⎨ |
1250 |
|
3750 - X4 | |
|
;2500≤X4 | |
|
⎩ 1250 ; ≤ |
≥ 2500
≤ 2500
≤ 3750
0 ; x4 ≤ 2500
_ ¾ - 2500
IjPTHIGH ( X4 ) = j 1250 ; 2500≤X4 ≤ 3750
1 ; X4 ≥ 3750
[R2] IF D LOW AND SR LOW AND S MEDIUM THEN TP LOW
α-pred2 = µDL∩SRL∩SM
= min (µDL (2370),µSRL(253),µSM(82))
= min (0, 1, 0,47)
= 0
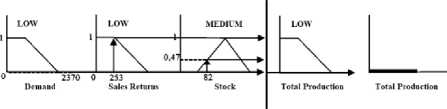
Picture 6. Application implication function for R2
[R27] IF D HIGH AND SR HIGH AND S
HIGH THEN TP HIGH
α-pred27= µDH∩SRH∩ITH
= min (µDH(2370),µSRH (253),µTPH (82))
= min (0,51, 0, 0)
= 0
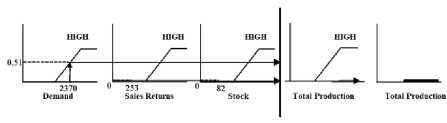
Picture 7. Application implication function for R27
Furthermore, the fuzzy set area with a value of α-predicate not zero can be seen in table 3
Table 3 Interregional fuzzy set result area using first period data
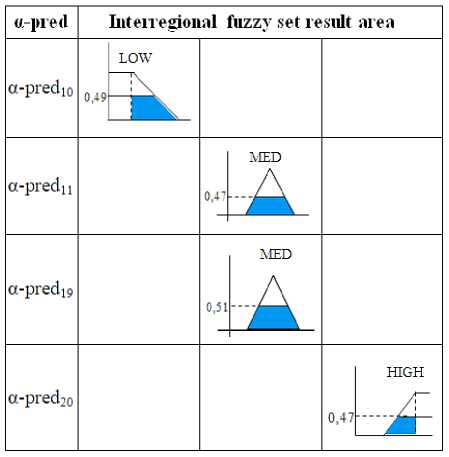
Based on Table 3, we can obtain the results of the composition between rules using the max method. At this stage up to the defuzzification process, the calculation uses the first period data, namely x1 = 2370, x2 = 253, and x3 = 82. The regions resulting from the composition of rules using the 1st period data are obtained based on Table 3 and can be seen in Picture 8.
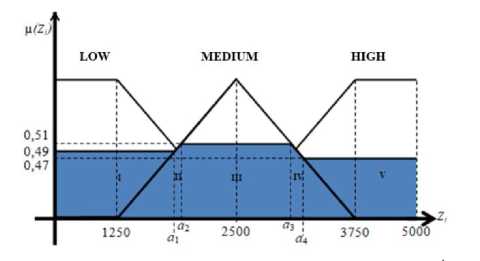
Picture 8. Curve of result regional inter rules composition using period-1
In picture 8, the results of the inter-rule composition using the 1st period data are divided into 5 parts, namely I, II, III, IV, and V. Then, the values of a1, a2, a3, and a4 will be searched to make the membership function result composition.
|
α1 - 1250 1250 |
0,49 |
↔ |
OL^ |
= 1862,5 |
|
«2 - 1250 1250 |
= 0,51 |
↔ |
<^2 |
= 1887,5 |
|
3750 - α3 |
= 0,51 |
↔ |
a3 |
= 3112,5 |
|
1250 | ||||
|
3750 - «4 1250 |
= 0,47 |
↔ |
d4 |
= 3162,5 |
Thus, the membership function for the results of the composition between the rules of the first period is as follows:
|
μ( zι)= |
0,49 ⎧ zι - 1250 |
|
⎪ 1250 0,51 3750 - zι | |
|
⎪ 1250 ⎪ 0,47 ⎩ |
0≤z1 ≤ 1862,5
1862,5 ≤ z1 ≤ 1887,5
1887,5 ≤ zι ≤ 3112,5
3112,5 ≤ zι ≤ 3162,5
3162,5 ≤ zι ≤ 5000
Defuzzification
The defuzzification process in this research uses the Centroid method. In this method, the crisp solution is obtained by taking the center of the fuzzy region. The moment will be calculated for each region, follow by calculation of the area of each area. Finally, the central point is a crisp solution.
a.
Calculate moments for each region
1862,5
M1 = ∫ (0,49)z1 dz-γ
o
= [0,245 z? ]O ,5 = 849882,03125
1887,5
M2 = ∫ , (-
1862,5
- 1250
1250
∖
) Zy dzy
= [
1
3750
Zl3
-
1
2 ^l
211887,5
] = 23438,54
-∣1862 ,5
3112,5
M3 = ∫ (0,51)Zy dzy
1887,5
= [0,255 zι2] 1887,, f = 1561875
Table 4. Calculations result of Round Bread Productions Using the Fuzzy Mamdani Method
|
No |
TP PT VB |
D |
SR |
S |
TP MAMDANI METHOD |
|
1 |
2705 |
2370 |
253 |
82 |
2480 |
|
2 |
2728 |
2326 |
317 |
85 |
2470 |
|
3 |
2710 |
2165 |
448 |
97 |
2480 |
|
4 |
2444 |
1894 |
446 |
104 |
2230 |
|
5 |
2692 |
2333 |
269 |
90 |
2590 |
|
. . . |
. . . |
. . . |
. . . |
. . . |
. . . |
|
73 |
2532 |
1904 |
507 |
121 |
2530 |
3162,5
Mi = ∫ , (
3112,5
3750 -
1250
Zl
) Zy dzy
= [32 ¾2
-
=
1
3750
Zi3 ]
3162,5
3112,5
= 76860,42
5000
∫ (0,47)Zy dzy
3162,5
= [0,235 zι2] , = 3524669,54
b. Calculate the area of each area
=
=
=
=
=
1862,5 × 0,49 = 912,625
(0,49+0,51) ×25
= 12,5
1225 ×0,51 = 624,75
(0,47+0,51) ×50
= 24,5
1837,5 × 0,47 = 863,625
c. Calculate central point as a crisp solution
M1 + M2 + M3 + M4 + W5
2^l + j^ 2 + 4^ +Ay + •^5 6036725,52
2438 = 2.476
Table 4 meaning production amount using fuzzy mamdani method first period up to 73th periode.
After determining the amount of round bread production using the Mamdani fuzzy method, then calculates the MAPE value. The calculation of MAPE is than by using the production data as be actual data. While the forecasting came from Mamdani fuzzy method.
Table 5. Calculation | ⅜Γ | first period data up to 73th period
|
No |
TP PT VB (xt ) |
TP MAMDANI METHOD (Ft ) |
| Xt - Ft | Xt |
|
1 |
2705 |
2480 |
0,0832 |
|
2 |
2728 |
2470 |
0,0946 |
|
3 |
2710 |
2480 |
0,0849 |
|
4 |
2444 |
2230 |
0,0876 |
|
5 |
2692 |
2590 |
0,0379 |
|
. . . |
. . . |
. . . |
. . . |
|
73 |
2532 |
2530 |
0,0008 |
73 ,
∑|Xt - Ft |
= 4,3359
t=i
=
73 (10703%)∑
t=i
| Xt
-
Ft |
Xt
5,94%
The MAPE value of the Mamdani fuzzy method was obtained as much as 5.94%, indicates this method has an excellent forecasting ability because the value is less than 10%. Thus, the Mamdani Fuzzy method can be used to determine the amount of rounded bread production at PT Vanessa Bakery.
-
3. CONCLUSION AND
RECOMMENDATION
In this research, the application of the Mamdani fuzzy method in determining the amount of round bread production at PT Vanessa Bakery. The calculation of the MAPE value of the Mamdani fuzzy method is 5.94%, which means it has very good forecasting ability.
Problems taken in applying the Mamdani fuzzy method in determining the amount of PT Vanessa Bakery round bread production still use three input variables, namely demand, sales returns, and remaining inventory. So that the next research is expected to add input variables, such as the number of workers and production costs, in determining the amount of production.
BIBLIOGRAPHY
Bojadziev, G., & Bojadziev, M. (2007). Fuzzy Logic for Business, Finance, and Management. Singapore: World Scientific Publishing Co. Pte. Ltd.
Haryati, Norma Endah. 2011. Perencanaan Jumlah Produk Menggunakan Metode Fuzzy Mamdani Berdasarkan Prediksi Permintaan. Jurnal Ilmiah Teknik Industri, vol. 4, pp. 95104.
Margi, Kristien., Sofian Pandawa. 2015. Analisa dan Penerapan Metode Single Exponential Smoothing untuk Prediksi Penjualan pada Periode Tertentu (Studi Kasus: PT. Media Cemara Kreasi). Prosiding SNATIF ke-2. ISBN: 978-602-1180-21-1.
Naba, Agus. 2009. Belajar Cepat Fuzzy Logic Menggunakan Matlab. Malang: Penerbit Andi.
Robandi, Imam. 2006. Desain Sistem Tenaga Modern: Optimasi, Logika Fuzzy, Algoritma Genetika.
Solikin, Fajar. 2011. Aplikasi Logika Fuzzy dalam Optimisasi Produksi Barang Menggunakan Metode Mamdani dan Metode Sugeno. Skripsi. Universitas Negeri Yogyakarta.
210
Discussion and feedback