Data Visualization Of House Of Worship Distribution In The IKN Nusantara Region Using Python
on
JURNAL ILMIAH MERPATI VOL. 11, NO. 1 APRIL 2023
p-ISSN: 2252-3006
e-ISSN: 2685-2411
Data Visualization Of House Of Worship Distribution In The IKN Nusantara Region Using Python
I Kadek Noppi Adi Jaya a1, Fauzi b2, Agus Suryana b3, Albertus Dwiyoga Widiantoro c4, I Dewa Kadek Laksana Digita a5
a Information Systems Study Program, Faculty of Information Technology and Science, Hindu Univesity of Indonesia, Denpasar
b Information Systems Study Program, Bakti Nusantara Institute, Pringsewu, Lampung c Information Systems Study Program, UNIKA Soegijapranata, Semarang e-mail: 1 iknadijaya@unhi.ac.id, 2drfauziibn@gmail.com, 3 suryani65@yahoo.com, 4 yoga@unika.ac.id, 5dwlaksana@unhi.ac.id
Abstrak
Ibu kota baru Indonesia, Nusantara, meliputi wilayah daratan sekitar 256.142 ha dan wilayah laut sekitar 68.189 ha. Proyek pengembangan IKN Nusantara berdampak pada peningkatan jumlah transmigran ke wilayah Kabupaten Penajam Paser Utara. Ada beberapa kendala yang dihadapi para transmigran, salah satunya adalah kesulitan mencari tempat ibadah di lokasi terdekat, karena tidak mengetahui posisi atau jalan di sekitar mereka. Untuk mengatasi masalah tersebut, dapat melakukan visualisasi data persebaran rumah ibadah. Analisis dilakukan terhadap tipe rumah ibadah seperti masjid, mushola dan gereja. Bahasa pemrograman yang digunakan adalah Python dengan menggunakan NumPy, Pandas, Matplotlib, Seaborn, RegEx, dan Folium sebagai library yang digunakan. Sebaran rumah ibadah di IKN Nusantara didominasi oleh umat Islam yang mencapai 91,26% yang terdiri dari 57,92% rumah ibadah berupa mushola dan 33,33% berupa masjid. Orang Kristen memiliki 8,74% dari 183 tempat ibadah. Sebaran rumah ibadah masyarakat terkonsentrasi di Desa Sukaraja, Desa Semoi Dua, Desa Argo Mulyo dan Desa Tengin Baru.
Kata Kunci: Visualisasi Data, Rumah Ibadat, IKN Nusantara, Python.
Abstract
Nusantara, Indonesia's new capital, has a land area 256,142 ha and a marine area 68,189 ha. Transmigrant residents in the North Penajam Paser Regency region has increased as a result. The difficulty of finding a place of worship in the closest location because they are unfamiliar with their location or the nearby roadways. We can utilize data visualization to show the distribution of places of worship in order to solve this issue. Analysis was done on several types of houses of worship, including mosques, churches, and musholla. Python is the programming language, and the libraries used are NumPy, Pandas, Matplotlib, Seaborn, RegEx, and Folium. Muslims for the majority of places of worship in IKN Nusantara (91.26%), musholla making up 57.92% of the total and mosques making up 33.33% and 8.74% are owned by Christians. Sukaraja Village, Semoi Dua Village, Argo Mulyo Village, and Tengin Baru Village have the highest concentration.
Keywords: Data Visualization, House of Worship, IKN Nusantara, Python
In Indonesia's Vision 2033 of 2010, the relocation of the central city of the Indonesian government and the center of activities for state institutions to a location in Kalimantan will give birth to a new epicenter that is close to most of the underdeveloped areas and periphery areas that have never been effectively revived through development projects, such as transmigration, accelerated development of underdeveloped areas, accelerated development of eastern Indonesia, and so on [1]. President Joko Widodo announced the transfer of the national capital (IKN) to East Kalimantan Province on August 26, 2019. Several studies are required to carry out the transfer, and the National Development Planning Agency (Bappenas) is the first step in
carrying out the plan to relocate IKN. Bappenas has considered several factors that will influence when relocation is carried out, including economic impacts, appropriate areas, and industrial work areas that can be developed [2]. With the passage of Law (UU) Number 3 of 2022 concerning the State Capital, the transfer of IKN has a strong legal and political basis [3]. The plan is to move the capital of Indonesia to the Sepaku District Area, North Penajam Paser Regency, East Kalimantan. The capital city is planned under the name Nusantara, which covers a land area of approximately 256,142 ha and an area of seawater of approximately 68,189 ha. The commencement of the IKN development project has had an impact on increasing the number of transmigrant households in the area of North Penajam Paser Regency. There are several obstacles faced by these transmigrants, one of which is the difficulty of finding places of worship in the closest locations around them because they do not know the area around them. Houses of worship are places of worship for people who want to do worship to improve spiritual relationships and perform mandatory worship every month [4].
The development of information technology in the modern era, which is increasingly sophisticated and increasingly inexpensive, can encourage people to use technology to develop [5]–[7]. Increasing technology ownership among Indonesians has also made Indonesia the largest country in Southeast Asia with the most internet users [8]. To address the issues, in addition to the use of geographic information systems as technology and internet users, the visualization of data on the distribution of houses of worship in the Nusantara IKM Region is a significant step forward. Data visualization is the process of converting text data into graphics and mapping. This is important because it is useful to make it easier for users to communicate data, such as infographic data [9], [10]. It is easier for users to understand visual information than text information because it is easier to understand visual elements than text elements which take longer to understand [11]. This data visualization is a breakthrough in forming research and implementing new policies on the distribution of places of worship in the Archipelago and IKN Region, in addition to providing visual information about places of worship and their locations.
This study uses the OSEMN framework because it is structured, is often used in data processing, and can be used to analyse the distribution of data on houses of worship in the IKN Nusantara Region, Sepaku District, Penajam Paser Utara Regency, and East Kalimantan. The analysis was carried out on the types of places of worship, such as mosques, prayer rooms, and churches. The dataset for houses of worship used is manual data on the distribution of houses of worship collected until March 2022 by the Sepaku District Government. The programming language used is Python version 3.
Data analysis of houses of worship in the IKN Nusantara Area, Sepaku District, Penajam Regency, North Paser, East Kalimantan uses the OSEMN framework which is a data science framework that is often used to solve a problem because it has structured stages from stages, obtaining data, cleaning data to carry out problem solving [12]. The stages of the osemn framework can be seen in Figure 1, as follows.
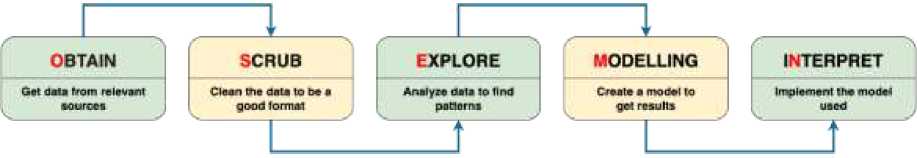
Figure 1. OSEMN Method
The initial stage is obtain where to obtain relevant data in order to meet the objectives of the existing problems. The distribution of locations for places of worship uses data based on the Sepaku District Government which was collected until March 2022. The data obtained consists of data on names, houses of worship, PLN customer ID, average monthly expenses,
types of places of worship, sub-districts and religions. The data that has been obtained will be processed (scrub) so that it can be used in visualization.
This stage is the stage that is carried out to clean up the data that has been obtained. The data that is cleaned or cleaned will become a dataset that can be used properly because it is already structured. Data processing is done so that raw data becomes data ready for analysis [13]. Data processing was carried out using the Microsoft Excel application and stored in the comma separated value (. csv) data format. The data processing carried out will filter the data and eliminate missing values and irrelevant data for analysis needs [14]. The data that has been processed will produce data on nama tempat, jenis tempat ibadat, kelurahan, koordinat, latitude, longitude, agama, link foto dan lokasi draft. The attributes of the data that have been processed to produce data can be seen in Table 1, as follows.
Table 1. List Of Columns Used
|
Column Name |
Number of Non-Null |
Data Type |
|
Place Name |
183 |
object |
|
Type |
183 |
object |
|
Subdistrict |
183 |
object |
|
Coordinate |
183 |
object |
|
Latitude |
183 |
float64 |
|
Longitude |
183 |
float64 |
|
Religion |
183 |
object |
|
Photo Link |
183 |
object |
|
Draft Location |
183 |
object |
At this stage, data exploration has been carried out which has been cleaned at the scrub stage. At this stage, the Exploratory Data Analysis (EDA) technique will be used. From the data owned, it can be seen that the data pattern is data on the location of places of worship in the Nusantara Archipelago area, Sepaku District, North Penajam Paser Regency, East Kalimantan. From this data a visual exploration will be carried out in order to get patterns or data anomalies.
At this stage a modeling will be carried out. The modeling used is data visualization where at this stage the visualization of the data will be carried out. The visualization carried out is the visualization of geospatial data. Data Visualization is done using the Python Programming Language on the Jupyter Notebook application. The following flow of the data visualization process that will be carried out can be seen in Figure 2.
This stage is the last stage to be carried out, which will implement the Jupyter Notebook application. The implementation of geospatial data visualization will produce a mapping of the Sepaku District worship houses. The results of the mapping carried out can be used as material for consideration in making decisions and can be used as material for the development of houses of worship in the East Kalimantan Region.
NumPy
Pandes
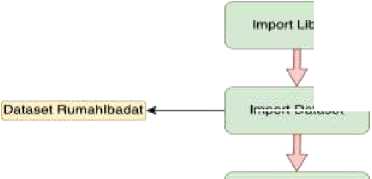
Import Dataset
Impon Maps (OpenStreotMaps)
Matplotilb
Seabom
RegE*
FoKum
Running Maps
Figure 2. Data Visualization Process
Literature study is a reference used in research. The selection of references is in accordance with the topic discussed, namely regarding the distribution of houses of worship. References used include House Of Worship, Python, Jupyter Notebook, Numpy, Pandas, Matplotlib, Seaborn, RegEx, Folium and Data Visualization.
Religious believers in a location value houses of worship as vital religious institutions. Houses of worship serve as venues for both worship and the transmission of religion, in addition to serving as a sign of the existence of religious members. . Houses of worship are scattered in various regions in Indonesia. For example, in the Sepaku District, Penajam Regency, North Paser, East Kalimantan, there are many scattered houses of worship but the transmigration community does not know about them because there is no mapping of specific places of worship. Based on data obtained from the regional government of Sepaku sub-district, there are 183 data on the distribution of houses of worship, including mosques, prayer rooms and churches.
Python is a programming language that employs dynamic semantics to improve syntactic readability and may directly (interpretatively) execute a variety of multi -purpose instructions using an object-oriented approach. Python may be used on a variety of operating systems, including Windows, Linux, and MacOS. Python is frequently used to do analyses, such as those of scientific data. [15]. Jupyter Notebook is a free web tool that is typically used to create and share documents that contain code, computation results, visualizations, and text. Jupyter Notebook uses Python itself. [16]. Python also has several libraries that are often used in conducting research on scientific data such as NumPy, Pandas, Matplotlib, Seaborn, RegEx and Folium. The following is an explanation of some of the libraries that Python has as follows. Numpy is a Python library that the author uses to assist in performing mathematical operations, especially when performing calculations on vectors, matrices and tensors, which would be very inconvenient without Numpy's assistance [17]. Pandas is a library that is often used because it functions to call or process datasets on Jupyter notebooks which often collaborate with the NumPy library [18]. Matplotlib is a Python library that is useful for implementing graphs such as applying pie, chart, or bar plotting [19]. Seaborn is a library that is better developed than matplotlib because it generates high-level graphing information and is usually used to plot statistical information [20]. Regular Expression (RegEx) is a special character sequence that helps match or find a string or other set of strings, using a special syntax stored in a pattern [21]. Folium is a python library which helps in creating several types of Leaflet maps [22]. Maps used on folium usually use Open Street Maps (OSM) which is a web-based project to create free and open maps of the whole world and be used to conduct surveys using GPS, digitize satellite imagery, and collect publicly available geographic data [23]. One of the reasons why OSM could be better than Google Maps in terms of data visualization is because of its open -
source nature. This allows users to customize the map display according to their preferences and add additional data that may not be available on other map platforms. Additionally, Google Maps also has limitations in terms of the data that can be added or modified by users. By using OSM, users can add more specific and detailed data and customize the map display to better suit their needs.
Data is a collection of information or facts made up of words, sentences, symbols, numbers and data which is raw information that has not been processed into information [24]. Visualization is engineering in making pictures, diagrams or animations for the appearance of information [25]. From the explanation above, data visualization is a process of using visual elements such as charts, graphs or maps to represent data [26]. Data visualization translates complex, high-volume, or numerical data into visual representations that are easier to process and understand. Data visualization can enhance and automate visual communication processes for accuracy and detail. Results from data visualization can be visually represented to extract actionable insights from raw data [27].
Research conducted on the distribution of houses of worship in the Sepaku District, Penajam Regency, North Paser, East Kalimantan will produce a visual map. The distribution of places of worship will make it easier for the community or transmigration to find locations to pray. The results of the map can also be used for further development and research.
Based on the data structure in Table 1, there are no missing values in all columns so that the data can be used directly in the next process. In its implementation in the Python programming language version 3, using Jupyter Notebook requires several libraries in this research. The libraries used to implement geospatial visualization on Jupyter notebooks include: NumPy, Pandas, Matplotlib, Seaborn, RegEx and Folium. In Figure 3 it can be seen the dataset will be visualized.
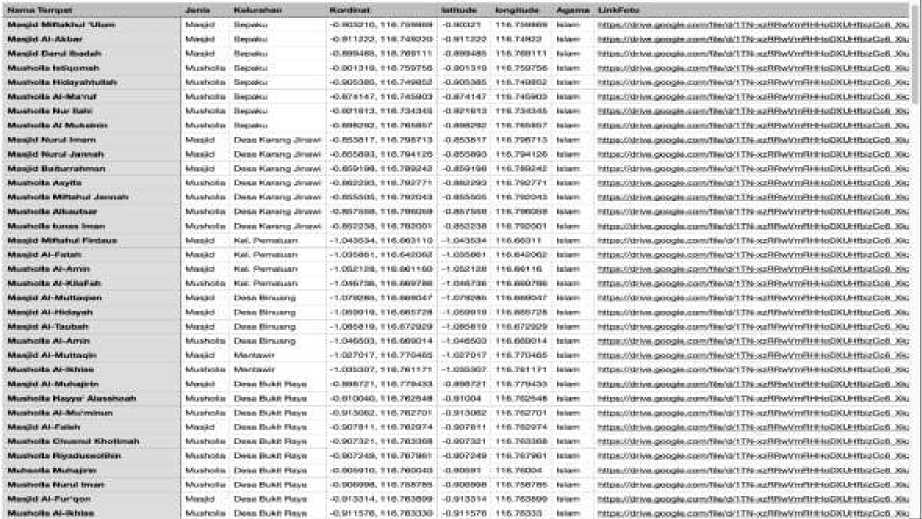
Figure 3. Dataset House Of Worship
Exploratory Data Analysis (EDA) is a technique of understanding data whether data can be used or not and seeing what data can be used [28]. Figure 4 shows the coding for displaying the map of Sepaku District, North Penajam Paser Regency, East Kalimantan using the standard
folium library and the results are shown in Figure 5. Figure 6 displays the coding showing the number of houses of worship by village and the results are shown in Figure 7. Figure 8 displays the coding showing the number of houses of worship by type and the results are shown in Figure 9.
HtMkU-Ut1 HpakU-Ing ≈ -β.9134ai8W247tm, 116.87384806799806 myjtkipe - foll∣M∣.Maρ(location= IsepakU-Ut1 sepaku_lng), zoM_start=10) Ityjnape
Figure 4. Coding Displaying Maps Sepaku District
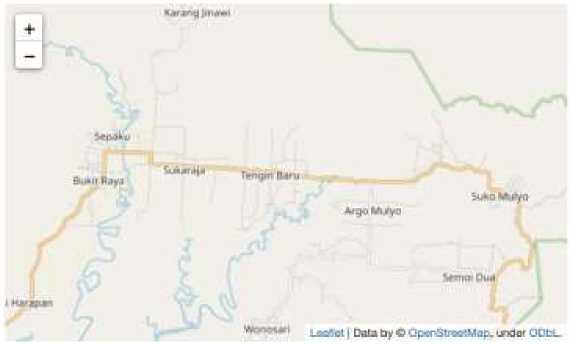
Figure 5. Results Displays a Map of Sepaku District
# Jumlah Rumah Ibadat Berdasarkan Desa ∕ Kelurahan dfI'Kelurahan'1.value_counts()
-
Figure 6. Coding Displays the Number of Houses of Worship by Village
Name: Keluranan1 dtype: lnt64
-
Figure 7. Results Displays the Number of Houses of Worship by Village
# Jumlah Rumah Ibadat Berdasarkan Jenis
At ['Jenis'].value_counts()
-
Figure 8. Coding Displays the Number of Houses of Worship by Type
Name: Jenis1 dtype: int64
-
Figure 9. Results of Showing the Number of Houses of Worship by Type
-
Figure 10 displays the coding displays a map of Sepaku district with all places of worship and results displays a map of Sepaku district with all places of worship. The light blue icon indicates the type of house of worship in the form of a mosque, the light green icon is a marker for a prayer room and the pink icon is a church marker.
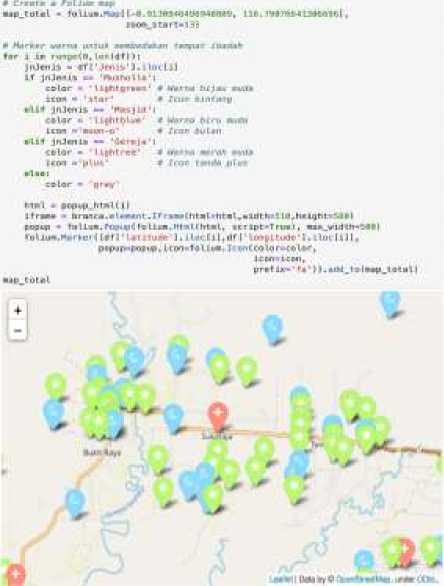
Figure 10. Coding Displays a Map of Sepaku District with All Places of Worship and Results Displays a Map of Sepaku District with All Places of Worship
-
Figure 11 shows the coding for classifying places of worship based on their type and categorizing places of worship according to their religion. Figure 1 2 displays the coding displaying number of houses of worship by village for the Islamic religion and the results are shown in Figure 13.
-
9 Mengelompokkan Tempat Ibadat
dfGereja - df[df I'Jenis'] »- 'Gereja']
dfMasjid = df Idf 1'Jenis'] = 'Masjid' ] dfMushoUa = df Mf Γ Jenis'] = 'MushoUa')
* Mengkatagorikan Tempat Ibadat Sesuai Agama df Islam = dfM.asj Id-SppendtdfMusholla) dfKrlsten = dfGereja
-
Figure 11. Coding Classifies Places of Worship by Type and Categorizes Places of Worship According to Religion
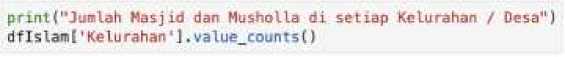
Figure 12. Coding Displays The Number Of Mosques And Mushollas By Village For Islamic
Juιa¼h Has] id dan MustioUa di setiap Kelurahan ∕ Ocsa
Hane: Keturahan4 dtype: mt64
-
Figure 13. Results Displays the Number of Mosques and Mushollas by Village for Islam
-
Figure 14 displays the coding showing the number of houses of worship by village for Christianity and the results are shown in Figure 15.
print("Junldh Gereja di setiap Kelurahan ∕ Desa'') dfGereja['Kelurahan’).value_counts()
-
Figure 14. Coding Displays the Number of Churches by Village for Christianity
Junlah Cereja di setiap Keluraliae ∕ Desa
Naiw: Kelurahan, dtype: IntM
-
Figure 15. Results Displays the Number of Churches by Village for Christianity
-
Figure 16 displays the coding displays a map of Sepaku district for Islamic religious houses of worship and results displays a map of Sepaku district for Islamic religious houses of worship.
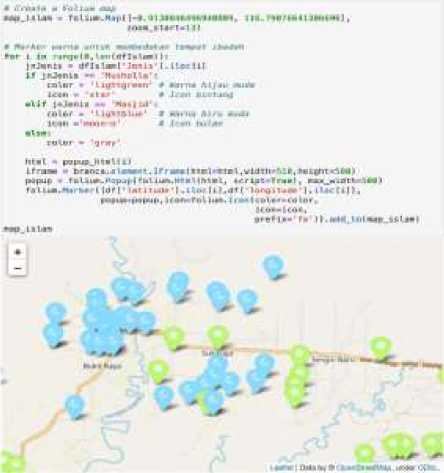
Figure 16. Coding Displays a Map of Sepaku District for Islamic Religious Houses of Worship and Results Displays a Map of Sepaku District for Islamic Religious Houses of Worship
-
Figure 17 displays the coding displays a map of Sepaku district for Christian religious houses of worship and results displays a map of Sepaku district for Christian religious houses of worship.
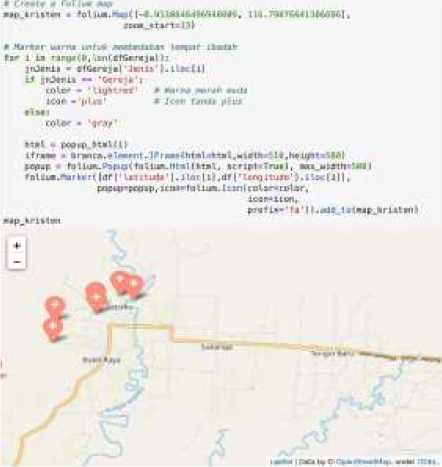
Figure 17. Coding Displays a Map of Sepaku District for Christian Religious Houses of Worship and Results Displays a Map of Sepaku District for Christian Religious Houses of Worship
In addition to providing visualization results on Jupyter Notebook, visualizations are also displayed on a web-based application that provides information related to houses of worship in the Sepaku District area. Figure 18 shows the results of implementation on web-based applications (HTML) for displaying information in houses of worship and photo of a house of worship from view in a web-based application (HTML)
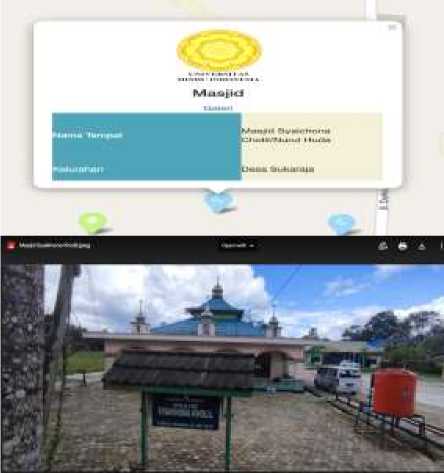
Figure 18. Results of Implementation on Web-Based Applications (HTML) for Displaying Information in Houses of Worship and Photo of a House of Worship from View in a Web-Based Application (HTML)
Based on the various data visualizations that were displayed in the previous stage, it can be seen that in the Nusantara Archipelago area in Sepaku District, North Penajam Paser Regency, East Kalimantan, there is still an uneven distribution of houses of worship. 57.92% of the houses of worship are prayer rooms, namely 106 locations out of a total of 183 existing houses of worship and 33.33% of the houses of worship are mosques, namely 61 locations. The church has 8.74% of the total population of synagogues in 16 locations. This is certainly influenced by the distribution of the population, which is predominantly Muslim, which in total, based on the distribution of houses of worship, reaches 91.26%.
The distribution of houses of worship for the Islamic religion has been well -distributed in all villages and sub-districts in the Sepaku District, dominated by Sukaraja Village, Semoi Dua Village, Argo Mulyo Village and Tengin Baru Village which have more than 20 locations of places of worship for the Islamic religion and also represent the distribution of Population density in Sepaku District. The distribution of houses of worship for Christianity is still concentrated in Maridan Village with 7 locations for places of worship for Christianity, while Maridan Village still has 12 locations for places of worship for Islam.
For locations that rarely have houses of worship, such as Mentawir Village which only has 2 houses of worship in total, Binuang Village and Pemaluan Sub-District which each have 4 houses of worship, and Wonosari Village, Bumi Harapan Village, and Karang Jinawi Village which each have Each has 7 houses of worship, it can be assumed that they also have a small population distribution. This can be a location to accommodate transmigrants when they come to Sepaku District.
In this research an analysis of the distribution of houses of worship in the Archipelago IKN area in Sepaku District, North Penajam Paser Regency, East Kalimantan was carried out using the OSEMN framework. Analysis was carried out using the OSEMN framework to produce a visual model for the distribution of houses of worship based on place name, type, village, coordinates, latitude, longitude and religion. From the results obtained, it can be concluded that data analysis using visual models, especially geospatial maps, is very helpful in finding patterns and relationships between data. The distribution of houses of worship in the Archipelago IKN area is dominated by adherents of the Islamic faith reaching 91.26%, consisting of 57.92% houses of worship in the form of prayer rooms and 33.33% in the form of mosques. Christians own 8.74% of the 183 places of worship. Based on the distribution of houses of worship, it shows that the distribution of people is concentrated in Sukaraja Village, Semoi Dua Village, Argo Mulyo Village and Tengin Baru Village, and there is a low distribution in Mentawir Village, Binuang Village, Pemaluan Subdistrict, Wonosari Village, Bumi Harapan Village, and Karang Village. Jinawi.
References
-
[1] W. L. Hutasoit, “Analisa Pemindahan Ibukota Negara,” DEDIKASI: Jurnal Ilmiah Sosial, Hukum, Budaya, vol. 19, no. 2, pp. 108–128, 2018, doi:
https://doi.org/10.31293/ddk.v39i2.
-
[2] R. R. A. Hasibuan and S. Aisa, “Dampak dan Resiko Perpindahan Ibu Kota Terhadap Ekonomi di Indonesia,” AJEI, vol. 5, no. 1, p. 183, Jun. 2020, doi: 10.30829/ajei.v5i1.7947.
-
[3] M. Fajri, “Menggagas Ide Miniatur Hutan Dipterokarpa Ibu Kota Negara Nusantara,” STANDAR: Better Standard Better Living, vol. 1, pp. 5-15, 2022.
-
[4] R. Satria, Royana Afwani, and Sri Endang Anjarwani, “Rancang Bangun Sistem Informasi Geografis Untuk Pemetaan Lokasi Tempat Ibadah Di Kota Mataram Menggunakan Metode Extreme Programming: Design of Geographic Information System For Mapping The Location of Worship in Mataram City Using Extreme Programming Method,” J-Cosine, vol. 5, no. 2, pp. 111-119, Dec. 2021, doi: 10.29303/jcosine.v5i2.395.
-
[5] Garaika, Fauzi, and M. Muslihudin, “Pengenalan Mobile Commerce Pada Anggota Koperasi Gentiaras Untuk Meningkatkan Penghasilan Rumah Tangga,” DINAMISIA, vol. 4, no. 2, pp. 300-305, 2020, doi: 10.31849/dinamisia.v4i2.3881.
-
[6] Fauzi, M. Muslihudin, and S. Mukodimah, “Pelatihan Komputer dan Operasional Pemeliharaan Cluster Kotaku Kabupaten Pringsewu,” JurnalPkM, vol. 3, no. 4, pp. 117– 125, Oct. 2022, doi: 10.56327/jurnalpkm.v3i4.62.
-
[7] Fauzi, A. N. Candra, and Kasmi, “Aplikasi Ecommerce Berbasis Business to Consumer Sebagai Penjualan Produk Makanan Ringan Khas Pringsewu,” Jurnal Signaling, vol. 8, no. 1, pp. 29–34, 2019, doi: 10.56327/signaling.v8i1.750.
-
[8] A. Suryana and S. Ipnuwati, “Perspective Text Mining Analytics Intelegent Information Extraction for Impect of Indonesian Social Media,” in International Conference On Information Technology And Business, 2015, pp. 100–113. [Online]. Available:
https://jurnal.darmajaya.ac.id/index.php/icitb/article/view/437
-
[9] A. Suryana and F. Rizki, “Sistem Informasi Desa Ngarip Berbasis Web Kabupaten Tanggamus Lampung,” Technology Acceptance Model (TAM), vol. 2, pp. 53–57, 2014, doi: 10.56327/jurnaltam.v2i0.19.
-
[10] A. Khumaidi, A. Suryana, and E. Ridhawati, “Perencanaan Strategi Sistem Informasi dan Teknologi Informasi pada STMIK Pringsewu dengan Menggunakan Metodologi Enterprise Architecture Planning (EAP),” in Seminar Nasional Teknologi dan Multimedia, 2016, pp. 1–
-
6. [Online]. Available:
https://ojs.amikom.ac.id/index.php/semnasteknomedia/article/view/1244
-
[11] Y. Galahartlambang, T. Khotiah, and Jumain, “Visualisasi Data Dari Dataset COVID-19 Menggunakan Pemrograman Python,” intech, p. 8, 2022, doi:
https://doi.org/10.46772/intech.v3i01.417.
-
[12] F. T. Br Sitepu, V. A. Sirait, and R. Yunis, “Analisis Runtun Waktu Untuk Memprediksi Jumlah Mahasiswa Baru Dengan Model Prophet Facebook,” Jurnal Sistem Informasi, Teknik Informatika, Software Engineering, dan Multimedia, vol. 23, no. 1, Mar. 2021, doi: 10.31294/p.v23i1.9756.
-
[13] A. D. Widiantoro, A. Wibowo, and B. Harnadi, “User Sentiment Analysis in the Fintech OVO Review Based on the Lexicon Method,” in 2021 Sixth International Conference on Informatics and Computing (ICIC), 2021, pp. 1–4. doi: 10.1109/ICIC54025.2021.9632909.
-
[14] A. Widiastuti, E. W. Nugroho, and A. D. Y. Widiantoro, “The Information Systems of Boarding House Search Application In Soegijapranata Catholic University Semarang Based On Android,” JBT, vol. 1, no. 1, p. 16, Apr. 2021, doi: 10.24167/jbt.v1i1.3223.
-
[15] M. Sholeh and D. Andayati, “Machine Linear untuk Analisis Regresi Linier Biaya Asuransi Kesehatan dengan Menggunakan Python Jupyter Notebook,” JEPIN (Jurnal Edukasi dan Penelitian …, vol. 8, no. 1, p. 8, 2022, doi: http://dx.doi.org/10.26418/jp.v8i1.
-
[16] R. Wati and S. Ernawati, “Analisis Sentimen Persepsi Publik Mengenai PPKM Pada Twitter Berbasis SVM Menggunakan Python,” JTIUST, vol. 6, pp. 240–247, Nov. 2021, doi: 10.54367/jtiust.v6i2.1465.
-
[17] M. Ma’rufi and M. F. Asnawi, “Algoritma Evolusi Genetika Sebagai Fungsi Optimasi Jaringan Saraf Buatan,” device, vol. 11, no. 1, pp. 25–33, May 2021, doi:
10.32699/device.v11i1.1783.
-
[18] E. Retnoningsih and R. Pramudita, “Mengenal Machine Learning Dengan Teknik Supervised Dan Unsupervised Learning Menggunakan Python,” BIICT, vol. 7, no. 2, p. 156, Dec. 2020, doi: 10.51211/biict.v7i2.1422.
-
[19] A. F. Rahma, Agussalim, and Dhian Satria Yudha Kartika, “Analisis Sentiman Hashtag Kuliner di Indonesia Menggunakan Naive Bayes,” JIFoSI, vol. 2, no. 1, pp. 19–25, Mar. 2021, doi: 10.33005/jifosi.v2i1.282.
-
[20] S. C. Dewi, H. Bunyamin, and S. Budi, “Penerapan Data Science pada Analisis Data Acara TV dan Film pada Aplikasi Layanan Streaming,” Strategi, vol. 4, pp. 125–133, 2022.
-
[21] I. H. Muna, “Exploratory Data Analysis Grup Chat Whatsapp Mata Kuliah Manajemen Pembiayaan Pendidikan (Studi Kasus di Pascasarjana Universitas Negeri Semarang),” JLE, vol. 2, no. 1, pp. 44–49, May 2021, doi: 10.51402/jle.v2i1.32.
-
[22] D. Ramandhany and Y. N. Kunang, “Visualisasi Heat Map Data Kecelakaan Di Kota Palembang,” Bina Darma Conference on Computer Science, pp. 304–311, 2021.
-
[23] M. A. F. Nugroho, Y. W. Syaifudin, and D. Puspitasari, “Penentuan Jarak Terpendek Menggunakan Metode Dijkstra Pada Data Spasial Openstreetmap (Studi Kasus : Pada Perusahaan Pengantaran Barang Wahana Logistik Kota Malang),” SMATIKA, vol. 9, no. 01, pp. 45–50, Apr. 2019, doi: 10.32664/smatika.v9i01.265.
-
[24] I. D. K. L. Digita and K. O. Sanjaya, “Perancangan Sistem Informasi Analisa Kredit Berbasis Web Menggunakan Metode AHP (Studi Kasus: LPD Desa Adat Sumerta),” RESI: Jurnal Riset Sistem Informasi, vol. 1, pp. 10–20, Jul. 2022, doi:
https://doi.org/10.32795/resi.v1i1.2945.
-
[25] L. D. Wea, E. Mera, M. I. Suriaty, and D. Nasvia, “Penerapan Visualisasi Tentang Vaksin
Covid 19 Menggunakan Pendekatan Bahasa Daerah Manggarai Sebagai Upaya Meningkatkan Kesiapan Masyarakat Menerima Vaksin,” Creat J. Cumn Enga, vol. 5, no. 2, pp. 472-478, Feb. 2022, doi: 10.33024/jkpm.v5i2.4675.
-
[26] S. L. T. A. Pamungkas, A. D. Widiantoro, and H. Prasetya, “Geographical Information System Complaints on Damage to Roads and Bridges in Semarang City,” JBT, vol. 1, no. 3, pp. 104-109, Feb. 2022, doi: 10.24167∕jbt.v1i3.4351.
-
[27] I. A. U. Dewi, I. K. N. A. Jaya, and I. D. K. L. Digita, “Sistem Informasi Geografis (SIG)
Sebaran LPD Di Kota Denpasar Berbasis Web Menggunakan Framework Laravel,” KARMAPATI - Kumpulan Artikel Mahasiswa Pendidikan Teknik Informatika, vol. 2 No 3, pp. 224-232, 2022, doi: https://doi.org/10.23887/karmapati.v11i3.54546.
-
[28] N. Khairu Nissa, Y. Nugraha, C. F. Finola, A. Ernesto, J. I. Kanggrawan, and A. L.
Suherman, “Evaluasi Berbasis Data: Kebijakan Pembatasan Mobilitas Publik dalam Mitigasi Persebaran COVID-19 di Jakarta,” JSC, vol. 3, no. 2, pp. 84-94, Aug. 2020, doi: 10.37396/jsc.v3i2.77.
Data Visualization Of House Of Worship Distribution In The IKN Nusantara Region Using 12
Python (I Kadek Noppi Adi Jaya)
Discussion and feedback