Analysis of Cyberbullying Level using Support Vector Machine Method
on
JURNAL ILMIAH MERPATI VOL. 10, NO. 2 AUGUST 2022
p-ISSN: 2252-3006
e-ISSN: 2685-2411
Analysis of Cyberbullying Level using Support Vector Machine Method
Ngurah Indra Purnayasaa1, I Made Agus Dwi Suarjayaa2, I Putu Arya Dharmaadia3 aInformation Technology Study Program, Faculty of Engineering, Udayana University Bukit Jimbaran, Bali, Indonesia, phone. (0361) 701606 e-mail: 1indrapurnayasaa@gmail.com, 2agussuarjaya@it.unud.ac.id, 3aryadharmaadi@unud.ac.id
Abstrak
Pengguna internet di Indonesia meningkat setiap tahunnya. Peningkatan tersebut disebabkan oleh beberapa faktor, seperti infrastruktur internet di Indonesia yang semakin merata. Internet memiliki dampak positif bagi penggunanya seperti mempermudah komunikasi antar individu, adapun dampak negatif dari internet yaitu intimidasi terhadap seseorang atau yang dikenal dengan cyberbullying. Cyberbullying sangat berdampak pada kesehatan mental seseorang yang menyebabkan korban sering marah, depresi, dan cemas. Penelitian ini bertujuan untuk mengukur tingkat cyberbullying di Indonesia pada media sosial Twitter dengan menggunakan metode TF-IDF dan Support Vector Machine. Klasifikasi pada penelitian ini diklasifikasikan menjadi cyberbullying dan non-cyberbullying. Data twitter yang digunakan pada penelitian ini sebanyak 3.344.782 data tweet yang menghasilkan tingkat klasifikasi cyberbullying sebesar 34,59% dan ingkat klasifikasi non-cyberbullying 65,41%. Nilai akurasi terbaik yang didapatkan yaitu sebesar 85%.
Kata kunci: Cyberbullying, Internet, Support Vector Machine, Twitter, TF-IDF
Abstract
Internet users in Indonesia is increasing in every year. The increase caused by several factors, such as the increasingly even distribution of internet infrastructure in Indonesia. The internet has a positive impact such as facilitating communication between individuals, while the negative impact of the internet is intimidation to someone or known as cyberbullying. Cyberbullying has a huge impact on mental health person, causing victim to be angry, depressed, and anxious. This research aims to measure the level of cyberbullying in Indonesia on Twitter using TF-IDF and Support Vector Machine. Classification in this study is classified into two classes, namely cyberbullying and non-cyberbullying. Twitter data used in this study were 3,344,782 tweets that resulted in a cyberbullying classification level of 34.59% and a noncyberbullying classification level of 65.41%. The best accuracy value obtained is 85%.
Keywords : Cyberbullying, Internet, Support Vector Machine, Twitter, TF-IDF
The number of internet users in Indonesia is increasing every year, until the second quarter of 2020 it reaches 73,7% of the total population. Several factors that affect the increase in internet users such as an increasingly equitable internet infrastructure, online learning, and working from home [1]. The internet has a huge impact on daily activities. The positive impact of the internet users is that the facilitates communication between individuals who are in different places, besides that it makes easier for business people to market their products because the internet can be reached by many people. The negative impact of the internet for its users is a decrease in one's desire to socialize with the surrounding environment, the spread of hoax news, and acts of humiliation against someone through comments on social media or what is known as cyberbullying [2].
Cyberbullying is an act of humiliation against an individual in cyberspace [3]. Cyberbullying has an impact on the victim mentality which results in trauma so that the person is often angry, depressed, anxious, afraid, and embarrassed [2]. This can make the victim of
cyberbullying avoid the surrounding environment, take revenge on the perpetrator, and become the perpetrator of the cyberbullying [4]. The development of information technology produces large amounts of data every day or what is known as Big Data [5]. Big data is a massive data set that has a large and complex structure so that a method is needed to process data [6]. The biggest source of Big Data is on social media like Facebook and Twitter. Research related to Big Data analysis can be done using several methods such as Decision Tree, Naïve Bayes, and Support Vector Machine.
Research related to the classification of cyberbullying comments on Instagram social media uploaded by artists. The method used in this study is K-Nearest Neighbor using 1000 comments data which is divided into 500 bullying data and 500 non bullying data. The results of this study obtained the highest accuracy value of 77% with a comparison of 90% of training data and 10% of test data [7].
Other research is related to the design of an English-language cyberbullying comment detection system. The method used in this study is Naïve Bayes with the classification results in the form of bully and non-bully comments obtained from the highest probability value. This study resulted in an accuracy value of 80% [8].
Research related to the comparison of the Support Vector Machine, K-Nearest Neighbor, and Naïve Bayes classification methods on the level of bully behavior on the Whatsapp application shows the Support Vector Machine method gets the best accuracy value of 81.58% [9].
This study aims to measure the level of cyberbullying in Indonesia by analyzing tweet data from social media Twitter. The classification in this study is divided into cyberbullying and non-cyberbullying. This method uses in this research are TF-IDF and Support Vector Machine.
The research methodology used in analyzing the level of cyberbullying in Indonesia using the Support Vector Machine method is shown in Figure 1.
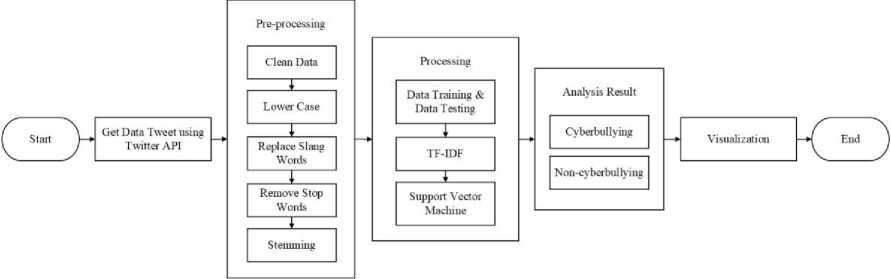
Figure 1. Research Methodology
-
Figure 1 is the furrow of this research which begins from collecting tweet data from Twitter using the Twitter API which is used as training data and testing data. Collecting tweet data using an engine made with Python, then the tweet data is stored in the MongoDB.
The next stage is data pre-processing, which begins with retrieving tweet data from the MongoDB database, then clean data, lower case, replace slang words, remove stop words, and stemming. Tweet data that has gone through the pre-processing process is then stored in the MongoDB.
The next stage is to retrieve 2000 tweet data to be manually labeled which is used as training data which is stored in a file with the CSV extension. The next stage is to determine the classification model using training data that already contains the classification label which is tested using TF-IDF and Support Vector Machine. The classification model is used in the cyberbullying analysis stage. The next stage of cyberbullying analysis starts from taking tweet data from the MongoDB and then tested using TF-IDF and Support Vector Machine to determine the classification class of tweet data based on training data that has been given a
label. The results of the data analysis are cyberbullying and non-cyberbullying classes, then stored in MongoDB.
The last stage is visualization which begins from retrieving tweet data in the MongoDB that has been analyzed, then visualized using Tableau by determining the required filters and measures.
Cyberbullying is an act of humiliation or threat to someone on social media. Cyberbullying can take the form of repeatedly sending text messages to someone, shaming someone on social media, and insulting someone using a fake account. Several factors cause perpetrators to take cyberbullying actions such as revenge against victims, in addition to getting their own pleasure [10]. Cyberbullying has a huge impact on the mental health of teenagers because at that age teenagers have unstable emotions so they are prone to mood swings when they receive the influence of an unhealthy environment. The resulting impact causes the victim to experience anxiety, anger, fear, avoid social environment, and depression [2].
Twitter is a social networking service in the form of micro-blogging which was originally created as a short message service to facilitate communication in small groups [11]. Twitter is one of the most popular social media in Indonesia, reaching 78 million users from the total population in Indonesia [12].
Python is a script-based programming language that can be used to develop software. Python has several advantages, such as facilitate for data scientists to analyze data to obtain calculations and visualize data more efficiently [13]. Python provides libraries that can be used to simplify the data analysis process such as Pandas and Scikit Learn [14].
Term Frequency-Inverse Document Frequency (TF-IDF) is a process to calculate the weight of each word that has been extracted. This method is a combination of Term Frequency calculation which is word weighting based on the number of occurrences of words in a document and Inverse Document Frequency which is a calculation based on the number of words that appear throughout the document to determine how common the word is [15]. The TF value will be high if the frequency of words in the document is high and the frequency of documents containing these words is low in the document set [16]. The TF value can be calculated using equation (1).
w is the word that appears in the document. d is the number of documents in the dataset. fw,d is the word frequency in the entire document. The IDF value can be calculated using equation (2).
N is a document in a dataset. w is the word that appears in the document. D is a collection of all documents. f(w, D) is the word frequency w in the entire document set. The TF-IDF value can be calculated using equation (3).
Support Vector Machine is an algorithm capable of analyzing data and identifying patterns [3]. SVM includes a supervised learning method that performs learning on data that has labels to determine the pattern used for the classification process on test data [17]. SVM performs the classification process by determining the best hyperplane that separates two or
more classes by maximizing the margin between classes [18]. Margin is the distance between the hyperplane and the closest data from each class. SVM has several kernels that aim to classify data that cannot be classified linearly. Kernal contained in SVM such as Linear, Polynomial, and RBF [19]. There is a decision function as in equation (4).
Based on the decision function, it is assumed that the two classes are separated by a hyperplane, so that the equations and inequalities are obtained which are used to determine the hyperplane as a function for classification.
After getting the equation from the hyperplane, the equation is entered into the decision function sign(f(X)) as in equation (8).
Equation (8) is the pattern used to determine the classification of the testing data. If the result of the decision function is 1, then it produces a positive classification. If the result of the decision function is -1, then it results in a negative classification.
Confusion matrix is a measurement method to determine the quality of the classification model.
Table 1. Confusion Matrix
|
Actual |
Prediction Positive Prediction Negative Prediction |
|
Positive Actual |
TP FN |
|
Negative Actual |
FP TN |
A dataset that has two classes, the first class is positive and the second class is negative. The TP value is obtained from the number of positive and predicted positive data. The TN value is obtained from the number of negative data and is predicted to be negative. The FP value is obtained from the number of negative data, but is predicted to be positive. The FN value is obtained from the number of positive data, but is predicted to be negative [20]. The results of the calculation of the confusion matrix are accuracy, precision, recall, and f1score. The accuracy value is a calculation process to determine how accurate the correct prediction results are from the total data. The accuracy value can be calculated using equation (9).
accuracy =
TP+TN
TP+TN+FP+FN
(9)
The precision value is a calculation process to determine the ratio of the prediction of a true positive class to the number of data that is predicted to be positive. The precision value can be calculated using equation (10).
precision =
(10)
The recall value is a calculation process to determine the ratio of the predictions of the true positive class to the number of data that are actually positive. The recall value can be calculated using equation (11).
recall =
TP
TP+FN
(11)
The f1score value is a calculation process to calculate the average comparison of precision and recall. The f1score value can be calculated using equation (12).
ZxRecallxPrecision f1score =
(12)
Recall+Precision
Data was collected from Twitter social media using the Twitter API starting from June 2021 – April 2022. The keywords used were “goblok”, “tolol”, “bego”, and “brengsek” which were obtained from an interview with a Clinical Psychologist, Devy Hestiwana, S. Psi., M. Psi., Psychologist.
Table 2. Results of Data Collection
Tweet
@thsetya Ga juga. Cantik tapi bego sama aja bikin ilfill. Diajak ngobrol malah haheho ga punya Wawasan @
@Rizmaya__ @jokowi Masih aja belum sadar tapi Mau bilang TOLOL dan BEGO takut bikin batal puasa ..
@Askrlfess Bucin boleh, bego jangan
@daiIymahesa Yg ngetweet pacar lo bego
RT @setian_11: Sadar ga klo cinta membuat lu menjadi tolol kadang goblok dan bego.
Data preprocessing is a series of data processing steps that aim to clean up the text on tweet data in order to simplify the cyberbullying analysis process. Preprocessing data consists of cleaning data, lowering case, replace slang words, remove stop words, and stemming.
|
Table 3. Preprocessing Results | ||
|
Data Tweet |
Preprocessing |
Results |
|
Cleaning |
Sadar ga klo cinta membuat lu menjadi tolol kadang goblok dan bego | |
|
RT @setian_11: Sadar ga klo cinta membuat lu menjadi tolol kadang goblok dan bego. |
Lowering Case |
sadar ga klo cinta membuat lu menjadi tolol kadang goblok dan bego |
|
Slang Word |
sadar tidak kalau cinta membuat kamu menjadi tolol kadang goblok dan bego | |
|
Stop Word |
sadar tidak cinta membuat kamu tolol kadang goblok bego | |
|
Stemming |
sadar tidak cinta buat kamu tolol kadang goblok bego | |
Training data is data that already has a classification label that is used as learning material from a classification method to determine the appropriate model for analyzing cyberbullying. The classification label on the training data is given manually to the tweet data that has been cleaned. The classification labels are cyberbullying and non-cyberbullying.
Table 4. Training Data
Text Label
pernah sayang sama orang sampai goblok orangnya hilang Non-cyberbullying
gobloknya tidak
kamu memang goblok kalau cowoknya sudah bertingkah seperti itu sebaiknya diputusin aja lemah banget kamu
Cyberbullying
Table 4 is an example of training data that has been given a classification label. The training data used in this study is 2000 data which is divided into 1000 data with cyberbullying classification class and 1000 data with non-cyberbullying classification class.
Classification model testing is carried out on training data which aims to determine the best classification model to be used in the cyberbullying analysis process using the TF-IDF and Support Vector Machine methods. There are 4 scenarios in the test to get accuracy, precision, recall, and f1score values. The following is a training data test scenario.
Tabel 5. Scenarios of Testing Training Data
|
Amount of Data |
Training Data |
Testing Data |
Accuracy |
Precision |
Recall |
F1score |
|
2000 |
90% |
10% |
85% |
90% |
80% |
85% |
|
2000 |
80% |
20% |
83% |
88% |
76% |
82% |
|
2000 |
70% |
30% |
82% |
87% |
78% |
82% |
|
2000 |
60% |
40% |
82% |
86% |
77% |
81% |
Table 5 is a test scenario on training data. The test was carried out 4 times and got the best results on the model that uses a comparison of 90% training data and 10% testing data with an accuracy value of 85%, precision value 90%, recall value 80%, and an f1score value of 85%. Compared to previous studies, implementation of Support Vector Machine method in this study was able to produce a higher accuracy value.
Processing data is the stage of data analysis using the TF-IDF method and the Support Vector Machine. The application of this method uses the Scikit Learn library. The kernel used in the Support Vector Machine method is Linear Kernel.
_id: ObjectId(,624ad3fcdcfa02dl46f6006d,) date: "Tue Jun Ol 17:06:07 +0000 2021" full_text: "gila bener fandom ter anjing panas heran njir btw album jaman baheula _." klasifikasi: "Non-cyberbullying" location: "Jawa Barat" language: "in"
_id: ObjectId (,624ad3fddcfaC2dl4 6f602aa,) date: "Tue Jun 01 13:37:13 +0000 2021" full_text: "coba kamu kaca lihat wajah kamu tolol dungu mending nambah follower gi_." klasifikasi: "Cyberbullying" location: "Jambi" language: "in"
-
Figure 2. Cyberbullying Analysis Results
-
Figure 2 is the result of the cyberbullying analysis. Cyberbullying analysis was carried out on tweet data using a classification model that had been tested and training data used as a source for the classification method in determining the classification class.
Data visualization is the stage to visualize the analyzed data in the form of line graphs and maps. Visualization aims to obtain information clearly and efficiently from the results of the analysis that has been carried out. The tweet data used in this visualization is data from June 2021 to April 2022.
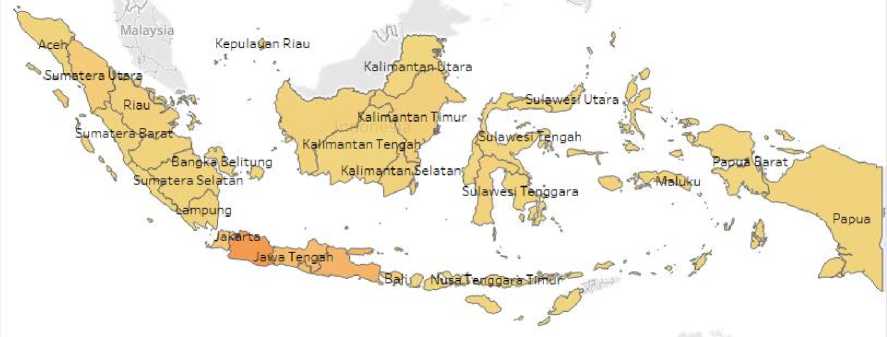
Figure 3. Visualization of Cyberbullying Classification Data on the Map of Indonesia
Figure 3 describes the visualization of cyberbullying classification data in Indonesia. The visualization results show that the highest classification of cyberbullying is in Jakarta with a total of 37,651 tweets.
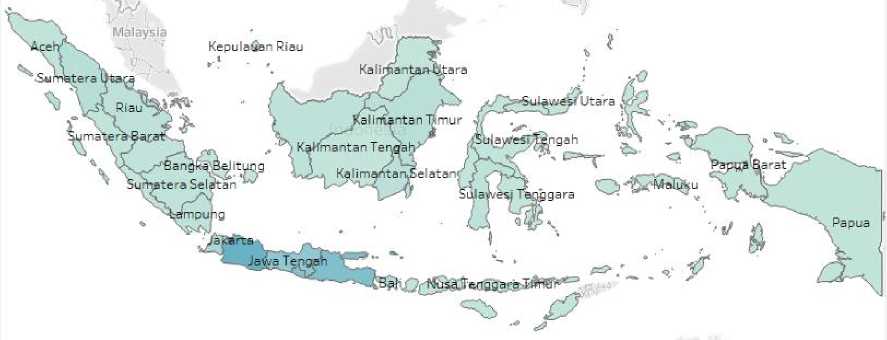
Figure 4. Visualization of Non-cyberbullying Classification Data on the Map of Indonesia
Figure 4 describes the visualization of non-cyberbullying classification data in Indonesia. The visualization results show that the highest non-cyberbullying classification is in Jakarta with a total of 57,696 tweets.
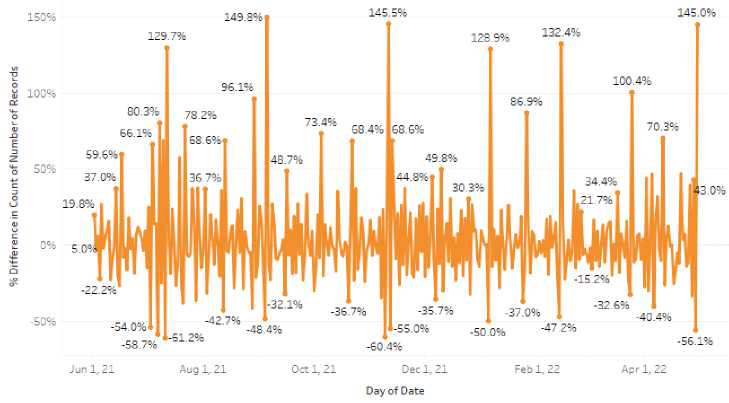
Figure 5. Visualization of Cyberbullying Classification Data in Line Graph Form
Figure 5 describes the results of cyberbullying analysis data visualization in the form of a line from June 2021 to April 2022. A significant increase in tweets with cyberbullying classification that occurred on September 5, 2021, amounted to 149.8%.
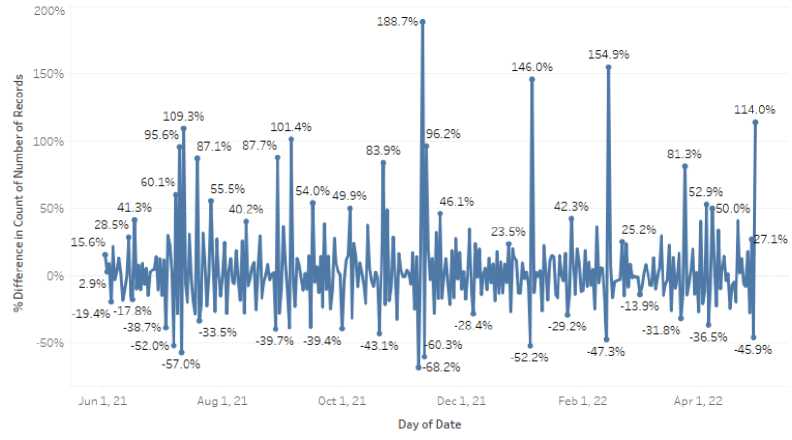
Figure 6. Visualization of Non-cyberbullying Classification Data in Line Graph Form
Figure 6 describes the results of the visualization of cyberbullying analysis data in the form of a line from June 2021 to April 2022. The significant increase in tweets with noncyberbullying classification that occurred on November 11, 2021 was 188.7%.
The difference between this study with previous research is the level of cyberbullying in each region in Indonesia. There are 34 provinces in Indonesia which is shown in Table 6.
Table 6. Level of Cyberbullying in each region in Indonesia
|
Province |
Cyberbullying |
Non-cyberbullying | ||
|
Level |
Total |
Level |
Total | |
|
Aceh |
40,19% |
764 |
59,81% |
1.137 |
|
Sumatera Utara |
43,18% |
2.666 |
57,82% |
3.655 |
|
Sumatera Barat |
39,08% |
791 |
60,92% |
1.233 |
|
Riau |
39,06% |
1.357 |
60,94% |
2.117 |
|
Jambi |
38,80% |
483 |
61,20% |
762 |
|
Kepulauan Riau |
40,32% |
350 |
59,68% |
518 |
|
Bengkulu |
36,36% |
4 |
63,64% |
7 |
|
Sumatera Selatan |
34,17% |
732 |
65,83% |
1.410 |
|
Bangka Belitung |
31,36% |
90 |
68,64% |
197 |
|
Lampung |
34,82% |
1.189 |
65,18% |
2.226 |
|
Banten |
33,44% |
3.479 |
66,56% |
6.925 |
|
Jakarta |
39,49% |
37.651 |
60,51% |
57.696 |
|
Jawa Barat |
34,49% |
14.708 |
65,51% |
27.941 |
|
Jawa Tengah |
27,47% |
6.290 |
72,53% |
16.607 |
|
Yogyakarta |
24,04% |
6.106 |
75,96% |
19.289 |
|
Jawa Timur |
28,07% |
8.344 |
71,93% |
21.386 |
|
Bali |
33,43% |
3.070 |
66,57% |
6.112 |
|
Nusa Tenggara Barat |
32,33% |
50 |
67,67% |
80 |
|
Nusa Tenggara Timur |
43,47% |
313 |
56,53% |
407 |
|
Kalimantan Barat |
35,09% |
1.048 |
64,91% |
1.939 |
|
Kalimantan Tengah |
34,99% |
281 |
65,01% |
522 |
|
Kalimantan Selatan |
29,37% |
1.048 |
70,63% |
2.520 |
|
Kalimantan Timur |
35,36% |
1.607 |
64,64% |
2.938 |
|
Kalimantan Utara |
29,26% |
67 |
70,74% |
162 |
|
Sulawesi Barat |
39,33% |
35 |
60,67% |
54 |
|
Sulawesi Selatan |
38,69% |
1.238 |
61,31% |
1.962 |
|
Sulawesi Tenggara |
37,42% |
122 |
62,58% |
204 |
|
Sulawesi Tengah |
35,95% |
174 |
64,05% |
310 |
|
Gorontalo |
28,76% |
67 |
71,24% |
166 |
|
Sulawesi Utara |
32,34% |
184 |
67,66% |
385 |
|
Maluku Utara |
35,15% |
58 |
64,85% |
107 |
|
Maluku |
59,34% |
661 |
40,66% |
453 |
|
Papua |
38,51% |
694 |
61,49% |
1.108 |
|
Papua Barat |
35,84% |
148 |
64,16% |
265 |
Table 6 describes data from each province in Indonesia. The location data from Twitter user that is detected only according to the name of the province in Indonesia so that not all data whose location can be detected. The level of cyberbullying is highest in Maluku at 59,34% and the level of non-cyberbullying is highest in Yogyakarta at 75,96%. Based on the amount of analyzed data, Jakarta obtains the highest level of cyberbullying and noncyberbullying.
This study uses tweet data as much as 3,344,782 tweet data obtained from June 2021 to April 2022 regarding tweets containing words related to cyberbullying in Indonesia. The results of the cyberbullying analysis showed 34.59% tweets classified as cyberbullying and 65.41% tweets classified as non-cyberbullying. The method implemented in this research is TF-IDF and Support Vector Machine which produces the best accuracy value of 85% on training data testing of 2,000 data. A significant increase in tweets in the cyberbullying classification occurred on September 5, 2021, which was 149.8% and a significant increase in tweets in the non-cyberbullying classification occurred on November 11, 2021, which was 188.7% .
Suggestions for research development are to use data from social media such as Instagram and Youtube, as well as optimize the preprocessing stage so that the results of implementing the classification method are better.
References
-
[1] APJII, “Buletin APJII,” Asosiasi Penyelenggara Jasa Internet Indonesia. p. 1, 2020. [Online]. Available: https://apjii.or.id/content/read/104/503/BULETIN-APJII-EDISI-74---November-2020
-
[2] F. S. Ningrum and Z. Amna, “Cyberbullying Victimization dan Kesehatan Mental pada Remaja,” Insa. J. Psikol. dan Kesehat. Ment., vol. 5, no. 1, p. 35, 2020, doi: 10.20473/jpkm.v5i12020.35-48.
-
[3] W. A. Prabowo and F. Azizah, “Sentiment Analysis for Detecting Cyberbullying Using TF-IDF and SVM,” RESTI J., no. 10, pp. 11–12, 2020.
-
[4] A. Sukmawati and A. P. B. Kumala, “Dampak Cyberbullying Pada Remaja,” Alauddin Sci. J. Nurs., vol. 1, no. 1, pp. 55–65, 2020, [Online]. Available: http://journal.uin-alauddin.ac.id/index.php/asjn/article/download/17648/9946
-
[5] E. R. E. Sirait, “Implementasi Teknologi Big Data Di Lembaga Pemerintahan Indonesia,” J. Penelit. Pos dan Inform., vol. 6, no. 2, p. 113, 2016, doi: 10.17933/jppi.2016.060201.
-
[6] R. A. Wildan, R. A. Rajagede, and R. Rahmadi, “Analisis Sentimen Politik Berdasarkan Big Data dari Media Sosial Youtube : Sebuah Tinjauan Literatur,” Automata, vol. 2, 2021.
-
[7] R. M. Candra and A. Nanda Rozana, “Klasifikasi Komentar Bullying pada Instagram Menggunakan Metode K-Nearest Neighbor,” IT J. Res. Dev., vol. 5, no. 1, pp. 45–52, 2020, doi: 10.25299/itjrd.2020.vol5(1).4962.
-
[8] J. Pardede, “Deteksi Komentar Cyberbullying Pada Media Sosial Berbahasa Inggris Menggunakan Naïve Bayes Classification,” J. Inform., vol. 7, no. 1, pp. 46–54, 2020, doi: 10.31311/ji.v7i1.6920.
-
[9] I. Saputra and D. Rosiyadi, “Perbandingan Kinerja Algoritma K-Nearest Neighbor, Naïve
Bayes Classifier dan Support Vector Machine dalam Klasifikasi Tingkah Laku Bully pada Aplikasi Whatsapp,” Fakt. Exacta, vol. 12, no. 2, p. 101, 2019, doi:
10.30998/faktorexacta.v12i2.4181.
-
[10] Z. Malihah and A. Alfiasari, “Perilaku Cyberbullying pada Remaja dan Kaitannya dengan Kontrol Diri dan Komunikasi Orang Tua,” J. Ilmu Kel. dan Konsum., vol. 11, no. 2, pp. 145–156, 2018, doi: 10.24156/jikk.2018.11.2.145.
-
[11] N. A. Paramastri and G. Gumilar, “Penggunaan Twitter Sebagai Medium Distribusi Berita dan News Gathering Oleh Tirto.Id,” J. Kaji. Jurnalisme, vol. 3, no. 1, p. 18, 2019, doi: 10.24198/jkj.v3i1.22450.
-
[12] N. Fitriyah, B. Warsito, and D. A. I. Maruddani, “Analisis Sentimen Gojek Pada Media Sosial Twitter Dengan Klasifikasi Support Vector Machine (Svm,” J. Gaussian, vol. 9, no. 3, pp. 376–390, 2020, doi: 10.14710/j.gauss.v9i3.28932.
-
[13] B. D. Prasetya, F. S. Pamungkas, and I. Kharisudin, “Pemodelan dan Peramalan Data Saham dengan Analisis Time Series menggunakan Python,” Prism. Pros. Semin. Nas. Mat., vol. 3, pp. 714–718, 2020, [Online]. Available: https://journal.unnes.ac.id/sju/index.php/prisma/ ISSN
-
[14] M. Sholeh, R. Y. Rachmawati, and E. N. Cahyo, “Penerapan Regresi Linear Ganda Untuk Memprediksi Hasil Nilai Kuesioner Mahasiswa Dengan Menggunakan Python,” J. Din. Inform., vol. 11, no. 1, pp. 13–24, 2022.
-
[15] P. WiraBuana, S. Jannet D.R.M., and I. Ketut Gede Darma Putra, “Combination of K-Nearest Neighbor and K-Means based on Term Re-weighting for Classify Indonesian News,” Int. J. Comput. Appl., vol. 50, no. 11, pp. 37–42, 2012, doi: 10.5120/7817-1105.
-
[16] H. Tantyoko, Adiwijaya, and U. N. Wisesty, “Perbandingan Pembobotan Untuk klasifikasi Topik Berita Menggunakan Decision Tree.” 2019.
-
[17] A. M. Pravina, I. Cholissodin, and P. P. Adikara, “Analisis Sentimen Tentang Opini Maskapai Penerbangan pada Dokumen Twitter Menggunakan Algoritme Support Vector Machine (SVM),” J. Pengemb. Teknol. Inf. dan Ilmu Komput., vol. 3, no. 3, pp. 2789– 2797, 2019, [Online]. Available: http://j-ptiik.ub.ac.id
-
[18] N. W. E. Rosiana Dewi, I. G. Aris Gunadi, and G. Indrawan, “Detection of Class Regularity with Support Vector Machine methods,” Lontar Komput. J. Ilm. Teknol. Inf., vol. 11, no. 1, p. 20, 2020, doi: 10.24843/lkjiti.2020.v11.i01.p03.
-
[19] I. K. G. D. Putra, N. P. A. O. Wiastini, K. S. Wibawa, and I. M. S. Putra, “Identification of Skin Disease Using K-Means Clustering, Discrete Wavelet Transform, Color Moments and Support Vector Machine,” Int. J. Mach. Learn. Comput., vol. 10, no. 5, pp. 700–706, 2020, doi: 10.18178/ijmlc.2020.10.5.993.
-
[20] I. Nur Fakhri, Jondri, and R. Febrian Umbara, “Analisis Sentimen pada Kuisioner Kepuasan Terhadap Layanan dan Fasilitas Kampus Universitas Dengan Menggunakan Klasifikasi Support Vector Machine (SVM),” e-Proceeding Eng., vol. 6, no. 2, pp. 8682– 8691, 2019.
Analysis of Cyberbullying Level using Support Vector Machine Method
(Ngurah Indra Purnayasa)
90
Discussion and feedback