Design and Development of Android-Based Indoor Wi-Fi Site Survey Application
on
JURNAL ILMIAH MERPATI VOL. 9, NO. 3 DECEMBER 2021
p-ISSN: 2252-3006
e-ISSN: 2685-2411
Design and Development of Android-Based Indoor Wi-Fi Site Survey Application
Ida Bagus Kade Taruna a1, I Made Agus Dwi Suarjayaa2, I Putu Agus Eka Pratamaa3 aDepartment of Information Technology, Faculty of Engineering, Udayana University, Bali, Indonesia
e-mail: 1gusadetaruna04@gmail.com, 2agussuarjaya@it.unud.ac.id, 3eka.pratama@unud.ac.id
Abstrak
Pada teknologi jaringan nirkabel atau Wi-Fi dalam suatu bangunan, ditemukan adanya banyak gangguan seperti gangguan pada LOS (Line of Sight), posisi access point yang tidak tepat, dan kekuatan sinyal yang rendah. Untuk mengatasi gangguan tersebut, optimasi jaringan Wi-Fi dapat dilakukan dengan survei atau analisa terhadap cakupan area dan kualitas layanan dari jaringan Wi-Fi dengan menggunakan bantuan aplikasi. Namun aplikasi yang tersedia saat ini sebagian besar merupakan aplikasi yang berbasis desktop. Penelitian ini membahas tentang perancangan dan pengembangan aplikasi mobile yang dapat digunakan untuk membantu analisa jaringan Wi-Fi pada lingkungan indoor yang dapat memberikan informasi mengenai cakupan area dari suatu jaringan Wi-Fi. Metode yang digunakan dalam pembuatan aplikasi adalah metode PDR (Pedestrian Dead Reckoning) dan klasifikasi RSSI (Receive Signal Strength Indicator). Pengujian aplikasi dilakukan dengan menggunakan dua skenario yang berbeda, dimana pada skenario pertama sumber jaringan Wi-Fi ditempatkan pada area ruang tamu, sedangkan pada skenario kedua sumber jaringan Wi-Fi ditempatkan pada area kamar tidur 2. Hasil yang didapatkan dari pengujian tersebut adalah aplikasi yang dibuat dapat memberikan informasi terkait cakupan area sinyal dari kedua posisi sumber jaringan Wi-Fi yang berbeda dalam format heatmap yang dapat dengan mudah dimengerti dan dapat dimanfaatkan untuk melakukan optimasi jaringan Wi-Fi kedepannya.
Kata kunci: Aplikasi Android, Jaringan Nirkabel, Sensor, Survei Jaringan
Abstract
In the indoor wireless network technology, it is found that there are many disturbances such as interference with LOS (Line of Sight), improper access point position, and low signal strength. To overcome these disturbances, wireless network optimization can be done by conducting a survey or analysis of the coverage area and quality of service. This analysis can be done by using an application, however available applications are mostly desktop applications, which makes surveying the indoor wireless network less efficient. This study discusses the design and development of mobile applications that can be used to analyze Wi-Fi networks in an indoor environment which can provide information about the coverage area of a Wi-Fi network. The application development uses the PDR (Pedestrian Dead Reckoning) RSSI (Receive Signal Strength Indicator) classification method. Application testing was carried out using two different scenarios, where in the first scenario the Wi-Fi network source was placed in the living room area, while in the second scenario the Wi-Fi network source was placed in the bedroom area 2. The result of the test carried out is the application can provide information regarding the coverage area of the signal from the two positions of different Wi-Fi network sources in a heatmap format that can be easily understood and can be used to optimize Wi-Fi networks in the future.
Keywords : Android Application, Wireless Network, Sensor, Network Survey
Nowadays, the development of network technology is very helpful for humans in carrying out daily activities, both in communicating and seeking information. The technology currently used is a wireless network or Wireless Fidelity (Wi-Fi). Wi-Fi stands for Wireless
Fidelity, which is a wireless communication technology that uses radio waves to connect two or more devices to exchange information [1,2]. In the indoor wireless network technology, it is found that there are many disturbances such as interference on the line of sight, improper access point position, and low signal strength [3]. To overcome this interference, wireless network optimization can be done by conducting a survey or analysis of the coverage area and quality of service [4,5]. In Wi-Fi network optimization, it does not only refer to the infrastructure installation of the access point device. However, various factors that need to be considered include the transmit power of the access point signal or room design and infrastructure that can cause signal interference from the access point to the receiving device [6–8]. There are several applications that can be used to analyze or survey the coverage and quality of service of a Wi-Fi network, but most of those applications are still desktop applications, for example applications called Ekahau Heatmapper and Netspot. Using desktop application will cause survey on Wi-Fi networks less efficient because users are required to bring a laptop device during the survey [9].
Sangkusolwong & Apavatirut have discussed research about how to predict WI-FI network quality in an indoor environment visualized using a heatmap [10]. This research produces a Java-based application that allows users to determine several parameters to predict the quality of WI-FI networks in an indoor environment such as calculating the pathloss factor, calculating the pathloss exponent, dynamically determining the indoor propagation model, and selecting the wall type for Wi-Fi network in the indoor environment.
Shah et al have discussed about steps in analyzing the quality of Wi-Fi networks and theories that can be applied in determining the quality of WI-FI networks [11]. Some of the theories outlined state that a Wi-Fi signal with a strength greater than -60dbm is an excellent signal, a Wi-Fi signal with a signal strength between 90dbm and -60dbm is a medium strength signal, and a Wi-Fi signal with a signal strength of less than -90dbm is the signal of poor quality.
Gunantara, Sudiarta, Prasetya, Dharma, and Gde Antara discussed about measuring the signal level and Wi-Fi coverage area on an IEEE 802.11 access point [12]. This research was conducted in the Dishubkominfo building and the results obtained were the differences in the Receive Signal Level (RSL) that shown by the access point used in the study, where the RSL value depends on the distance and wall attenuation. AP service quality in the service coverage area is displayed in color. Dark green indicates excellent service quality, light green indicates good service quality, and yellow indicates poor service quality.
Dewantara et al discussed about how to implement light painting photography in analyzing Wi-Fi network coverage by using Wemos D1 based devices [9]. The results of this study are photos that show the signal conditions at a point that have been analyzed with colors according to the signal conditions generated using light painting photography techniques.
Hou & Bergmann discussed about how to implement accelerometer and magnetometer sensors to detect human movement or step and estimate the direction facing [13]. This study used several devices such as glasses equipped with MCU and smart mouthguard. The results of this study indicate a comparison between the two methods used in the experiment.
Based on the explanation above, a mobile application is needed, which can be used to analyze Wi-Fi networks in a building or indoor area and also can provide information to the users about the coverage or blank spot area. Based on this background, the authors are interested in creating a mobile application for surveying indoor wireless networks. This study discusses the design and development of mobile applications that can be used to analyze wireless networks in a building or indoor environment which can provide information to the users about the coverage area or blank spot area of an indoor wireless network, where this information can be used to help optimize wireless network more easily. The application in this study was developed with Java, which is an object-oriented programming language that has compiled and interpreted types [15]. This application is expected to make surveys of Wi-Fi networks in indoor environments easier and more efficient.
The stages in this research in general can be seen in Figure 1. The proposed application system is a software that can be used to make the users conduct network surveys in the indoor environment more easily. The application development uses the PDR (Pedestrian Dead Reckoning) to detect user steps and RSSI (Receive Signal Strength Indicator) classification method to determine the colors on the floor plan. The results of the network survey
can be stored by the users to make it easier in terms of documentation. General overview of system application is displayed in Figure 1.
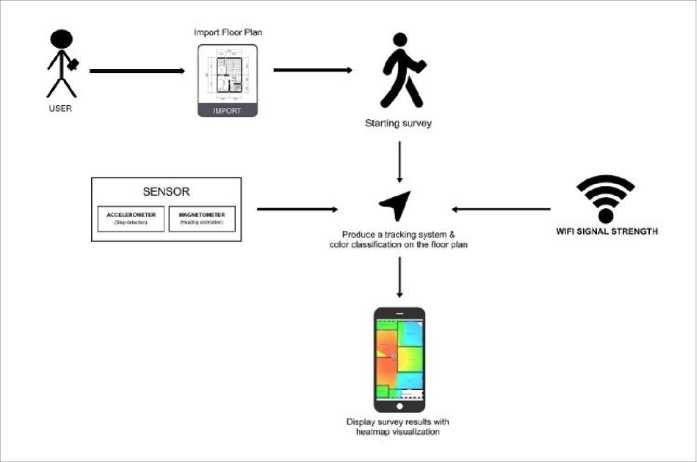
Figure 1. General overview of the system application
Figure 1 shows an overview of the system owned by the system. The user imports the floor plan that the user wants to use for survey activities into the application. After that the user starts a network survey activity in the indoor area by bringing the smartphone device to the point or area where the network quality is wanted. When the user starts the survey activity, the application will read the value of the accelerometer and magnetometer sensors on the smartphone, where if there is a change in the value of the two sensors and the value changes according to what has been configured in the application. Then, it indicates that there is movement from the smartphone which will then produce an indoor tracking system. In addition, the smartphone will also receive signal strength from WI-FI which will produce a color on the floor plan to mark an area according to the signal strength classification that specified in the application. After the user has finished surveying the WI-FI network, the user can save a floor plan of the survey results which already contains a color that indicates the WI-FI signal quality at the point or area being surveyed.
The first process is to initialize the azimuth variable, accelerometer sensor event value data and magnetometer sensor event value data. After the variable is initialized, the next step is to detect whether there is a change in the sensor data or not. If there is a change in data on the sensor, the application takes the event value from the accelerometer sensor and magnetometer sensor which will be used to convert the device coordinate system vector into a world coordinate system which is defined as a direct orthonormal basis by calculating the slope matrix and the rotation matrix. If the condition of the calculation is true, then the application takes the value of the azimuth or rotation angle on the -z axis. Direction flowchart is displayed in Figure 2.
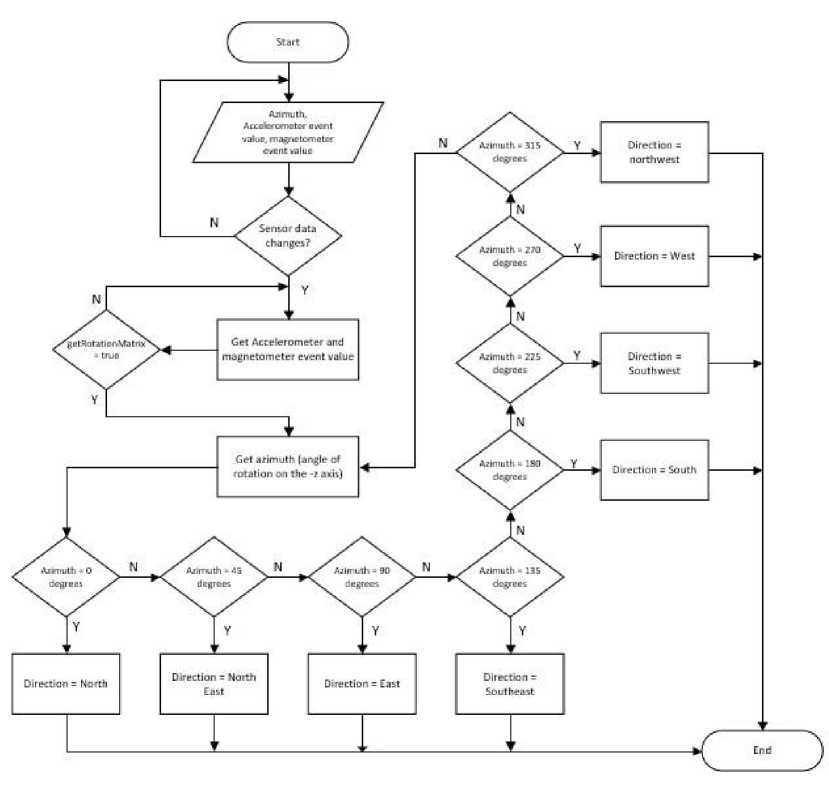
Figure 2. Direction Facing Flowchart
The first process is to initialize variables for the three axes of the accelerometer sensors and the threshold. If there is a change in the data on the sensor, the application takes the resulting accelerometer axis data, then estimates the velocity of the change. If the current estimated velocity is greater than the threshold value and the previous estimated velocity is lower or equal to the threshold, then this condition indicates that a movement has occurred, which is expressed as one footstep. Step detection flowchart is displayed in Figure 3.
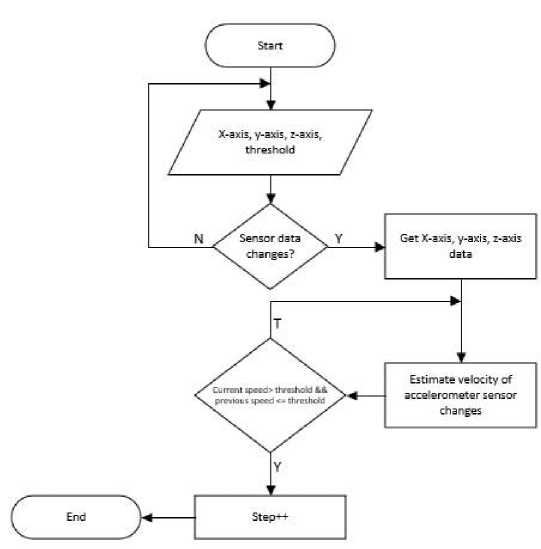
Figure 3. Step Detection Flowchart
The Literature Study discusses materials related to the Design and Development of Android-Based Indoor Wi-Fi Site Survey Application.
Wireless site survey is a method or technique used to map wireless networks. The wireless site survey identifies the covered area and identifies interference with wireless networks that are in an area. Wireless site surveys can also be used to combine wireless network installations in an area [7].
The accelerometer sensor is a sensor that measures acceleration and serves to measure acceleration precisely, where the precise acceleration measured by the accelerometer does not necessarily have precise coordinates [15]. The accelerometer sensor can also be used to measure the acceleration of gravity, where motion detection is carried out based on 3 axes, namely the x-axis, y-axis, and z-axis [20]. The accelerometer sensor on the smartphone can be used to determine the coordinates of the location point, speed collision detection, fall detection, and real-time human activity detection [21-22].
The magnetometer sensor is a sensor that measures and detects the intensity of the magnetic field and the presence of iron or magnetic materials. The magnetometer sensor on Android devices is usually used to estimate the device's orientation relative to the earth's magnetic north or is commonly used as a digital compass that can show direction when using navigation applications [17].
Pedestrian dead reckoning is an algorithm that is intended to determine the position of pedestrians by utilizing the kinematics of human movement, and can also be defined as the process of estimating or estimate the current position by adding the distance traveled to the known starting position. In general, the pedestrian dead reckoning algorithm utilizes an accelerometer sensor and a magnetometer sensor, where the accelerometer sensor is used to detect human step and estimate the displacement that occurs while the magnetometer sensor is
used to estimate the direction facing or direction of destination [15-18]. The process of this algorithm is displayed in Figure 4.
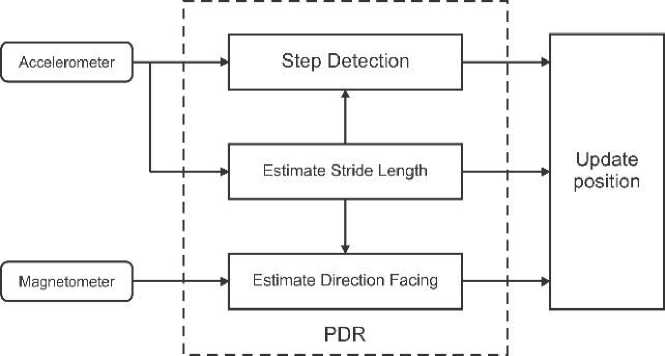
Figure 4. Pedestrian Dead Reckoning
RSSI or Receive Signal Strength Indicator determines whether or not the quality of a Wi-Fi network is good. The stronger the signal and the better the quality of a Wi-Fi network, the better and more reliable the connectivity will be. The signal on Wi-Fi is indicated by the amount of dBm, which is a power level unit with a power reference of 1mW = 10-3 Watt [19]. Signal quality categorized by RSSI is displayed in Table 1.
Table 1. Wi-Fi Signal Quality
|
Signal Strength (dBm) |
Quality |
|
-57 to -10 |
Excellent |
|
-75 to -58 |
Good |
|
-85 to -76 |
Normal |
|
-95 to -86 |
Bad |
The implementation of this system is divided into 3 parts, namely the main menu, the tracking feature and manual pinpoint feature.
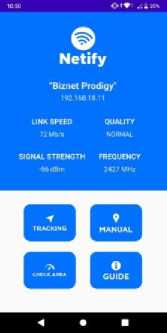
Figure 5. Main Menu
In the main menu, there is some information about the Wi-Fi network being used such as the name of the Wi-Fi network, link speed, quality of the Wi-Fi network, Wi-Fi signal strength, frequency of the Wi-Fi network, and the IP address of the Wi-Fi network.
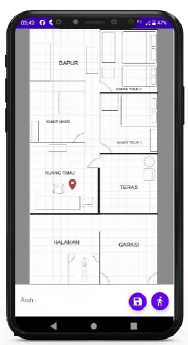
Figure 6. Tracking Feature
In the tracking feature, there is a floor plan that is used for Wi-Fi network survey activities along with a marker that shows the location on the plan. In addition, there is also a textview as a face direction and two floating buttons that have their respective functions. The floating button on the right is the button that is used to start and end the survey activity using the tracking method, while the floating button on the left is the button that is used to save the map of the survey results to the device.
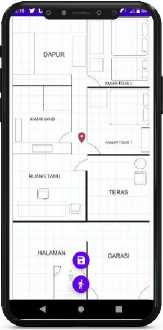
Figure 7. Manual Pinpoint Feature
In the manual pinpoint feature, there is a floor plan that is used for Wi-Fi network survey activities along with a marker that shows the location on the plan. In addition, there are also two floating buttons that have their respective functions. The floating button at the bottom is the button used to mark the quality of the Wi-Fi network on the map according to the marker position, while the floating button at the top is the button used to save the map of the survey results to the device.
Application testing was carried out to ensure that the application is in accordance with the design that has been made. The test method applied to the application was the black box testing method or testing by observing the results of execution through test data and checking
the functionality of the application to be tested. The testing was carried out using 3 different Android devices alternately, where the results of the test that will be attached are 1 result that represents 3 experiments that have been carried out.
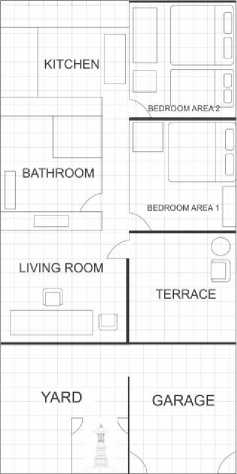
Figure 8. Floor Plan
Figure 8 is the floor plan used in testing the Wi-Fi network coverage area in the tracking menu. The floor plan is an indoor floor plan that has several location points. The test is carried out with the aim of seeing the coverage area of the Wi-Fi network when the source of the Wi-Fi network is placed in a different location. Color classification according to signal strength that will be listed on the floor plan during survey activities is displayed in Table 2.
|
Table 2. Signal Strength Classification | |
|
No |
Color Signal Strength Quality (dBm) |
|
1 |
-57 to -10 Excellent |
|
2 |
-75 to -58 Good |
|
3 |
-85 to -76 Normal Bad |
|
4 |
-95 to -86 Excellent |
Tests applied to the application features with different test activities were carried out to show that the application created could facilitate surveying of Wi-Fi networks in an indoor environment. The test procedure applied to the application is to test the manual and tracking features of the application.
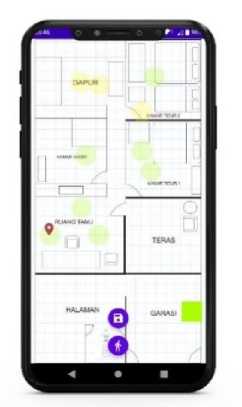
Figure 9. Manual pinpoint survey
In conducting a survey using the manual menu or manual pinpoint method, users need to move the marker on the floor plan to the place or location where the user is, then press the pinpoint button to mark the quality of the Wi-Fi network at the user's location. The result of this test is that the application will detect the Wi-Fi signal strength then give a color mark that shows the quality of the Wi-Fi network at the point or location that has been determined by the user when conducting a survey using the manual pinpoint method.
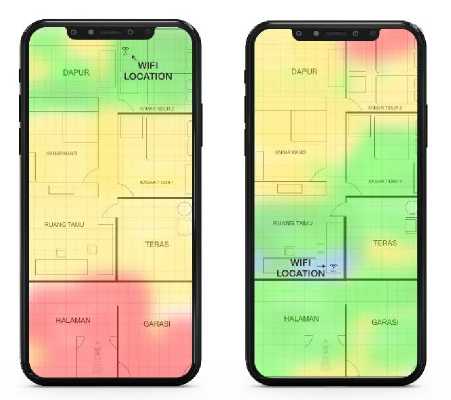
Figure 10. Tracking Method Survey
(a) Bedroom 2 Wi-Fi coverage area (b) Living room Wi-Fi coverage area
Testing on the tracking menu will be carried out using the same Wi-Fi network source and placing the Wi-Fi network source -Fi is in two different places. The places used in this test are the living room and bedroom 2.
Figure 10a is the result of the Wi-Fi area coverage test when the Wi-Fi source is placed in bedroom 2. It shows that the coverage area of bedroom 2 Wi-Fi can be said that it is not cover many areas or locations, where the results indicate the signal strength obtained is dominant in normal state, which is indicated by the yellow color on floor plan. The floor plan above shows that the coverage area or location with good signal strength is only in the area of bedroom 2 and the kitchen.
Figure 10b is the result of the Wi-Fi area coverage test when the Wi-Fi source is placed in the living room. It shows that the coverage area of the living room Wi-Fi can be said it
is better than the coverage area of bedroom 2 Wi-Fi. The floor plan above shows that the dominant signal strength on the floor plan is a good signal strength, while signal strength with other classifications is spread over several areas or other locations. From these two tests it can be concluded that the source of the Wi-Fi network that was placed in the living room can cover more areas with less blank spot areas. A summary of the test results that have been carried out is displayed in Table 3 (The test results can also be seen in the video using the following link https://youtu.be/CeHrDzEm00M).
Table 3. Test result summary
|
No |
Test cases |
Description |
Expected result |
Actual result |
|
1 |
Survey with tracking method |
Validate that the application can track user position and measure Wi-Fi coverage area during the survey |
The application tracks the user’s position during the survey and marks the floor plan with color based on WiFi signal strength |
fulfilled |
|
2 |
Survey with manual method |
Validate that the application can conduct a survey by manually moving the marker on the floor plan according to the user's location. |
The application will mark the floor plan with color based on Wi-Fi signal strength on the marker position |
fulfilled |
The conclusion that can be drawn from this research is that application can provide information related to Wi-Fi used in an indoor environment such as Wi-Fi name, IP address, WiFi quality, frequency, and Wi-Fi signal strength which can be accessed on the main menu of the application. The tracking feature which is an advantage in this application is a very useful feature in surveying Wi-Fi networks in an indoor environment, where surveys manually or alternately going to locations to check the quality of the Wi-Fi network are not necessary because the location can be tracked by the application and also this feature can save the time needed to conduct surveys. In addition, the tracking feature produces a heatmap with an image format that can later be used as a reference for optimizing Wi-Fi networks in an indoor environment.
References
wifi/, diakses tanggal 10 Mei 2020.
-
[2] Puspitasari, N. F, Analisis Rssi (Receive Signal Strength Indicator) Terhadap
Ketinggian Perangkat Wi-Fi Di Lingkungan Indoor, Jurnal Ilmiah Dasi. 2014; 15(4): 3238.
-
[3] Cortes Castillo, A, Simulation with AirMagnet Survey using Heat Maps inside Indoor
Scenarios in Wireless Local Area Networks, International Journal of Innovative Science and Research Technology. Volume 3, Issue 7, July – 2018.
-
[4] Ghosh, A., Lasebae, A., & Ever, E, Performance comparison of Wireless IEEE
-
802.11a,b, g and n used for Ad-Hoc Networks in an ELearning Classrooms Network, International Journal of Computer Science and Information Security (IJCSIS). Vol. 15, No. 9, September 2017.
30 Maret 2020
-
[6] Rachmadini, F., Budhisantosa, N., Pramdhana, D. S, Optimasi Cakupan Wireless
Access Point Pada Mall Sumarecon Bekasi, JIK; Jurnal Ilmu Komputer Volume 4 Nomor 1, Juni 2019.
-
[7] Zefanya, C., & Panca, B. S, Deteksi Blind Spot pada Sinyal Access Point menggunakan
Metode Site Survey, Jurnal Strategi Volume 1 Nomor 1 Mei 2019
needed/170503717715599/, diakses 18 April 2020
-
[9] Dewantara, W. F., Akbar, S. R., & Primananda, R, Implementasi Light Painting
Photography Dalam Analisis Cakupan Jaringan Wireless LAN Menggunakan Perangkat Berbasis Wemos D1, Jurnal Pengembangan Teknologi Informasi dan Ilmu Komputer. 2018; 2(1): 111-121.
-
[10] Sangkusolwong, W., & Apavatirut, A, Indoor WIFI Signal Prediction using Modelized
Heatmap Generator Tool, ICSEC 2017 - 21st International Computer Science and Engineering Conference 2017.
-
[11] Shah, A., Vatti, R., Pawar, Y., Prabhu, T., Naik, V., & Shelke, S, Wi-Fi Signal Strength
and Analysis, International Journal on Future Revolution in Computer Science & Communication Engineering Volume: 3 Issue: 11
-
[12] Gunantara, N., Sudiarta, P. K., Prasetya, A. A. N. A. I., Dharma, A., & Gde Antara, I. N,
Measurements of the Received Signal Level and Service Coverage Area at the IEEE 802.11 Access Point in the Building, Journal of Physics: Conf. Series 989 (2018) 012014.
-
[13] Hou, X., & Bergmann, J, A Pedestrian Dead Reckoning Method for Head-Mounted
Sensors, Journal Sensors 2020, 20, 6349; doi:10.3390/s20216349.
-
[14] Balagurusamy, E, Programming with Java, McGraw-Hill Education, 2019, 600.
-
[15] Colubri, A, Processing for Android: Create Mobile, Sensor-Aware, and VR Applications
Using Processing, Apress, 2017, 381.
-
[16] Campesato, O, Android: Pocket Primer, Stylus Publishing LLC, 2017, 250
-
[17] Mohd Ali, N., Ting, G. J., Shiung, L. Q., Theng, L. W., Ching, L. C., Sulaiman, M., Shah,
-
H. N. M., Ghazaly, M. M., & Razali, S, Issues and Challenges of Sensor Technologies in Microelectromechanical System (MEMS) in Smartphones for Motion Tracking Applications, Journal of Telecommunication, Electronic and Computer Engineering 2018 Vol. 10 No. 1-9.
-
[18] Xu, L., Xiong, Z., Liu, J., Wang, Z., & Ding, Y, A Novel Pedestrian Dead Reckoning
Algorithm for Multi-Mode Recognition Based on Smartphones, Journal Remote Sensing 2019, 11, 294; doi:10.3390/rs11030294.
-
[19] Siregar, M. R., & Sari, L. O., Optimasi Wireless Access Point Menggunakan Algoritma
Genetika (Studi Kasus Gedung C Fakultas Teknik), Jurnal Online Mahasiswa Fakultas Teknik Jom FTEKNIK Volume 5 Edisi 1 Januari s/d Juni 2018.
-
[20] Suryanata, I., Agung Bayupati, I., & Suar Wibawa, K., Rancang Bangun Game
Hanoman Heroes Pada Platform Android, Jurnal Ilmiah Merpati (Menara Penelitian Akademika Teknologi Informasi) 4(2), 135–142, 2017.
-
[21] Buana, W., & Meily, S. O., Augmented Reality Application using Dynamic Location
Based Tracking of Taman Ayun Temple, Lontar Komputer: Jurnal Ilmiah Teknologi Informasi, 12(1), 24, 2021.
-
[22] Setiawan, E. B., & Nurdin, H., Road Quality Assessment Using International Roughness
Index Method and Accelerometer on Android, Lontar Komputer: Jurnal Ilmiah Teknologi Informasi, 10(2), 62, 2019.
Design and Development of Android-Based Indoor Wi-Fi Site Survey Application (Ida Bagus 286
Kade Taruna)
Discussion and feedback