Public Sentiment Analysis of Online Transportation in Indonesia through Social Media Using Google Machine Learning
on
JURNAL ILMIAH MERPATI VOL. 9, NO. 2 AUGUST 2021
p-ISSN: 2252-3006
e-ISSN: 2685-2411
Public Sentiment Analysis of Online Transportation in Indonesia through Social Media Using Google Machine
Learning
Desak Ayu Putu Savita Arsarinia1, I Ketut Gede Darma Putraa2, Ni Kadek Dwi Rusjayanthia3
aInformation Technology Department, Faculty of Engineering,
Udayana University Bukit Jimbaran, Bali, Indonesia, telp. (0361) 701806
e-mail:1desakayuputu5@gmail.com, 2ikgdarmaputra@unud.ac.id, 3dwi.rusjayanth@unud.ac.id
Abstrak
Opini dari masyarakat penting bagi instansi atau pihak di bidang tertentu, karena dapat menunjukkan kecenderungan pendapat masyarakat terhadap sesuatu (seperti objek atau proses). Salah satunya pada bidang transportasi. Transportasi sudah menjadi kebutuhan bagi masyarakat, berbagai hal cenderung lebih efektif dan efisien berbasis online, sehingga transportasi online menjadi penting bagi masyarakat. Maraknya transportasi online, membuat cukup banyak masyarakat menyatakan berbagai opini atau pendapat mengenai pelayanan transportasi online melalui media sosial. Tingkat pelayanan untuk transportasi online menjadi penting diketahui mengingat banyaknya pengguna, sehingga dapat dijadikan sebagai dasar perbaikan. Salah satu cara mengetahui opini masyarakat terhadap transportasi online di media sosial adalah dengan analisis sentimen. Penelitian ini menggunakan bantuan Google Machine Learning untuk proses analisis sentimen yang menghasilkan nilai accuracy sebesar 82.6%, precision sebesar 82.2%, recall sebesar 83.3% dengan hasil sentimen paling banyak menunjukkan bahwa opini masyarakat masuk ke dalam kategori sentimen negatif untuk perusahaan Gojek pada media sosial Twitter.
Kata kunci: Analisis Sentimen,Google Machine Learning,Media Sosial,Transportasi Online
Abstract
Public opinion is important to agencies or parties in particular fields, as it may indicate a tendency of public's view towards something (such as an object or process). One of them is in the transportation sector. Transportation has become a necessity for the community, many things more effective and efficient online, so that online transportation becomes important for society. The proliferation of online transportation, caused citizens to express opinions through social media. It is important to know the level of service of online transportation considering the large number of users, so that it can be used as a basis for improvement. One of the methods public opinion in social media is by sentiment analysis. The study used the help of Google Machine Learning for the sentiment analysis process that can produce 82,6% of accuracy number, 82,2% of precision, 83,3% of recall with the most sentiment result indicate to public opinion falls into the negative sentiment category for Gojek companies in media social of Twitter.
Keywords : Sentiment Analysis,Google Machine Learning,Social Media,Online Transportation
Transportation is the support that is needed by the community in their daily life, such as public transportation, taxis, and motorbikes to go somewhere. Along with the times, Indonesians tend to use online-based transportation services compared to conventional transportation services. Online-based transportation utilizes services, vehicles, and mobile device technology as a tool for ordering and delivering people and goods to be faster, easier, anywhere and anytime, thus helping to facilitate people in their daily activities, as well as reducing traffic jam, air pollution, as well as oil and energy consumption [1].
According to Statista's data in 2019, there was a significant jump of opinion, it is about 21.7 million. This is because, the Indonesian people started using various kinds of transportation services [2]. Public opinion about online transportation tends to be conveyed more through social media. In addition, research data by Statista in 2019 also suggests that there are 150 million active social media users in Indonesia [2]. Social media is used as a forum to connect people as consumers and technology companies, as transportation service providers in obtaining information.
Information is important for technology companies in the transportation sector, because it can show a tendency for public opinion or opinion on the level of service. The method used to find out public opinion on online transportation on social media is sentiment analysis. Sentiment analysis is carried out by classifying and analyzing thought patterns or responses in the form of someone's opinion, comments about an object or process, and distinguishing a context with positive, neutral, or negative content. The sentiment data used are the sentiments of the Indonesian people expressed through social media, such as Twitter, Youtube, or digital news. Previous research related to sentiment analysis, namely comparing sentiment analysis regarding Indonesian text using Support Vector Machine and Random Forest [3]; conducted a sentiment analysis on films using GloVe-DCNN [4]; conducted a classification of mobile application reviews on Google Play Store using Word Embedding and Convolutional Neural Network [5]; conducted an analyzed text based approach to track similar traffic incident using text similarity [6]; conducted a sentiment analysis regarding the President of Indonesia, namely Jokowi using Naïve Bayes and Support Vector Machine [7]; conducted a sentiment analysis regarding the Indian Prime Minister using the Recurrent Neural Network [8]; with the algorithm method, the comparison of sentiment analysis on movie reviews with Information Gain and K-Nearest Neighbor [9]; select the word features regarding book reader satisfaction using Term Frequency Inverse Document Frequency [10]; conducted a text analysis on Indonesian Factoid Question Answering using Dependency Tree [11]; conducted an analyzed of attractions in Bali using snowflake tool [12]; conducted a sentiment analysis of student online in a postgraduate program with cloud-based Natural Language Processing tool [13]. The common method that have been use for sentiment analysis from the other research is algoritma naive and support vector machine, and previously not many researcher doing the research about sentiment analysis by using google machine learning for case study online transportation in Indonesia. Furthermore, the sentiment analysis in this study was carried out in a different way compared to previous studies, namely by utilizing Google Machine Learning on sentiment towards onlinebased transportation.
The research methodology is used as a reference in the development phase, starting from the system design to the system evaluation stage. The research was carried out in 6 stages as shown in Figure 1.

Figure 1. Research Stages
-
Figure 1 represents six research steps starting from the problem identification stage related to sentiment analysis. Second, it was the stages of collecting and processing data from social media. Third, the design and development stages of a web-based system with the help of the Google NLP API in processing using the Python programming language. Fourth, the system testing stage using confusion matrix calculations. Fifth, the stage of system discussion and evaluation to determine the success rate of the system. Lastly the sixth stage, the results and conclusions of the research were made as a whole.
The study of sentiment analysis through social media using Google Machine Learning is generally illustrated in Figure 2.
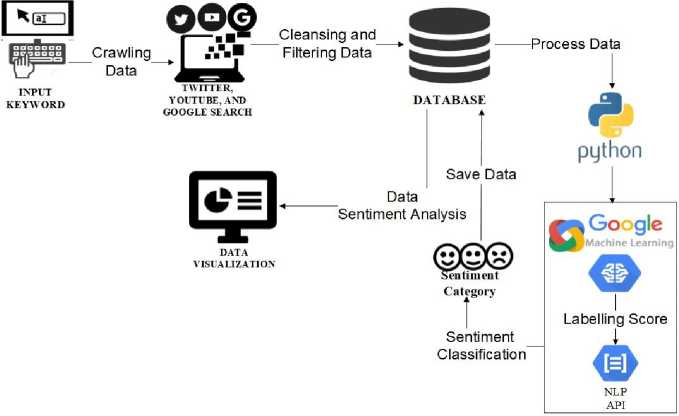
Figure 2. General OSverview
Figure 2 is a general overview of the system which was carried out with the first step, it was: entering keywords according to the case studies raised, namely online transportation in Indonesia such as Gojek, Grab, and Blue Bird Group. Data was obtained through social media such as Twitter, Youtube, and the Google Search search engine in the form of tweets, comments and news. Crawling data was temporarily entered into the database to become raw data, then processed and analyzed by Google Machine Learning into result data as a determination of sentiment classification and stored back into the database as result data. After that, the result data was displayed in the form of data visualization on the website as information.
The data used in the study came from social media Twitter, Youtube and the Google Search search engine in the form of tweets, comments, and news related to online transportation in Indonesia using keywords from 3 transportation service technology companies such as Blue Bird, Gojek, and Grab. The amount of data obtained was 5000 data within a period of 3 months.
The process of retrieving data via social media Twitter and Youtube were in the form of tweets and comments, while from the Google Search engine in the form of news from news portals. Flowchart of data crawling through data sources as in Figure 3.
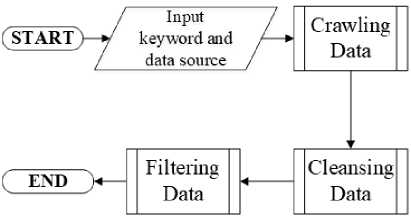
Figure 3. Flowchart of Crawling Data
Figure 3 is a flowchart of the stages in data collection, which was done by taking data from each data source, namely Twitter, Youtube, and Google Search. What it does was entered keywords related to the case studies taken and select data sources. After that, the data cleansing and filtering process was carried out. An example of data when crawling data can be seen in Table 1.
Table 1. Example of Crawling Data
|
|
Youtube |
Google Search |
|
Hi @Bluebirdgroup, why are there so many cars from Blue bird group on the roadside parking along the front of the Ministry of Health until Tempo Pavillion 2? Every day when I can't see it, it makes a traffic jam..The crane is already along the road path there |
So cool, that's GOJEK, incredible. The work of the Indonesian’s people, great! © |
Grab's response to online motorcycle taxis which is prohibited from transporting passengers during PSBB |
Table 1 is a table that contains the examples of data results during the data crawling process, which were taken from social media Twitter and Youtube and the Google Search search engine. Data on data crawling is referred as raw data.
Data cleansing is the process of cleaning data by deleting unnecessary data. Flowchart of cleansing data is shown in Figure 4.
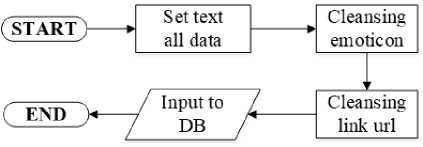
Figure 4. Flowchart of Cleansing Data
Figure 4 is a flowchart of the stages in cleansing data. Cleansing in this research was done by deleting emojis and URL links. After the cleansing process is successful, the data is entered back into the raw data table database. An example of the results from cleansing data is shown in Table 2.
Table 2. Example of Cleansing Data
|
|
Youtube |
Google Search |
|
Hi bluebirdgroup, why are there so many cars from Blue bird group on the roadside parking along the front of the Ministry of Health until Tempo Pavillion 2? Every day when I can't see it, it makes a traffic jam. The crane is already along the road path there. |
So cool, that's GOJEK, incredible. The work of the Indonesian’s people, great! |
Grab's response to online motorcycle taxis which is prohibited from transporting passengers during PSBB |
Table 2 is a table that contains examples of data results during the data cleansing process, which were taken from social media Twitter and Youtube and the news portal Google Search. Data that has been cleansed is stored in the database as raw data.
Data filtering is the process of sorting data by selecting inappropriate data. Flowchart filtering data as in Figure 5.
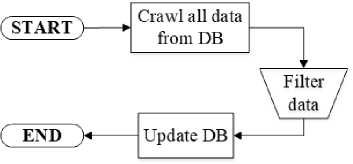
Figure 5. Flowchart of Filtering Data
Figure 5 is a flowchart of the stages in data filtering. Data filtering is done manually by separating inappropriate data, for example in Twitter the data you want to get must contain username, date, tweets, and location. If there is data that does not contain a location or is incomplete, the filtering process is carried out. The next stage is updating the database.
Sentiment analysis is carried out by providing labeling through the help of the Google Natural Language Cloud API using scoring, which is useful for determining the sentiment category of each data. The score given by Google NLP is a threshold value between 0.25 - 1.0 into the positive category, -0.25 - 0.25 into the neutral category, and -1.0- -0.25 into the negative category. Flowchart of s analysis stages as in Figure 6.
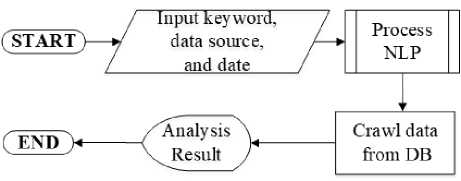
Figure 6. Flowchart of Sentiment Analysis
Figure 6 is a flowchart of the stages in sentiment analysis. The first thing to do is to enter keywords related to the case study takem and to select the data source that was previously saved into the database as raw data. Next, carry out the NLP process using the help of the Google Machine Learning, namely the Cloud Natural Language API. After the sentiment analysis is complete, the data is stored again in database as result data. Then, the data is analyzed and re-evaluated to obtain information. Information is displayed in the form of data visualization in the form of diagrams, to make it easier to determine. An example of the results from labelled data is shown in Table 3.
Table 3. Example of Labelled Data
|
Text |
Source |
Score |
Magnitude |
Label |
|
Hi bluebirdgroup, why are there so many cars from Blue bird group on the roadside parking along the front of the Ministry of Health until Tempo Pavillion 2? Every day when I can't see it, it makes a traffic jam. The crane is already along the road path there. |
|
-0.2 |
0.5 |
Negative |
|
So cool, that's GOJEK, incredible. The work of the Indonesian’s people, great! |
Youtube |
0.9 |
1.0 |
Positive |
|
Grab's response to online motorcycle taxis which is prohibited from transporting passengers during PSBB |
Google Search |
0.2 |
0.2 |
Neutral |
System testing was done by using confusion matrix to determine the performance of the system by calculating accuracy, precision and recall values. The confusion matrix is a table of confusion 3x3 that consists of three categories: positive, neutral, and negative shown as in Table 4 for the formula used in the calculation of accuracy, precision and recall as in Figure 7.
Table 4. Confusion Matrix
|
Prediction Result | ||||
|
Positive |
Neutral |
Negative | ||
|
Actual |
Positive |
PP |
PNt |
PNg |
|
Result |
Neutral |
NtP |
NtNt |
NtNg |
|
Negative |
NgP |
NgNt |
NgNg | |
Table 5. Confusion Matrix Result
Application Result
|
P |
Nt |
Ng | ||
|
Manual |
P |
29 |
3 |
0 |
|
Result |
Nt |
4 |
23 |
11 |
|
Ng |
1 |
1 |
43 | |
|
Accuracy |
82.6% | |||
|
Precisiom |
82.2% | |||
|
Recall |
83.3% | |||
Notes:
-
• PP, NtNt, NgNg are the numbers of correct classification and diagonal elements in the confusion matrix.
-
• PNt, PNg, NtP, NtNg, NgP, NgNt are the numbers of incorrect classification.
(PP + NtNt + NgNg)
Accuracy =-----------x 100%
(PP + NtNt + NgNg + PNt + NtP + NtNg + PNg + NgP + NgNt)
( PP V/ NgNg ∖ ( NtNt ∖
∖PP + NgP + NtPΓ∖NgNg + PNg + NtNg Γ∖NtNt + PNt + NgNtJ
Precision = δ---------------x1-----— 1------------——- ιlOO%
∕ PP ∖ ι NgNg ∖ r NtNt ∖
VP + PNg + PNt) + ∖NgP + NgNg + NgNt) + ∖NtP + NtNg + NtNtJ
Recall =:::—;-----■-------------------:λ 100%
-
Figure 7. Accuracy, Precision, Recall Formula
Figure 7 is the formula of the calculation of accuracy, precision, recall values. Accuracy can calculated by summing all the right predictions and divided by of all the wrong predictions and than can percentante it with time 100%. All class precision score are calculated by summing the right predictions divided by the adding result from the right predictions and the wrong predictions in one of the past sentiment categories and than divided with three and times with 100%. All class recall are calculated by summing the right predictions divided by the adding result from the right predictions and the wrong predictions of the three sentiment categories and then divided by 3 and multiplied by 100%. Divided by 3 because there are three categories of sentiment used, positive, neutral, and negative sentiment. System testing in this study used data as much as 115 data. Data obtained from the results of sentiment categories determined by the system and questionnaires later, conducted comparison results as in Table 4. The performance of the application created and produce accuracy value of 82.6%, precision by 82.2%, recall by 83.3%.
Literature study is a reference that contains material related to the research taken. Published literature review, namely social media, text mining, and Google Machine Learning.
Social media is a medium to make it easier for people to interact socially by communicating, sharing and exchanging information virtually and is interactive. There are several types of social media, such as Twitter and Youtube. Twitter is a social media that can
send and read text based messages with the names of tweets [14]. Youtube is a social media that can load, watch, comment, and share video clips for free [15]. Apart from social media, there is also a news portal website that can be used as a place to get information that can be searched through the help of the Google Search search engine. Google Search is a search engine on the web that is owned by Google Inc. [16].
Text mining is a technique of analyzing and processing unstructured and semistructured textual data. The text mining process includes text categorization, text clustering, concept or entity extraction, sentiment analysis, document conclusion [17]. Sentiment analysis is a pattern of thought or response in the form of someone's opinion and comments about something, such as an object or process, by analyzing it and classifying it, so that a charged, positive, neutral, or negative context can be distinguished. Sentiment analysis is also useful for practitioners and researchers, such as sociology, marketing, advertising, psychology, economics, political, science, because it requires a lot of data about human-computer interactions [18].
Machine learning is part of Artificial Intelligence (AI) where a system has the ability to learn on its own without explicit instructions. Machine learning learns about using algorithms on a computer to analyze and solve a problem by providing the correct answer, in order to gain predictive insight and make iterative decisions. So, Google Machine Learning is a service from the machine learning model created by Google. Google Machine Learning has 3 types, namely classification, regression and clustering.
Natural Language Processing is a model approach to machine learning. One of the machine learning services provided by Google is Google Cloud Natural Language. Google Cloud Natural Language API can perform sentiment analysis in 16 languages, namely Arabic, Chinese (Simplified), Chinese (Traditional), Dutch, English, French, German, Indonesian, Italian, Japanese, Korean, Portuguese (Brazilian & Continental), Spanish, Thai, Turkish and Vietnamese. Google Cloud Natural Language service is done in two ways, namely using AutoML Natural Language and Natural Language API. The way Google Machine Learning works for AutoML Natural Language is done automatically, while how it works using the Natural Language API is done by using the API and adding in the code of the program that is created. Google Cloud Natural Language can analyze syntax, extract entities and evaluate sentiment text. Sentiment analysis by means of the Natural Language API was carried out through labeling, namely, score and magnitude. Score is a sentiment value ranging from 1.0 (positive), 0.0 (neutral), and -1.0 (negative) which correspond to the emotional tendencies of the entire text. Magnitude is a non-negative number in the range of 0 to infinity (+ inf) that measures the amount of sentiment in the text in absolute terms regardless of the score (positive or negative). The method that was used by Google Machine Learning has not been explained comprehensively. The document that contains the expression of the analysis models used by the API, are later retrained using an extensive body of text and natural language tools from Google. This API works by extracting a sentiment score and magnitude from the given document. Results of the sentiment score of each label provided by Google Machine Learning API is illustrated in Table 5. An example of labelled data is illustrated in Table 3.
Table 6. Score and Magnitude for Labelling Sentiment
|
Label |
Score |
Magnitude |
|
Positive |
more than 0.25 to 1.0 | |
|
Neutral Negative |
-0.25 to 0.25 -1.0 to less than -0.25 |
0 to (+inf) |
Flask is a micro framework written in the Python programming language. Flask doesn't have a database abstraction layer, form validation, or other components, because there are already third-party libraries that provide common functionality. Flask supports extensions to add
app features. Extensions exist for object-relational mapper, form validation and upload handling, various open authentication technologies, and some common framework related tools.
The Python programming language was first developed by Guido Van Rossum in 1980. Python is a multi functional programming language specifically designed to put more emphasis on code in creating programs, so that the syntax is easy to understand. Python has 2 ways to create programs, namely by using command line mode and script mode. Python has two versions, namely, Python version 2 was first available in 2000 named Python 2.7, and was subsequently developed into a newer version named Python 3 with less than ideal design improvements in the previous Python [19].
The research was conducted using data taken from data sources, namely, social media and news portals that have been stored in a database and the results are displayed in the form of a website-based application
The result of this research is an application made based on a website with one page as the main page when searching for data and display of data search results in the form of data visualization. The start page display is as in Figure 8.
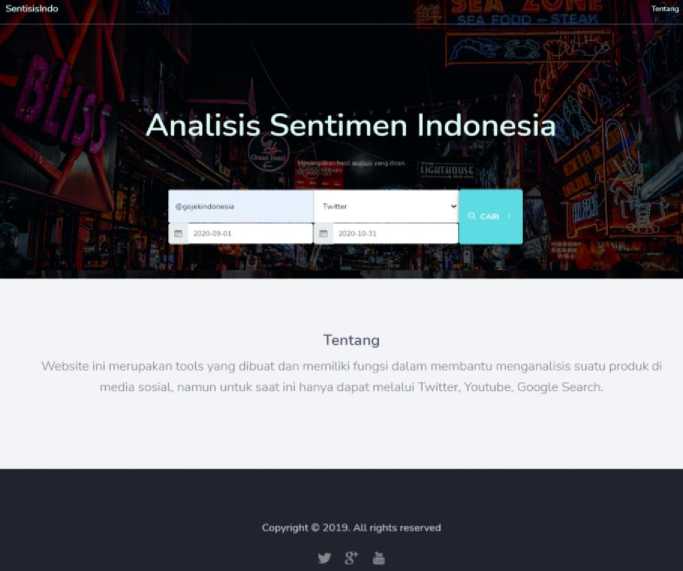
Figure 8. Main Page
Figure 8 is a display of the main page of the application that is made. The header section contains the website name icon, namely "SentisisIndo" and the "about" menu. The body section contains a form containing the “Enter keywords” placeholder, the option to select social media such as Twitter, Youtube, and Google Search, the option to select the appropriate start date for the search, the search button, and the “About” which contains a brief description of the program being used has been created, but if the program has been run this section will add to the card and chart display according to the data that is searched for in the form section. Fill in the form in Figure 8 is the keyword searched for, namely "@gojekindonesia" and the selected social media is Twitter, and for the date you are looking for is from "2020-09-01" to "2020-10-31". After that the search button is clicked and a
notification appears "please wait" for the results of the searched data. The footer section only contains links and copyright. If the data results are successfully searched, a notification of successful data appears and is displayed in the form of a card as in Figure 9.
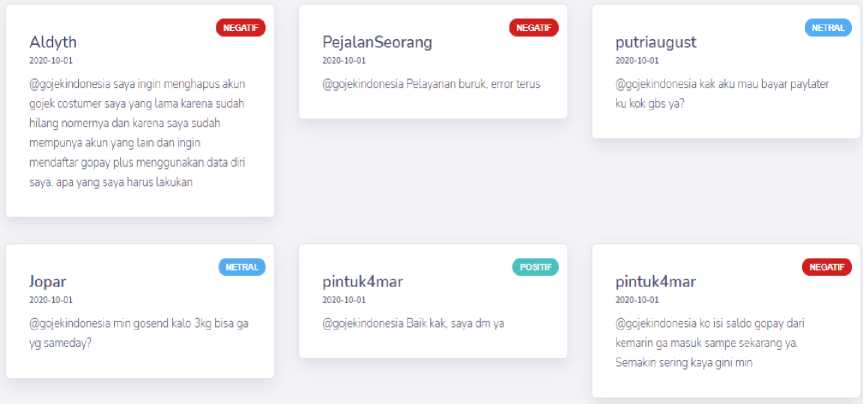
Figure 9. Example of Card Results
Figure 9 is an example display of the results of the sentiment data displayed in the form of a card with the respective sentiments. The sentiment results display tweets from Twitter users who give their opinion on online transportation with the keyword "@gojekindonesia" on "October 1, 2020". The sentiment results displayed are in the form of positive, neutral and negative sentiments. In addition, the sentiment results are displayed in the form of a chart diagram divided into 5 charts. Each chart displays the amount per sentiment and the total overall sentiment as in Figure 10, Figure 11, and Figure 12.
Indonesia Map
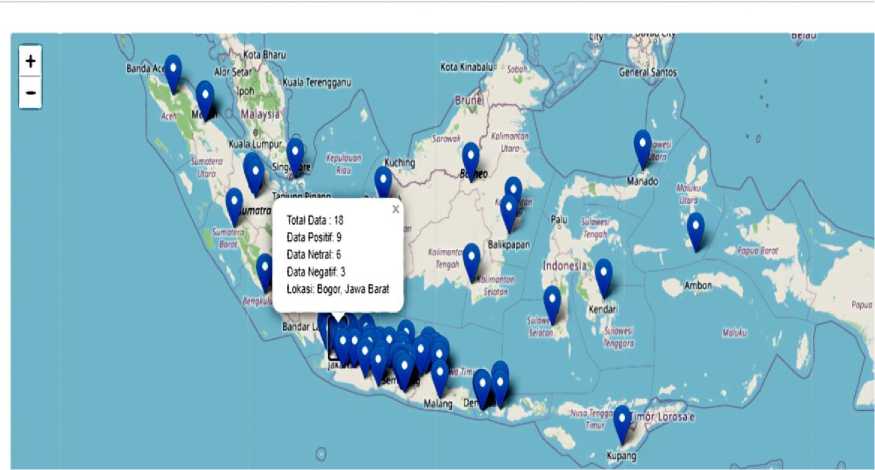
Figure 10. Example of Maps Chart Result
Line Chart
Rekapan Hasil

Figure 11. Example of Line Chart Result
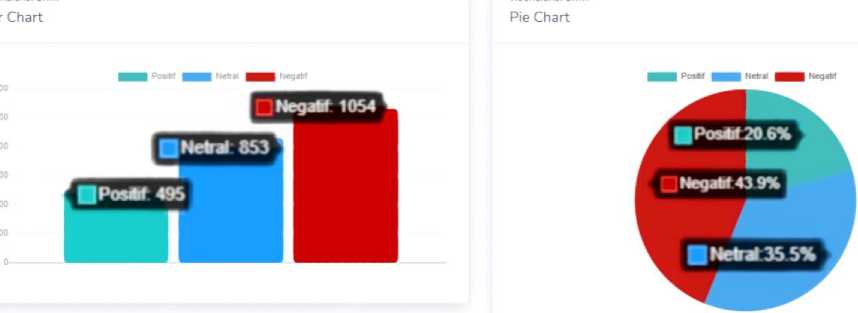
Figure 12. Example of Bar Chart and Pie Chart Result
Figure 10, Figure 11, Figure 12 are a display of one example of used to evaluate the results on Twitter social media. The display of the results of the data being sought is in the form of data visualization in the form of maps chart on Figure 10, line chart on Figure 11, bar chart and pie chart on Figure 12. The evaluation of data from each chart has a comparison, namely the increase and decrease in sentiment results based on the number of tweets made by Twitter users at any time in several regions in Indonesia.
Comparison of results is to compare the results of the determination of sentiment classification manually base on the comparison of key words from September 2020 until October 2020. The result of key words comparison is refer to Table 7.
Table 7. Keywords Comparison Result
|
NUM. |
CASE STUDY |
DATA SOURCE |
CATEGORY |
SUM | ||
|
Positive |
Neutral |
Negative | ||||
|
1. |
Bluebird |
|
21 |
49 |
17 |
87 |
|
Youtube |
3 |
0 |
0 |
3 | ||
|
Google Search |
2 |
0 |
0 |
2 | ||
|
2. |
Gojek |
|
495 |
853 |
1054 |
2402 |
|
Youtube |
6 |
1 |
1 |
8 | ||
|
Google Search |
10 |
0 |
0 |
10 | ||
|
NUM. |
CASE STUDY |
DATA SOURCE |
CATEGORY |
SUM | ||
|
Positive |
Neutral |
Negative | ||||
|
3. |
Grab |
|
385 |
406 |
429 |
1220 |
|
Youtube |
7 |
9 |
0 |
16 | ||
|
Google Search |
24 |
2 |
0 |
26 | ||
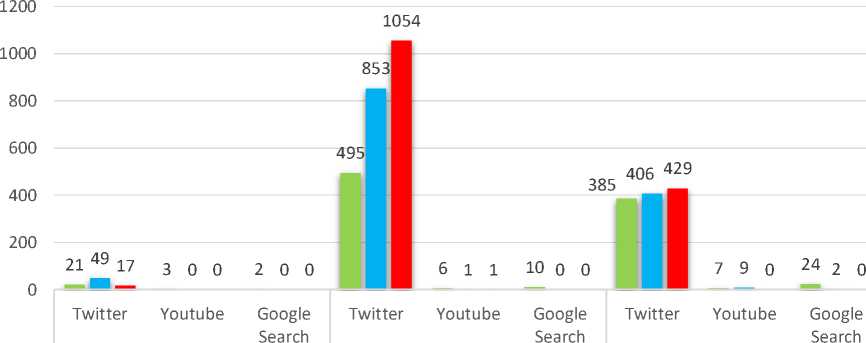
Table 7 is keywords comparison result of the research for online transportation company, such as Bluebird, Gojek, and Grab that retrieved from Twitter, Youtube, and Google Search from September 2020 until October 2020. Table of keywords comparison is table used as data in bar chart on Figure 11.
Bluebird Gojek Grab
■ Positive ■ Neutral ■ Negative
Figure 13. Comparison Chart Result
Figure 11 is data visualization of comparison result in bar chart graph that showing the most amount of negative sentiment for online transportation company was obtained by Gojek on Twitter compared to any other online transportation company on other social media.
The process of collecting data through social media and news portals, namely Twitter, Youtube, and Google Search regarding online transportation in Indonesia related to 3 technology companies providing transportation services, such as Blue Bird Group, Gojek, and Grab has been successfully carried out. The process that occurs, the data is stored into the database as raw data for data processing. Data processing for sentiment analysis uses the help of Google Machine Learning. Google Machine Learning helps in determining the sentiment category from the given data. After getting the sentiment results are displayed in the form of website-based data visualization. Sentiment results from the trends of each company and data sources vary at certain times. The performance of the program that has been successfully created using the help of Google Machine Learning with 115 test data yields an accuracy value of 82.6%, precision of 82.2%, recall of 83.4%. According to analysis result, most of online transportation data was retrieved from Twitter since Twitter faster and easier to use, and can reach a wider range of users to get more specific information compared to any other social media. Online transportation that had the most impression from users on Twitter is Gojek which got the most negative sentiment.
References
-
[1] S. Aminah, “Transportasi Publik dan Aksesibilitas Masyarakat Perkotaan,” 2018; 9; 1142.
-
[2] https://datareportal.com/reports/digital-2020-indonesia, accessed 20 Juni 2020.
-
[3] S. N. Khairunisa, “Perbandingan Kinerja Algoritme Klasifikasi Support Vector Machine dan Random Forest Terhadap Domain Silang pada Analisis Sentimen Berbasis Teks Berbahasa Indonesia,” J. Univ. Gadjah Mada, 2018; 15(2); 2017–2019.
-
[4] Z. Jianqiang, G. Xiaolin, and Z. Xuejun, “Deep Convolution Neural Networks for Twitter Sentiment Analysis,” IEEE Access, 2018; 6; 23253–23260.
-
[5] I. M. M. Parwita and D. Siahaan, “Classification of Mobile Application Reviews using Word Embedding and Convolutional Neural Network,” Lontar Komputer, 2019; 10(1); 1–8.
-
[6] M. Ermawati and J. L. Buliali, “Text Based Approach For Similar Traffic Incident Detection from Twitter,” Lontar Komputer, 2018; 9(2); 63–71.
-
[7] N. Saputra, T. B. Adji, and A. E. Permanasari, “Analisis Sentimen Data Presiden Jokowi dengan Preprocessing Normalisasi dan Stemming menggunakan Metode Naive Bayes dan SVM,” J. Dinamika Informatika, 2015; 5(1).
-
[8] D. K. C. Dipti Mahajan, “Sentiment Analysis Using Rnn and Google Translator,” 2018 8th Int. Conf. Cloud Comput. Data Sci. Eng., 2018; 798–802.
-
[9] R. I. Pristiyanti, M. A. Fauzi, and L. Muflikhah, “Sentiment Analysis Peringkasan Review Film Menggunakan Metode Information Gain dan K-Nearest Neighbor,” J. Pengemb. Teknol. Inf. dan Ilmu Komput. Univ. Brawijaya, 2018; 2(3); 1179–1186.
-
[10] N. K. Widyasanti, I. K. Gede, D. Putra, N. Kadek, and D. Rusjayanthi, “Seleksi Fitur Bobot Kata dengan Metode TFIDF untuk Ringkasan Bahasa Indonesia,” Jurnal Ilmiah Merpati, 2018; 6(2); 119–126.
-
[11] I. Afif and A. Purwarianti, “Employing Dependency Tree in Machine Learning Based Indonesian Factoid Question Answering System,” J. Linguist. Komputasional, 2019; 2(1); 28–33.
-
[12] N. P. A. Widiari, I. M. Agus, Suarjaya, and D. P. Githa, “Teknik Data Cleaning Menggunakan Snowflake untuk Studi Kasus Objek Pariwisata di Bali,” Jurnal Ilmiah Merpati, 2020; 8(2); 137–145.
-
[13] T. D. Pham et al., “Natural language processing for analysis of student online sentiment in a postgraduate program,” Pacific J. Technol. Enhanc. Learn., 2020; 2(9).
-
[14] E. Williams, B. Stone, and N. Glass, “Twitter for Business : Everything You Need to Know,” 2015; 1–19.
-
[15] K. D. B. Mangole, M. Himpong, and E. R. Kalesaran, “Pemanfaatan Youtube Dalam Meningkatkan Pengetahuan Masyarakat Di Desa Paslaten Kecamatan Remboken Minahasa,” J. Acta Diurna, 2017; 6(4); 1–15.
-
[16] M. P. S. Christa Burns, Google Search Secrets. Chicago: American Library Association, 2014.
-
[17] F. Ronen and J. Sanger, The Text Mining Method. 2007.
-
[18] P. Pandey, “Simplifying Sentiment Analysis using VADER in Python (on Social Media Text),” Analytics Vidhya. 2018.
-
[19] Ljubomir Perkovic, Introduction to Computing Using Python: An Application Development Focus, 1st ed. United States Of America: Wiley, 2012.
Public Sentiment Analysis of Online Transportation in Indonesia through Social Media
Using Google Machine Learning (Desak Ayu Putu Savita Arsarini)
164
Discussion and feedback