Decision Support System for Tour Package Recommendation in Bali Using BWM-MARCOS Method
on
JURNAL ILMIAH MERPATI VOL. 9, NO. 2 AUGUST 2021
p-ISSN: 2252-3006
e-ISSN: 2685-2411
Decision Support System for Tour Package Recommendation in Bali Using BWM-MARCOS Method
Ni Ketut Pradani Gayatri Sarjaa1, I Made Candiasaa2, Kadek Yota Ernanda Aryantoa3 aComputer Science Departement, Graduate Program, Ganesha University of Education, Bali, Indonesia
e-mail: 1pradanigayatris@gmail.com, 2candiasa@undiksha.ac.id, 3yota.ernanda@undiksha.ac.id
Abstrak
Bali merupakan salah satu provinsi dengan peluang pariwisata yang menguntungkan. Dengan adanya peluang pariwisata di Bali ini memunculkan banyak usaha yang berkaitan dengan pariwisata salah satunya agen perjalanan wisata. Agen perjalanan wisata di Bali biasanya menawarkan berbagai pilihan paket wisata dengan harga dan spesifikasi yang berbeda-beda. Permasalahan yang dialami para wisatawan dalam menentukan paket wisata dari agen adalah masalah harga paket wisata lumayan tinggi dan tidak sesuai dengan budget wisatawan. Selain itu jadwal kunjungan dari paket wisata juga tidak fleksibel. Permasalahan ini dapat diatasi dengan membangun sistem pendukung keputusan pembentukan paket wisata. Penelitian ini menggunakan metode BWM (Best Worst Method) untuk menentukan bobot optimal untuk masing-masing kriteria dan metode MARCOS (Measurement Alternatives and Ranking according to the Compromise Solution) untuk melakukan perankingan alternatif obyek wisata yang akan membentuk paket wisata. Pengujian hasil menggunakan confusion matrix mendapatkan nilai accuracy sebesar 74,19%, precision sebesar 81,25%, recall/sensitivity sebesar 72,22% dan specificity sebesar 76,92%.
Kata kunci: SPK, Rekomendasi Paket Wisata, Metode BWM, Metode MARCOS
Abstract
Bali is one of the provinces with profitable tourism opportunities. It has led to many businesses related to tourism, which is a travel agent. Travel agents in Bali usually offer variety of tour packages with different prices and specifications. The problem experienced by tourists in determining tour packages is that the price of tour packages is quite high and does not match the tourist budget. In addition, the schedule of visits from tour packages is also inflexible. This problem can be overcome by making a decision support system for forming tour packages. This study uses the BWM method to determine each criterion’s optimal weight and the MARCOS to rank alternative tourism objects that will form a tour package. Testing results using confusion matrix get an accuracy value of 74.19%, precision of 81.25%, recall / sensitivity of 72.22% and specificity of 76.92%.
Keywords : DSS, Tour Package Recommendations, BWM Method, MARCOS Method.
Tourism is one of the mainstay sectors in economic development in Indonesia [1]. Bali is one of the provinces with favorable tourism opportunities, this is due to the potential and attractiveness of Bali which is able to attract tourists, both local and foreign tourists [2]. With the existence of tourism opportunities in Bali, there are many businesses related to tourism such as accommodation, restaurants and travel agents. Travel agent is a company that organizes, plans and takes care of everything regarding travel, accommodation and entertainment for tourists who are traveling [3]. Travel agents in Bali usually offer variety selection of tour packages with different prices and specifications.
Prices and visit schedules from tour packages offered by travel agents are the major problems for tourists in choosing tour packages. The price of tour packages offered by travel agents is quite high, so there is a possibility that it is not in accordance with the tourist budget. The visit schedule of tour packages is also not flexible, so tourists are sometimes not satisfied
with the duration of the visit to tourist objects and tourists cannot make special requests to visit tourist attraction that are not on the schedule.
The problems can be overcome by built a decision support system for the formation of tour packages that can be carried out by tourists themselves. Besides being able to save time, this system also helps to find recommendations for tour packages that match the criteria or desires of tourists. Decision Support System (DSS) is not replace the decision makers judgement but rather help to expand capabilities of decision makers [4]. This research uses the BWM method to determine the optimal weight for each criterion and the MARCOS method to rank alternative tourist attractions that will form a tour package. The concept of the BWM method is to compare very important criteria (best criteria) and non-important criteria (wost criteria) with other criteria, then the maximum problem is resolved so that it gets the ideal weight of each criterion [5]. The concept of the MARCOS method is to define the relation between alternatives and preference values where the best alternative is the closest to the ideal solution and the furthest to the anti-ideal solution [6]. Tour packages formed by the system consist of hotels, transportation and three types of tourist objects that can be visited, namely nature, culinary and shopping tours. Some of the tour packages formed by the system are then used as alternatives to further seek recommendations for the best tour packages for tourists.
The research related to the BWM method was conducted by [7] with the title "Application of BWM-WASPAS Model for Digital Supplier Selection Problem: A Case Study in Online Retail Shopping" where this study aims to determine digital suppliers using a combination of the BWM method and the WASPAS method. The BWM method in this study is used in determining the level of importance or the optimal criterion weight so that it can be used as a weight in the WASPAS calculation. The BWM method allows the decision maker to determine the weight of the criteria through a mathematical model by selecting the best and worst criteria. The research study related to the comparison of the BWM method with other weight determination methods was carried out by [8] with the title "Comparison of AHP and BWM Methods Based on Geographic Information Systems for Determining the Potential Zone of Pasir Batu Mining" here in this research the BWM method makes comparisons in a more structured manner so that they are easier to understand and lead to more consistent comparisons, so that weights are more reliable. The research related to the MARCOS method was carried out by [9] with the title "Project Management Software Evaluation Using the Measurement of Alternatives and Ranking According to Compromise Solution (MARCOS) Method" wherein this research the MARCOS method was successfully applied with the result that Smartsheet received the highest rating, while Basecamp gave lowest rank. According to the results of data analysis, the difference in the final value for each alternative is very small for the best and worst alternatives, only 0.024. The similar research was conducted also by [10] comparing the results of the sensitivity test to several MCDM methods namely MARCOS, SAW, ARAS, WASPAS EDAS, CoCoSo and MABAC. The result show that the MARCOS method is consistent for all alternatives and there is no change in rank at all. In addition, a comparison of the results of statistical correlation using the Spearman Correlation Coefficient (SCC) method resulted that the MARCOS method was consistent and fully correlated with the value of SCC = 1,000, so there was no change in rank.
Based on the previous research, this previous uses the BWM-MARCOS method to make tour packages according to the tourists wishes. This is because the BWM method can produce optimal weights for each of the criteria used in the calculation while the MARCOS method can produce a ranking of tourist attraction which will be grouped into tour packages. The difference between this research and previous research lies in the alternatives that been used. If in the previous research using ready-made tour packages as an alternative, but this research did not use a finished tour package instead formed a tour package based on the ranking of the tourist attraction then they were grouped into one tour package.
The research method of the application of a decision support system for the forming of a tour package in Bali using the BWM-MARCOS method can be seen in Figure 1.

Figure 1. Research Method
-
1. Literature Review
This step collects theories that support and are related to Geographical Information Systems, Decision Support Systems, BWM Methods and MARCOS. Supporting theory can be taken through previous research, books, e-books, international and national research journals and publication papers.
-
2. Data Collection
Data collection is done by looking for information on the official website regarding the components and criteria for forming a tour package. Primary data in this research is data on tourism objects, accommodation or hotels and transportation rental. This data is obtained from search results from official websites and traveling websites as well as internet references.
-
3. Criteria Determination
The criteria used as a reference in the formation of tour packages based on data from the Bali Provincial Tourism Office related to eight main points that must be considered in the forming of a tour package, three criteria are used, namely budget, time and rating.
-
4. Implementation
This step the data that has been transformed is then implemented into a decision support system developed by the researcher. The method implemented is a combination of the BWM-MARCOS method.
-
5. Testing
The sensitivity of the ranking system results is tested with expert ranking using the confusion matrix method.
The concept of Decision Support Systems was first put forward by Michael S. Scott Morton in 1970 with the term Management Decision Systems [11]. This concept is characterized by the creation of an interactive computer system that collects data and uses the model to support unstructured problem-solving decisions. In semi- structured problems, DDS can support managerial decision makers [12]. DSS is not intended to replace decision makers judgemen but expand their capabilities [13].
The BWM method is a method that can perform alternative evaluations based on criteria especially for cases where objective metrics are not available. In addition, the BWM method can also be used in determining the level of importance or weight of the criteria that will be used as a reference for finding solutions so that the main objective of the problem is achieved. The BWM method using two pairwise comparison vectors (best-to-others and the others-to-worst) in order to obtain the optimal weight of the criteria. The stages in the calculation process for the BWM method are as follows [14].
-
a. Define criteria for decision making
Decision makers consider criteria that must be used to forming decision. Where { c1, C2 ,..., cn} is a set of criteria for decision-making.
-
b. Determine the best and worst criteria
Decision makes choose the best and worst criteria and no comparisons are made.
-
c. Determining the best criteria preferences value compared to other criteria in scale 1 to 9. The best-to-others vector results are as follows.
a B = ( a1 1 >aB 2 >.,aBn) (1)
Where Ab is the overall value of the best-to-others criteria vector, for example Abj indicates the preference value of the best criterion B over criteria j.
-
d. Determinning the worst criteria preference value compared to other criteria in scale 1 to 9 scale. The results of the others-to-worst vector is as follows.
a w = ( αι w a2w∙∙∙>nrιwyr (2)
Where Aw is the overall value of the other-to-worst criteria vector, for example Ajw indicates the preference value of criterion j compared to worst criteria W.
e.
Calculate the optimal weight
The optimal weight for each pair of W^ / Wj and Wj / Ww, kita memiliki W b/ Wj = dan
Wj / ww = . To fullfil conditions for all j , we must fnd the absolute difference is
∣Wr I I W,- I
maximum solutions | - aBj | and | - ajW | for all J is minimized. To determine the
optimal weight, the optimization model is formulated as follows. min maxj = { | Wj - aV|,|S- ajW | }
S.t.
∑ Wj=1
j
Wj ≥0,for all j
(3)
(4)
Equation (II.4) can be convertded into model as follows.
min ξ
s.t.
| ^ - aBj|≤ξ, for all j
w; I
| — - aJW|≤ξ, for all j
Ww I
∑ Wj=1
J
Wj ≥0,for all j
The optimal weight (w ∗, w∗ ,…, ∗) is produced by solving Equation (4).
The MARCOS based on relation between the alternative and the preference value (ideal and anti-ideal). Pereferences value is calculate using the utility function. The utility function represents alternative positions with respect to ideal and anti-ideal solutions. The best alternative that can be chosen is the alternative that has the closest to the ideal and farthest from the anti-ideal prefrences value. The decision preference is defined based on the utility function. The utility function represents alternative positions with respect to ideal and anti-ideal solutions. The calculation steps for the MARCOS method are as follows [10]. a. Form Initial Decision Matrix
In this step, form initial decision matrix consist of several alternative and criteria.
-
b. Form Expansion of Initial Decision Matrix
The expansion of the initial matrix is carried out by determine the ideal (AI) and anti-ideal
(AAI) solutions.
C1
C2
C
…
AAI
χaal
Xaa2
… 1
A1
⎡ X11
X12
… ⎤
X=
X22
…
(5)
…
Xml
X22
…
AI
⎣
χai2
… ⎦
The anti-ideal solution (AAI) is the worst alternative meanwhile the ideal solution (AI) is the best alternative. Based on criteria type, AAI and AI are calculate by Equations (6) and (7).
AAI = (6)
AI = (7)
Where B represents the benefit criteria group, while C representing the cost criteria group.
c.
Matrix Normalization Expansion (X)
The normalized matrix elements N = [n,,l
l ij ⅛×n
nlj
if jeC
are generated by Equations (8) dan (9).
(8)
d.
e.
f.
n iJ = x-
(9)
Where the elements and represent the elements from matrix .
Form Weighted Decision Matrix V
Weighted matrix V is calculate by multiplying the normalized matrix N with the coefficient weight .
Vij = nij × wj
(10)
Calculate the Utility Value of Alternatives Ki
The utility value of an alternative in relation to the anti-ideal and ideal solutions is calculated by Equations (11) and (12).
KΓ =
Sj Saat
Sai
(11)
(12)
Where Sι(i = 1,2,3,..., m) represents the number of elements of the weighted matrix V in Equation (13).
St = ∑H 1v lj
(13)
Determine the Utility Function of the Alternatives/(Ki)
The utility function is a compromise of the alternatives observed in terms of ideal and antiideal solutions. The utility function of the alternatives f(K[) is defined by Equation (14).
f (K1) =----LrZLi-----
(14)
j v l) 1 -f(K↑) 1 -f (K) )
f (K↑) f(κ-)
Where f(Kι ) related to the anti-ideal solution, while /(Kf ) related to the ideal solution. The utility functions for ideal and anti-ideal values are calculate using Equations (15) and (16).
f (κl- ) =
(15)
(16)
f (K? ) =
g.
Rank Alternatives
Ranking based on the utility function value, greater the value then higher the ranking get.
The first step is calculating the optimal weight of the criteria using the BWM method. Users will determine the best criteria and the worst criteria then determine the comparison weight between the best and worst criteria against other criteria.
Table 1. Weight Comparison of Best Criteria with Other Criterias
Best to Others
Budget
Budget 1
Time
9
Rating 6
Table 2. Weight Comparison of Other Criterias with Worst Criteria
|
Others to the Worst |
Rating |
|
Budget |
6 |
|
Time |
2 |
|
Rating |
1 |
Based on the calculation results, the weighting results obtained for the budget criteria is 0.79, for the time criterion is 0.10 and for the rating criteria is 0.11. The second stage using the MARCOS method, a normalized matrix is formed which can be seen in Table 3.
|
Table 3. I |
Normalized Matrix | ||||
|
Criteria | |||||
|
Budget Time Rating | |||||
|
No. ID |
Object Attraction |
Cost Cost Benefit | |||
|
1. (A1) |
Pantai Pandawa |
0 |
1 |
0.978 | |
|
2. (A2) |
Pantai Balangan |
0 |
1 |
1 | |
|
3. (A3) |
Pantai Labuan Sait |
0 |
1 |
0.956 | |
|
4. (A4) |
Taman Budaya Garuda Wisnu Kencana (GWK) 0 |
0.5 |
0.956 | ||
|
5. (A5) |
Pura Uluwatu |
0 |
1 |
0.978 | |
|
6. (A6) |
Pantai Jimbaran |
0 |
1 |
0.933 | |
|
7. (A7) |
Pantai Suluban |
0 |
1 |
0.956 | |
|
8. (A8) |
Pantai Kuta |
0 |
1 |
1 | |
|
9. (A9) |
Waterboom |
0 |
0 |
1 | |
|
10. (A10) |
Sangeh |
0 |
0.5 |
0.956 | |
|
11. (A11) |
Pura Taman Ayun |
0 |
0.5 |
0.978 | |
|
Min / Max |
0 |
60 |
5 | ||
|
Table 4. Weighted Normalized Matrix | |||||
|
Criteria | |||||
|
Budget |
Time |
Rating | |||
|
No. ID |
Object Attraction |
Cost |
Cost |
Benefit |
Total |
|
1. (A1) |
Pantai Pandawa |
0 |
0.172 |
0.057 |
0.229 |
|
2. (A2) |
Pantai Balangan |
0 |
0.086 |
0.061 |
0.147 |
|
3. (A3) |
Pantai Labuan Sait |
0 |
0.086 |
0.054 |
0.140 |
|
4. (A4) |
Taman Budaya Garuda |
0.086 |
0.058 |
0.144 | |
|
Wisnu Kencana (GWK) |
0 | ||||
|
5. (A5) |
Pura Uluwatu |
0 |
0.172 |
0.054 |
0.226 |
|
6. (A6) |
Pantai Jimbaran |
0 |
0.115 |
0.061 |
0.176 |
|
7. (A7) |
Pantai Suluban |
0 |
0.172 |
0.056 |
0.228 |
|
8. (A8) |
Pantai Kuta |
0 |
0.172 |
0.041 |
0.213 |
|
9. (A9) |
Waterboom |
0 |
0.172 |
0.054 |
0.226 |
|
10. (A10) Sangeh |
0 |
0.115 |
0.048 |
0.162 | |
|
11. (A11 |
) Pura Taman Ayun |
0 |
0.086 |
0.063 |
0.148 |
|
Ideal Value |
0 |
0.100 |
0.110 |
0.210 | |
|
Anti Ideal Value |
0 |
0.033 |
0.103 |
0.136 | |
|
Table 5. Tourist Attraction Ranking Result | |||||
|
No. ID |
Object Attraction |
Utility |
Ranking | ||
|
Value | |||||
|
1. (A8) |
Pantai Kuta |
0.797 |
1 | ||
|
2. (A11) |
Pura Taman Ayun |
0.797 |
2 | ||
|
3. (A2) |
Pantai Balangan |
0.788 |
3 | ||
|
4. (A1) |
Pantai Pandawa |
0.779 |
4 | ||
|
5. (A5) |
Pura Uluwatu |
0.779 |
5 | ||
|
6. (A6) |
Pantai Jimbaran |
0.769 |
6 | ||
|
7. |
(A7) |
Pantai Suluban |
0.598 |
7 |
|
8. |
(A9) |
Waterboom |
0.598 |
8 |
|
9. |
(A3) |
Pantai Labuan Sait |
0.589 |
9 |
|
10. |
(A10) |
Sangeh |
0.589 |
10 |
|
11. |
(A4) |
Taman Budaya Garuda Wisnu Kencana (GWK) |
0.544 |
11 |
The third step is the stage of forming a tour package based on the previous ranking results by taking into account the budget and time owned by tourists. The tour packages formed can be seen in Table 6.
Table 6. Badung Tour Packages
|
Accomodation |
The One Legian Kuta Rent Car 2 |
700000 600000 | |
|
Tourist Attraction |
Pantai Kuta Pura Taman Ayun Pantai Balangan Pantai Pandawa Pura Uluwatu Pantai Jimbaran |
Babi Guling Malen Menega Cafe Soto Ceker Pasar Kuta Nasi Ayam Bu Oki Sate Nyoman Bledor |
Beachwalk Discovery Lippo plaza Mall Bali Galeria |
|
Calculation |
Buget Total Remaining Budget Time Total |
1975000 25000 19 |
The tour package recommendation menu is a menu that is used to find recommendations for tour packages that can be visited by tourists. Users who want to look for tour package recommendations must also first input the criteria on the SPK form which can be seen in Figure 2.
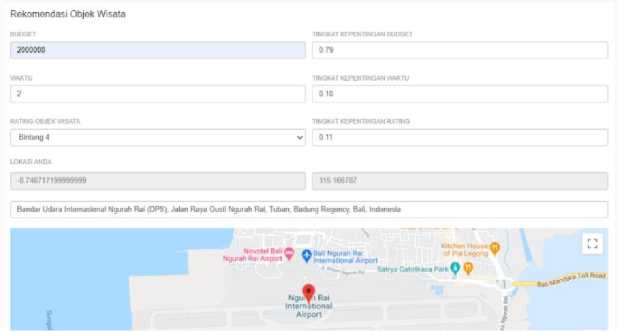
Figure 2. DSS Form of Tour Package Recommendations
Figure 2 show the tour package recommendation menu. The user must input the values for each criterion and the criteria weights on the DSS form. The budget that is inputted is the maximum budget that is owned by the user which will be related to ticket prices for tourist attraction and the total price of tour packages. The time that is inputted is the maximum time the user has both travel time and time at a tourist attraction. The tourism object rating chosen is the minimum rating of the desired tourist attraction. The results of tour package recommendations can be seen in Figure 3 for tour package recommendations 1, Figure 4 for tour package recommendations 2 and Figure 5 for tour package recommendations 3.
Hasil Rekomendasi
Rekcmendasi Paket Vrisata Ranking 1 Rekomendasi Paket Vrisata Ranking 2 Rekomendasi Paket Wisata Ranking 3
Rekomendasi Paket Wisata di Bali
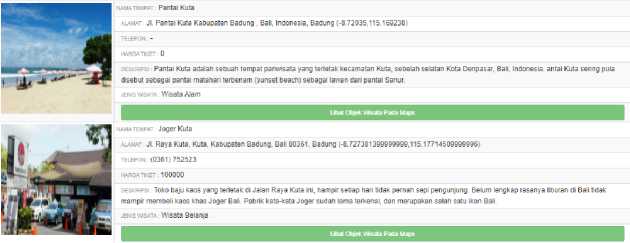
Figure 3. Tour Package Recommendation Result 1
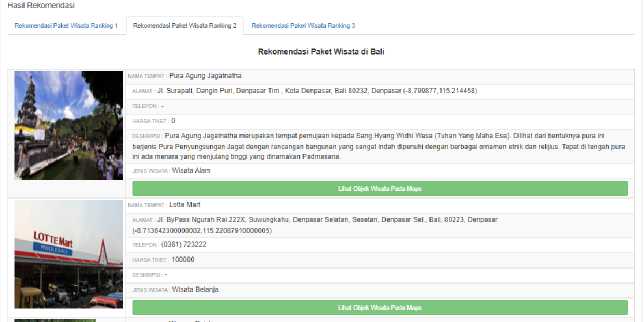
Figure 4. Tour Package Recommendation Result 2
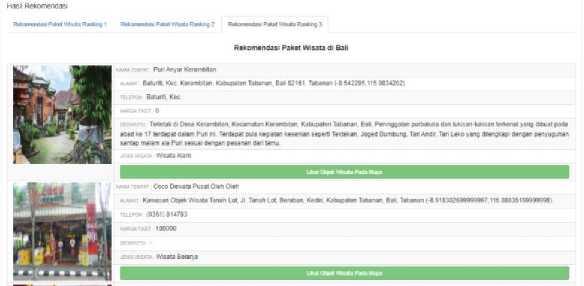
Figure 5. Tour Package Recommendation Result 3
Figure 3, Figure 4 and Figure 5 display the tour package recommendations result that generated by the system. The process of searching for packages starts from the ranked tourism object and then one by one is checked whether it still meets the budget and time remaining, if it is still included in the package. The same process will be carried out to find recommendations for the second and third packages.
Testing is done by comparing the results of ranking and grouping tour packages between experts with a system using confusion matrix. The confusion matrix contains information that compares the results of the classification that should be which is the match between the actual class and prediction class [15]. The test data used are 31 data of tourist attraction in Badung Regency. The confusion matrix results can be seen in Table 7.
Table 7. Confusion Matrix Result
Predicted Class
Actual Class Positive Negative
Positive True Positive (TP) False Negative (FN)
13 5
Negative False Positive (FP) True Negative (TN)
3 10
The explanations of TP, TN, FP, FN as follows.
-
a. TP is True Positive, which is the number of tourist attractions that are included in the
system package also exist in the expert package
-
b. TN is True Negative, which is the number of tourist attractions that are not included in
the system package and also does not exist in the expert package
-
c. FP is False Positive, which is the number of tourist attractions that are included in the
system package but does not exist in the expert package
F N is False Negative, which is the number of tourist attractions that are not included in
the system package but exist in the expert package.
Table 7 show the classification results using confusion matrix. From 31 tourist attraction data, there are 13 object attractions including 13 True Positive, 5 False Negative, 3 False Positive and 10 True Negative. Based on the test results on expert tour packages with system tour packages using the BWM-MARCOS method, the accuracy results is 74.19%, precision is 81.25%, recall / sensitivity is 72.22% and specificity is 76.92%. The conclusion obtained from testing this accuracy is that the BWM-MARCOS method can be used as a method for the DSS in forming tour packages because of its good level of accuracy.
The conclusion that can be drawn from this research is that the decision support system built is able to provide several choices of tour package recommendations that tourists can go to according to the desired criteria. The test results of expert tour packages using confusion matrix get an accuracy of 74.19% which categorized as good, precision of 81.25% which categorized as very good, recall/sensitivity of 72.22% which categorized as good and specificity of 76.92% which which categorized as very good. This shows that the BWM-MARCOS method can be used as a method for SPK in forming tour packages because it has a good accuracy value, very good precision value, good recall value and very good specificity value.
References
-
[1] M. A. A. Hutasuhut dan P. Irfan, “Sistem Informasi Pemasaran Paket Tour Koperasi
Karya Wisata Senggigi Berbasis Web,” MATRIK J. Manajemen, Tek. Inform. dan Rekayasa Komput., vol. 18, no. 1, hal. 86–96, 2018, doi: 10.30812/matrik.v18i1.322.
-
[2] I. W. Agus, S. Darma, I. P. Eka, G. Gunawan, dan N. P. Sutramiani, “Peramalan Jumlah
Kunjungan Wisatawan Menggunakan Triple Exponential Smoothing,” J. Ilm. Merpati, vol. 8, no. 3, hal. 211–221, 2020.
-
[3] H. I. Salam, J. Widodo, dan M. Zulianto, “Strategi Pemasaran Pada Pt Nuansa Wisata
Prima Nusantara Tour & Travel Jember,” J. Pendidik. Ekon. J. Ilm. Ilmu Pendidikan, Ilmu Ekon. dan Ilmu Sos., vol. 13, no. 1, hal. 66, 2019, doi: 10.19184/jpe.v13i1.10422.
-
[4] I. N. Agus, A. Dwijayadi, I. M. A. Wirawan, D. Gede, Dan H. Divayana, “Penentuan Hotel
di Kecamatan Buleleng Dengan Metode Analytic Hierarchy Process (AHP) dan Technique For Others Reference By Similarity To Ideal Solution (TOPSIS) Jurnal Nasional Pendidikan Teknik Informatika,” vol. Vol.7 No.2, no. Issn 2548-4265, hal. 163– 176, 2018.
-
[5] S. J. Sadjadi dan M. Karimi, “Best-worst multi-criteria decision-making method: A robust
approach,” Decis. Sci. Lett., vol. 7, no. 4, hal. 323–340, 2018, doi:
10.5267/j.dsl.2018.3.003.
-
[6] G. Ilieva, T. Yankova, V. Hadjieva, R. Doneva, dan G. Totkov, “Cloud Service Selection
as a Fuzzy Multi-criteria Problem,” TEM J., vol. 9, no. 2, hal. 484–495, 2020, doi: 10.18421/tem92-09.
-
[7] S. E. Torkayesh, A. Iranizad, A. E. Torkayesh, dan M. N. Basit, “Application of Bwm-
Waspas Model for Digital Supplier Selection Problem: a Case Study in Online Retail Shopping,” J. Ind. Eng. Decis. Mak., vol. 1, no. 1, hal. 12–23, 2020, doi:
10.31181/jiedm200101012t.
-
[8] A. Sabilla Ajrina, R. Sarno, dan R. V. Hari Ginardi, “Comparison of AHP and BWM
Methods Based on Geographic Information System for Determining Potential Zone of Pasir Batu Mining,” Proc. - 2018 Int. Semin. Appl. Technol. Inf. Commun. Creat. Technol. Hum. Life, iSemantic 2018, hal. 453–457, 2018, doi:
10.1109/ISEMANTIC.2018.8549818.
-
[9] A. Puška, I. Stojanović, A. Maksimović, dan N. Osmanović, “Project Management
Software Evaluation by Using the Measurement of Alternatives and Ranking According to Compromise Solution (MARCOS) Method,” Oper. Res. Eng. Sci. Theory Appl., vol. 3, no. 1, hal. 89–101, 2020, doi: 10.31181/oresta2001089p.
-
[10] Ž. Stević dan N. Brković, “A Novel Integrated FUCOM-MARCOS Model for Evaluation of Human Resources in a Transport Company,” Logistics, vol. 4, no. 1, hal. 1–14, 2020, doi: 10.3390/logistics4010004.
-
[11] V. D. Iswari, F. Y. Arini, dan M. A. Muslim, “Decision Support System for the Selection of Outstanding Students Using the AHP-TOPSIS Combination Method,” Lontar Komput., vol. 10, no. 1, hal. 40, 2019, doi: 10.24843/lkjiti.2019.v10.i01.p05.
-
[12] A. Muljadi, A. Khumaidi, dan N. L. Chusna, “Implementasi Metode TOPSIS Untuk Menentukan Karyawan Terbaik Berbasis Web Pada PT . Mun Hean Indonesia,” J. Ilm. Merpati, vol. 8, no. 2, hal. 101–112, 2020.
-
[13] I. N. A. A. Dwijayadi, I. M. A. Wirawan, dan D. G. H. Divayana, “Pengembangan Sistem Pendukung Keputusan Penentuan Hotel Di Kecamatan Buleleng Dengan Metode Analytic Hierarchy Process (Ahp) Dan Technique for Others Reference By Similarity To Ideal Solution (Topsis),” Kumpul. Artik. Mhs. Pendidik. Tek. Inform., vol. 7, no. 1, hal. 10, 2018, doi: 10.23887/karmapati.v7i1.13590.
-
[14] J. Rezaei, “Best-worst multi-criteria decision-making method,” Omega (United Kingdom), vol. 53, hal. 49–57, 2015, doi: 10.1016/j.omega.2014.11.009.
-
[15] M. D. Yudianto, T. M. Fahrudin, dan A. Nugroho, “A Feature-Driven Decision Support System for Heart Disease Prediction Based on Fisher’s Discriminant Ratio and
Backpropagation Algorithm,” Lontar Komput., vol. 11, no. 2, hal. 65, 2020, doi:
10.24843/lkjiti.2020.v11.i02.p01.
Decision Support System for Tour Package Recommendation in Bali Using BWM-MARCOS 152
Method (Ni Ketut Pradani Gayatri Sarja)
Discussion and feedback