Sentiment Analysis of Merdeka Belajar-Kampus Merdeka Program on Twitter Using the Naive Bayes Algorithm
on
JURNAL ILMIAH MERPATI VOL. 11, NO. 2 AUGUST 2023
p-ISSN: 2252-3006
e-ISSN: 2685-2411
Sentiment Analysis of Merdeka Belajar-Kampus Merdeka Program on Twitter Using the Naive Bayes
Algorithm
I Made Teguh Arthanaa1, Putu Veda Andreyanaa2, Muhammad Fauzia3 aDepartment of Information Technology, Faculty of Engineering, Udayana University e-mail:1teguh.arthana@student.unud.ac.id, 2putuveda@unud.ac.id, 3masfauzi001@student.unud.ac.id
Abstrak
Merdeka Belajar-Kampus Merdeka (MBKM) adalah suatu model pembelajaran di perguruan tinggi yang memberikan kebebasan dan fleksibilitas kepada mahasiswa. Model ini bertujuan untuk menciptakan budaya kreatif, inovatif, dan tidak membatasi, dengan memberikan kesempatan kepada mahasiswa untuk belajar selama tiga semester di luar program studi mereka. Program ini merupakan inisiatif dari Kementerian Pendidikan dan Kebudayaan Republik Indonesia sebagai respons terhadap dampak pandemi Covid-19. Namun, program MBKM menerima tanggapan yang bervariasi dari masyarakat, terutama dari mahasiswa. Mengingat ini merupakan kebijakan baru, penting untuk melakukan analisis dan evaluasi program ini dengan melibatkan umpan balik dari masyarakat untuk meningkatkan kinerjanya. Dalam penelitian ini mendapatkan nilai akurasi sebesar 78% dari model untuk dapat membedakan kelas positif, negatif, dan netral dari 203 data testing yang digunakan atau 20% dari keseluruh data (1015 data).
Kata kunci: Analisis Sentimen, MBKM, Naive Bayes
Abstract
Merdeka Belajar-Kampus Merdeka (MBKM) is a learning model in higher education that provides freedom and flexibility to students. This model aims to create a culture of creativity, innovation, and non-restriction by allowing students to study for three semesters outside their study programs. The program is an initiative of the Ministry of Education and Culture of the Republic of Indonesia in response to the impact of the Covid-19 pandemic. However, the MBKM program has received varied responses from the public, especially from students. As this is a new policy, it is important to conduct analysis and evaluation of this program involving feedback from the community to enhance its performance. In this research gets an accuracy value of 78% of the model to be able to predict positive, negative, and neutral classes from the 203 testing data used or 20% of all data (1015 data).
Keywords: Sentiment Analysis, MBKM, Naive Bayes
In the digital era, the advancement of the internet has made significant progress in the development of global technology and various aspects of communication and computer processes have undergone many changes and developments. The hope is that there will be a greater increase in the number of social networks that exist on the internet. Social networks are platforms used by users as a place to show themselves through dialogue with other users, collaborate, and solve various problems that arise in social networks. Twitter is an independent social network, where all users have the freedom to express their opinions. The data contained on Twitter has great power and can affect users in Indonesia. One of the advantages of the Twitter social networking site is that it provides an extraordinary API, allowing anyone to easily access data from Twitter [1].
Big Data refers to a set of data that is very large and complex in size, so it cannot be processed using traditional database management tools or other data processing applications.
Based on this definition, it can be concluded that Big Data has three main characteristics which are often referred to as 3V, namely volume, velocity, and variety. Volume refers to the enormous amount of data that needs to be managed. Velocity includes the speed of data processing that must keep pace with the rapid growth in the amount of data. Meanwhile, variety describes a variety of diverse data sources, including structured data and unstructured data [15].
Merdeka Belajar-Kampus Merdeka (MBKM) is a learning model in higher education that provides autonomy and flexibility to students. The aim of this model is to create a creative, innovative and non-limiting culture according to the needs of students who are given the opportunity to study for 3 (three) semesters outside their study program. This program is an initiative of the Ministry of Education and Culture of the Republic of Indonesia in response to the impact of the Covid-19 pandemic. However, the MBKM program also received positive and negative responses from the community, especially from students who felt the impact and had different views on MBKM policies. Since this is a new policy, it is important to analyze and evaluate this program in order to improve its performance through feedback from the public [2].
Twitter can be a social media platform used as a dataset in sentiment analysis. In Indonesia, this country is ranked fifth in terms of the largest number of Twitter users. In 2022, the number of Twitter users in Indonesia will reach 18.45 million. Based on this potential, an analysis of public sentiment regarding the MBKM program will be carried out using data from Twitter. In this study, data will be processed using the NLP algorithm to calculate polarity values and determine labels for each data. The final stage involves classification using the K-Nearest Neighbor (KNN) algorithm which was chosen because it has a high degree of accuracy. Determining the value of k will be based on achieving the highest level of accuracy. The purpose of this research is to gain insight into the community's response to the MBKM program. The results of the research will be used as suggestions for improvement for the Ministry of Education, Culture, Research and Technology (Kemendikbudristek) [4].
Previous research by Prasetyo, et al assessed sentiment analysis of the Merdeka Belajar policy using the Naive Bayes algorithm to classify sentiments from 180 tweet data resulting in an accuracy value of 80.55% and the majority of sentiments towards these policies were positive [2].
The research method refers to a series of systematic steps used to collect, analyze, and interpret data in a study. The research method aims to develop a structured and logical framework, enabling researchers to answer research questions or test hypotheses that have been proposed. The following is a flowchart of the stages of the MBKM program sentiment analysis
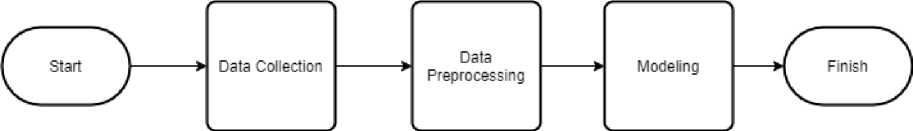
Figure 1. Research Method
The picture above is a flowchart of the stages carried out in conducting sentiment analysis for the MBKM program on Twitter. In the flowchart above, the first stage is the data collecion stage (collecting datasets), then the data preprocessing stage (preparing data and cleaning the data before modeling the data), and the last stage, namely modeling, is the stage of creating a Naive Bayes model for analysis. sentiment on the dataset.
In Figure 2 is the data collection stage, namely the dataset collection stage on Twitter. The data collection process is carried out by crawling using the Selenium Python library, and the crawled data is stored in csv format.
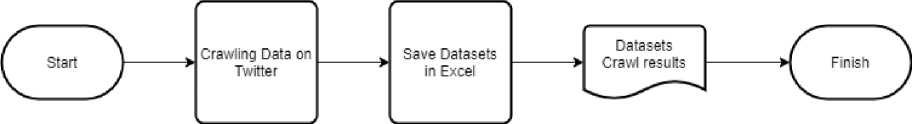
Figure 2. Data Collection
Figure 3 is a flowchart image of the data preprocessing stage. The data preprocessing stage carried out was labeling 1015 data with comparisons (330 positive, 332 negative, and 353 neutral), removing special characters (#,$.@, etc.) in the dataset, deleting numbers, deleting punctuation marks, deleting emoticons, delete single characters, perform word tokenization, remove stopwords in words, perform steaming on say, do vectorizer (change say become binary form (0,1)), calculates the value TFIDF on each word, and store the preprocessing result dataset into.format.csv.
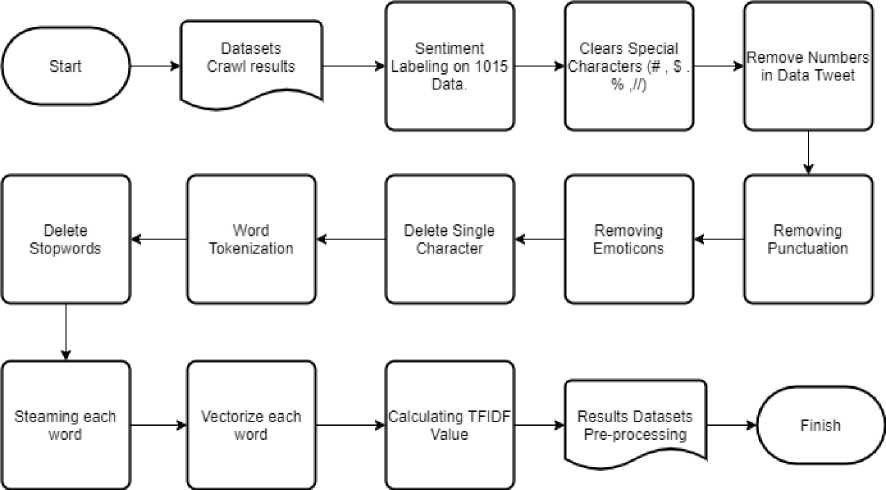
Figure 3. Data Preprocessing
Figure 4 shows the naive Bayes modeling flowchart on the cleaned dataset. In the flwochart above, after going through the preprocessing stage, namely naive Bayes modeling using the Python programming language, then evaluating the model if the model accuracy value is small (less than 60%), and after evaluating the next stage, namely visualizing the confusion matrix, ROC curve, and Wordcloud.
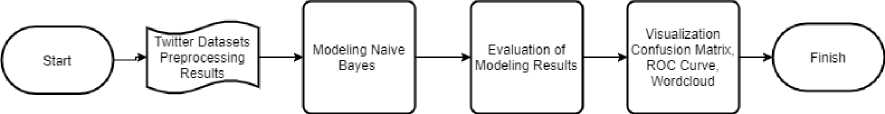
Figure 4. Modelling
Sentiment analysis is a computational study of opinions, sentiments, and emotions expressed in text (Liu, 2011). The basic task in sentiment analysis is to classify the polarity of the text in documents, sentences or opinion pieces. Polarity means whether the text in documents, sentences, or opinions has positive or negative aspects [8].
Merdeka Belajar-Kampus Merdeka is a policy initiated by the Minister of Education and Culture with the aim of encouraging students to have a deep understanding in various fields of knowledge, so that they are ready to face challenges in the world of work. This policy is in line with the provisions contained in Permendikbud Number 3 of 2020 which regulates National Higher Education Standards [12].
The Naive Bayes algorithm is a classification algorithm that is widely used in data mining or text mining [9]. The Naive Bayes algorithm is based on the Bayes theorem that all activities make an equal or independent contribution to the selection of a particular class. One of the classification methods to determine the description of people's perceptions in Text Mining is the Naïve Bayes method which is often called the Naive Bayes Classifier [10], [11].
P(H∣X) = ^≡F(H∣X) =£^£22
v 1 P(X) 1 ' P(X)
(1)
Information:
X = Data with unknown class
H = Hypothesis data X is class special
P(H|X) = Probability of hypothesis H based on condition X
P(H) = Probability of hypothesis H
P(X|H) = Probability of the hypothesis X based on the
condition HP P(X) = Probability of X
Probability calculations using the naïve Bayes algorithm for sentiment analysis go through the following stages.
-
3.3.1 Calculating TF-IDF
TF-IDF (Term Frequency-Inverse Document Frequency) is a method used in natural language processing and information retrieval to measure the importance of a word in a document or collection of documents
TF - IDF = tfxvx Log I — JTF - IDF = tfxvx Log I — J
(2)
…………………….
Information:
Tf (x, y) = Frequency of the x word in Document y dfx = Number of Documents Containing the Word x N = Total Number of Documents
-
3.3.2 Count Prior Probability
∖docs j∖
………………………………………………………
(3)
Information:
P(Vj) = Probability of Class Category to j
Docs j = Category Sentiment Class i (negative, neutral, positive) Example = Number of Categories Total (positive, negative, neutral)
3.3.3 Calculating the Probability of Words in Categories
(4)
Information:
P(Vj|Xi) = Probability of the ith word in the jth category
nk = number of words x in category I (posive, negative, neutral) n = total sentiment category (i)
|vocabulary| = total vocabulary
3.3.4 Calculating Posterior Probability Values

(5)
Information:
Vmap i = posterior probability of category i (positive, negative, neutral) P(xi|Vj) = Probability of word i in category j
P(Vj) = Prior probability of the jth category (positive, negative, neutral)
The evaluation matrix is a matrix used to measure the extent to which the model can correctly predict a label in the test data. The higher the accuracy value, the better the model can classify data correctly. In the evaluation matrix, there are 4 types of metrics that can be used to measure model performance in classifying, namely accuracy, precision, recall, and f1-score. Accuracy is an evaluation metric that measures the ability of a model to classify correctly as a whole. Recall is the success rate of the system in retrieving information. Precision is a measure of the model's ability to correctly classify a sentiment class. F1-Score is a comparison between precision and recall which is used to determine the accuracy of the data being tested.
accuracy =
TP+TN TP+TN
---------------Ciccitrcicv =---------------
…………………………….……
Information:
TP= True Positif
TN = True Negative FN = False Negative FP = False Positive
recall = x 100%recall = x 100%
(TP+FN) (TPFFN)
(6)
(7)
Information:
TP= True Positif
FN = False Negative
precision = —^ x 100%precision = —^ x 100%
r (I,P+FP) (TPFFP) ....................................... (8)
Information:
TP= True Positif
FP = False Positive
fl^™^
(recall+precision)
(9)
ROC (Receiver Operating Characteristic) Curve is a performance evaluation method used in classification modeling. The ROC curve depicts the relationship between the True Positive Rate (TPR) and the False Positive Rate (FPR) at various thresholds used to classify data. The TPR (sensitivity or recall) is the proportion of true positives that are correctly classified as positive out of all true positive data, while the FPR is the proportion of negatives that are incorrectly classified as positive out of all true negative data. ROC Curve visualizes changes in TPR and FPR when the threshold changes from the lowest to the highest. The ROC Curve is used to evaluate model performance if there are 2 classes, but if there are 3 or more classes (multiclass), then there will be 3 separate ROC curves for each combination (positive with negative, positive with neutral, negative with neutral), for each the combination of FPR and TPR uses the same formula as in the case of binary classification.
(TP) (TPFFN)
(10)
Information:
TPR =True Positif Rate
TP = True Positif
Fn = False Negative
PPR
^FPR = (Ff)
(11)
…………………………………………….…………
Information:
FPR = false positive rate
FP = False Positive
Mr = True Negative
Sio journalist pipin and Heru kurniawan conducted a sentiment analysis on the MBKM policy on Twitter user tweets from 2020 - 2022 with the keywords "MBKM", "MSIB" and " Merdeka Belajar" using the LSTM algorithm to analyze multiclass sentiment on Indonesian tweets into 6 (six) emotion classes. The results of this study produce an LSTM model that has been trained from a dataset of 658 tweets with the best accuracy value of 80.42%. The MBKM program sentiment analysis of user tweets was dominated by "confused" feelings, namely 39.51%, followed by "happy" feelings, namely 16.26%, "sad" feelings, namely 15.80%, "angry" feelings, namely 13.98 %, the feeling of "fear" is 7.29%, and the feeling of "surprise" is 7.14%. So it is important for studies to improve the MBKM program so that it has clear procedures and implementation so that students are comfortable and have positive sentiments about the MBKM program [2].
Erina Undamayanti, et al. Conducting research on the Merdeka Belajar-Kampus Merdeka program using the Naive Bayes method. In the research conducted, the results of
sentiment analysis were found which showed that 61.92% of the sentiment found was positive, indicating that the MBKM program was well received by Twitter users, especially students. Even though there were some negative sentiments around 38.08%. The results of this study can be a reference for the MBKM policy development team, especially the Ministry of Education and Culture's POKJA team, because this program can provide positive benefits and experiences for students. In addition, the results of this study can be used as evaluation material for future teams to make better improvements [1].
Elisa Febriyani and Herny Februariyanti conducted research on the Merdeka Belajar-Kampus Merdeka (MBKM) program using the naive Bayes classifier algorithm on Twitter. The purpose of this study is to analyze public opinion sentiment towards the MBKM program on Twitter in order to assess the accuracy of the method and the percentage of sentiment as an evaluation of the algorithm, performance, and the MBKM program itself. Data collection was carried out in real-time using the vicinitas.io website, focusing on tweets and retweets containing the hashtags #kampusmerdeka and #mbkm from November 2021 to March 2022. Analysis was carried out on 501 tweet data by classifying the text as either negative or positive using a naive classifier algorithm. bayes. Implementation of classification on the Naive Bayes algorithm involves several steps, including text preprocessing, TF-IDF calculations, classification calculations, and K-fold cross-validation. K-fold is used to evaluate the performance of the algorithm to achieve maximum accuracy. The program was developed using the Python programming language on the Google Colab platform provided by Google. The results of the visualization in this study are in the form of a word cloud that displays the most dominant words that appear in positive sentiments, such as campus, independence, mbkm, and programs, while negative sentiments include campus, Uang (money), Pocket (Pocket), and conversion. (conversion). Based on research findings, the classification system produces 272 opinions that are classified as positive sentiments and 229 opinions that are classified as negative sentiments, with an average accuracy of 60%, precision of 64%, recall of 58%, and f1 score of 58. % [5].
Research conducted by Abdul Rozaq, et al regarding sentiment analysis of the implementation of the Merdeka Belajar-Kampus Merdeka program using naïve Bayes, k-nearest neighbors and decision trees. Responses to the various Merdeka Belajar-Kampus Merdeka programs from the public expressed through social media varied, including positive, negative and neutral comments. The presence of these comments was able to create a growing sentiment among the general public and academics. Based on these problems, the researchers conducted a sentiment analysis of the implementation of the Merdeka Belajar-Kampus Merdeka program using comment data from Twitter. Data obtained from Twitter are classified into positive, negative, and neutral categories using the Naïve Bayes, K-Nearest Neighbors, and Decision Tree methods. A total of 475 data will be divided into two, namely training data and testing data. Data testing will cover 20% of the total data, while the remaining 80% of the total data will be used as training data. The results of the analysis show an accuracy of 99.22% for the Naive Bayes method, 96.90% for K-Nearest Neighbors, and 37.21% for the Decision Tree [6].
Irma Putri Rahayu and her team conducted research on the MBKM program using the Naïve Bayes and SVM algorithms. This study aims to analyze sentiment towards MBKM based on the existing positive and negative opinions. They focus on sentiment analysis on Twitter using the hashtag #kampusmerdeka from 2019 to 2022. The results show 86% accuracy, 87% precision and 80% recall for the Naïve Bayes algorithm. Meanwhile, the SVM algorithm with a linear kernel achieves 93% accuracy, 100% precision, and 84% recall when tested using the same dataset. [7].
Results and Discussion are an important part of a final report that presents the findings and interpretation of the results of the research or project undertaken. This section involves a description and analysis of the data collected, as well as providing conclusions based on the findings. It is important to provide an objective interpretation supported by strong evidence from the data collected. Findings and conclusions must be explained in a systematic manner and relevant to the research question or project objectives that have been set previously.
In Figure 5 is a tweet resulting from the scraping process on Twitter with a total of 4900 data. The tweet data will be cleaned first and labeled with positive, negative and neutral sentiments. The labeling process on the tweet data was done manually as many as 1015 data with comparisons (330 positive, 332 negative, and 353 neutral).
!WMt
O *ub w-ιuj program rrb⅜rτ∣ m>* su*a⅜a d<abe⅜ dengan embe<2 se∏ua erang punya ♦ewmpato' jι∏g sarva pβ⅛≠∙^ vtart∏w ⅜a bed» aMα∏M ga jarang png 1 ∣ιrtι∣ pane** *Ut tnnu ■ IttAlb d P Λdttι -IwritfwUttA h⅛B toil QttUhACttlMttb
-
2 ≡ι to ft D a≡ιaπ∏va -JFJbarffM cm IdMp n rτaw∏M* MBb Awt BipanftBai Hi no» ft. I** Mto BratM- ⅛rt M*bn m∙pang towema∣ km Btma m
-
3 ieurNR han ra*a Mtiftii 144a t∏Ub ∣!MΛcrt maaf Iahr dan is»’ atm∙ef>⅛j Rpton SntAnt «lain MβNM OuaiAuuUra MataRrt,M44lt Mmer
A M Sfτ TintTWi pnt⅛at ^≡M to∏a? Mu* rwcgwg gw vang vW<M mMHκrτp∙ tot npapan * hρtv∙v∙ τur⅞wt orang Ig «Mb ttttwngto*
4*3 7 ∣row ItiiMWMCkra Mb Mh aria to1
WS ⅜≡∙∣wvnrτftsh amτM∏ rw∏g d pnsangn abaft vp Myegaran*
4MD OtoMMrtirtti lΦ-t‰2tM*ħQn juttUto Cχimtt!iRtouι lιft'ra-ιiMfwnih5cAu=⅜2‰ttιft⅜Ωt∣β¼]ilOuιO-mħ 2α*Uβ⅛rMu>*¾^Mtfttf∣
-
4 W1 Ir-TywUh pate 2* ⅛-qj! JP ∣ An nw» abar⅞j a⅛j∏ beraftv d∣ wn *ffi90sβc∣β ymj ala bm DtoMutan ton soft ιow∙n manUh WB senwa meme
4M2 QabpapattOUT
-
Figure 5. Dirty Tweet Data
Preprocessing stage 1 is the process of cleaning the data, namely cleaning data from special characters, removing numbers, removing punctuation, deleting emoticons, deleting single characters, and giving sentiment labels (positive, negative, and neutral) to 1015 data that will be used for data training and data testing.
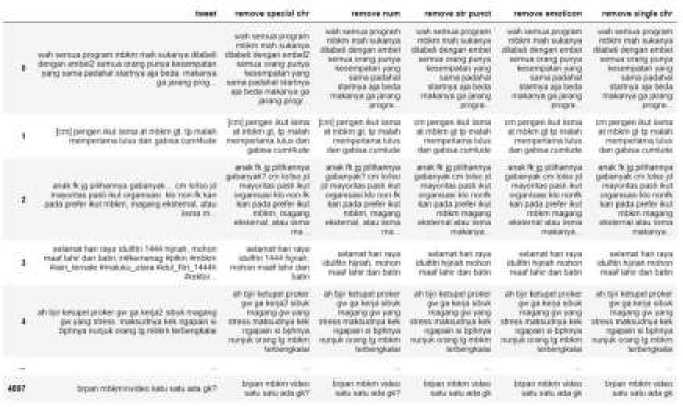
Figure 6. Preprocessing Step 1
Preprocessing stage 2 is the data pre-processing stage, namely preparing data before the modeling stage is carried out. In stage 2 preprocessing, namely doing word tokenization, normalizing words, removing stopwords, and stemming words.
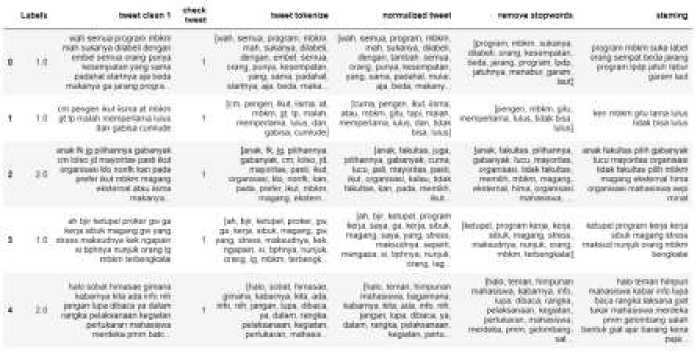
Figure 7. Preprocesing Step 2
In Figure 8 is the result of the weighting of each word using TFIDF. Results from weighting per word (TF-IDF) will be proceed to the modeling stage using an algorithm Naïve Bayes.
|
-,∙t,∙, |
∙∙w∙* |
∙*≠* |
(∙∣M∙ |
*w* « |
W |
*m |
**⅛ |
«Mi |
⅛ |
∙M∙M |
∣4∙*≡ |
∙4m |
•«•»•, |
kM∙ u |
■MM |
→≡ι |
*^∙*' | |||
|
60 |
DD |
• 0 |
OO |
an |
OO |
OO |
OQ |
OO |
PANO» |
QP |
QD |
OMMM |
BO |
OQ |
OO |
OP |
00 |
Ol |
QO |
QO |
|
60 |
0.0 |
OO |
Ob |
OO |
40 |
QC |
OQ |
OO |
DlMuMi |
OO |
QO |
OMOM |
|
PU |
0.0 |
u 0 |
00 |
Ql |
QD |
AO |
|
00 |
00 |
»0 |
U |
JE |
U |
HA |
IU |
|
Limm |
Qb |
U |
DCMMC |
IH |
HH |
DH |
Db |
Cfl |
Dt |
«1 |
IO |
|
»0 |
M |
OO |
OP |
OO |
OO |
n: |
0« |
OO |
l∙OOGM∣ |
OO |
QP |
OiKiM |
BO |
on |
OO |
OP |
00 |
Ol |
QO |
• 0 |
|
OD |
DO |
• D |
Qb |
QD |
QD |
Qt |
OQ |
OO |
Hoooddd |
QD |
QD |
a ODCtioa |
BO |
DO |
DQ |
Q D |
OO |
Qt |
OD |
DO |
|
00 |
00 |
OO |
OO |
«0 |
OO |
0> |
OQ |
OO |
OflMWO |
40 |
40 |
UOMOM |
to |
OO |
00 |
QO |
00 |
Ol |
40 |
to |
|
GiD |
DO |
OO |
OD |
QD |
QD |
Ol |
OQ |
□a |
Daaoaii |
QD |
DD |
a MBJJM |
■ D |
DQ |
DQ |
a D |
DD |
□ 1 |
QD |
AO |
|
00 |
OO |
OO |
QP |
OO |
40 |
OO |
OQ |
OO |
POOflWD |
OO |
40 |
∣)wcwe |
BO |
BU |
OM |
00 |
00 |
OB |
00 |
BO |
|
•c |
DD |
>0 |
α∙ |
QO |
QD |
at |
UQ |
ad |
FIJUUJDL' |
QD |
QD |
DWXQC |
U |
HO |
DUQ |
Qd |
OQ |
Ot |
Qt |
ID |
|
00 |
M |
DD |
OD |
QD |
0« |
DQ |
PMMtTI |
QD |
40 |
a dooms |
BO |
OQ |
M |
OO |
OO |
ar |
40 |
AO |
Figure 8. TF-IDF Value Weighting
At the model evaluation stage, using 203 testing data with comparisons (77 negative label data, 63 neutral label data, and 63 positive data labels), the following are the values of precision, recall, and f1-score. The average value of the precision score for positive labels is 0.77 or 77%, this means that the system is able to get accurate predictions of 77% of the total predictions made by 63 data for positive labels in data testing. The average value of the precision score for neutral labels is 0.66 or 66%, this means that the system is able to get accurate predictions of 66% of the total predictions made by 63 testing data for neutral labels. The average value of the precision score for negative labels is 0.92 or 92%, this means that the system is able to get accurate predictions of 92% of the total predictions made by 77 data testing for negative labels.
Recall Score is the success rate of the system in retrieving information. The average value of the recall score for positive label data is 75%. The average value of the recall score for neutral labeled data is 83%, this means that the system is able to obtain accurate predictions of 83% of the total data labeled neutral contained in the testing data. The average value of the recall score for negative label data is 78%.
F1-Score is a comparison between precision and recall which is used to determine the accuracy of the data being tested. The average value of the f1-score for a positive label is 0.86 or 86%, this shows that the system is able to predict data accurately by 86% of the total testing data that is labeled positive. The f1-score value for a neutral label is 0.73 or 73%, this means that the system is able to accurately predict data that is labeled neutral by 73% of the total testing data that is labeled neutral. The f1-score value for a negative label is 0.86 or 86%, this
means that the system can predict data that is labeled negative accurately by 86% of the total testing data that is labeled negative.
In Figure 9 is a confusion matrix table which contains the results of sentiment classification carried out by the model and visualized into a confusion matrix table which contains the correct amount of positive data (TP) classified by the model, namely 47 data from 63 positive label testing data. The number of positive incorrectly classified (FP) is 15 data, the number of correct negative data (TN) is 60 data from 77 testing data with negative labels. the number of incorrectly classified negative data (FN) is 3 data, the number of correct neutral data (TNet) is 52 data from 63 testing data with neutral labels, and the number of neutral data incorrectly classified (FNet) is 27 data.
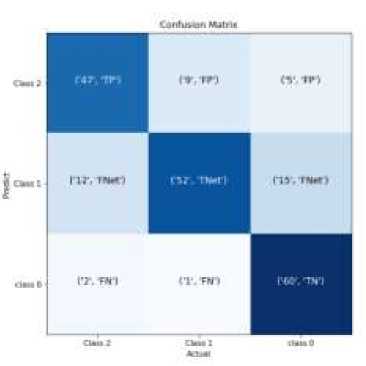
Figure 9. Confusion Matrix Result
Figure 10 is the ROC curve used to assess the model's ability to classify. The blue ROC curve shows the model's ability to classify negative sentiment with neutral, which is equal to 88%, the red ROC curve shows the model's ability to classify neutral and positive sentiment, which is equal to 82%, and the green ROC curve shows the model's ability to carry out the classification of positive and negative sentiment is equal to 82%.
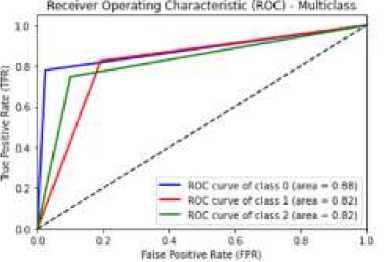
Figure 10. Display the ROC Curve
A wordcloud in sentiment analysis is a visual representation of the most frequently occurring words in the text being analyzed, which can provide an idea of the general sentiment or feeling associated with a particular subject or topic. In the context of sentiment analysis, wordcloud is used to identify the words that appear most often in a text that are considered relevant to positive or negative sentiments. The following is a positive sentiment wordcloud
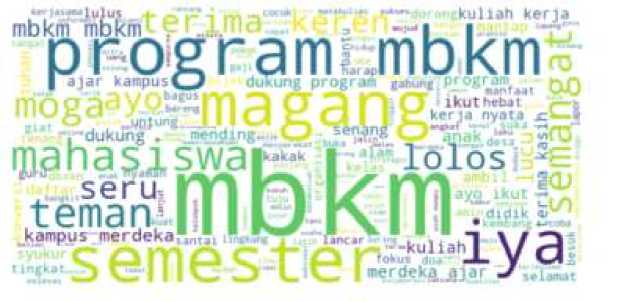
Figure 11. Wordcloud Positive Sentiment
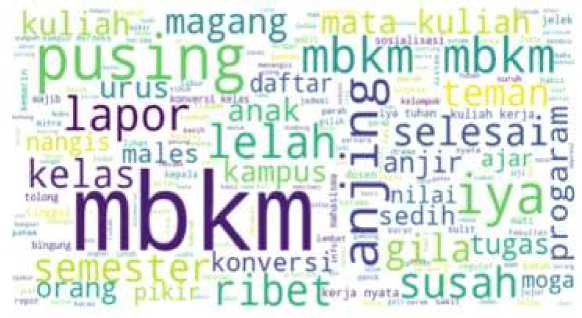
Figure 12. Wordcloud Negative Sentiment
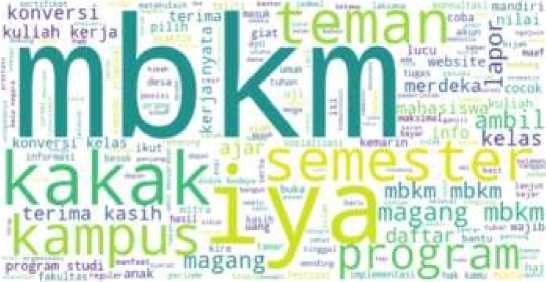
Figure 13. Wordcloud Netral Sentiment
Based on the sentiment analysis research of the Merdeka Belajar-Kampus Merdeka program on the Twitter application using the naïve Bayes algorithm, an accuracy score of 0.78 or 78% was obtained, this means that the system is able to accurately predict 78% of the total testing data, namely 203 data or 20% of the total data (1015 data). From the results of research on positive, neutral and negative sentiments towards MBKM, the average value of the recall score for positive labeled data was 75%, the average value of the recall score for neutral labeled data was 83%, the average value of the recall score for negative label data by 78%. When viewed from the amount of the resulting percentage, more students give sentiment or are neutral towards MBKM. These results indicate that students are enthusiastic about participating in MBKM.
References
-
[1] Erina U, Teguh Iman H, Ismi K, Analisis Sentimen Menggunakan Metode Naïve Bayes Berbasis Particle Swarm Optimization Terhadap Pelaksanaan Program Merdeka Belajar,Jurnal Sains Komputer & Informatika (J-SAKTI). 2022; 6(2): 916-930
-
[2] Sio Jurnalis P, Heru K, Analisis Sentimen Kebijakan MBKM Berdasarkan Opini Masyarakat di Twitter Menggunakan LSTM,Jurnal SIFO Mikroskil. 2022; 23(2): 197-208
-
[3] Nur A, Tati S, Gifthera D, Analisis Sentimen Pengguna Twitter Terhadap Pelaksanaan
Kurikulum MBKM,e-link Jurnal Teknik Elektro dan Informatika. 2003; 18(1): 57-64.
-
[4] Dewi S, Implementasi Algoritma K-Nearest Neighbour dalam Menganalisis Sentimen
Terhadap Program Merdeka Belajar Kampus Merdeka (MBKM),Jurnal Buana Informatika. 2023; 14(1): 69-76.
-
[5] Elisa F, Herny F, Analisis Sentimen Terhadap Program Kampus Merdeka Menggunakan Algoritma Naïve Bayes Classifier Di Twitter,Jurnal TEKNO KOMPAK. 2023; 17(1): 25-38.
-
[6] Abdul R, Yessi Y, Kelik S, Analisis Sentimen Terhadap Implementasi Program Merdeka Belajar Kampus Merdeka Menggunakan Naive Bayes, K-Nearest Neighboars Dan Decision Tree,JURNAL MEDIA INFORMATIKA BUDIDARMA. 2022; 6(2): 746-750.
-
[7] Irma Putri R, Ahmad F, Jamaludin I, Analisis Sentimen Terhadap Program Kampus Merdeka Menggunakan Naive Bayes Dan Support Vector Machine,Jurnal Sistem Komputer dan Informatika (JSON). 2022; 4(2): 296-301.
-
[8] Didik Garbian N, Yulison H, Agung W. Analisis Sentimen Pada Jasa Ojek Online Menggunakan Metode Naïve Bayes.SNST (Seminar Nasional Sains dan Teknologi). 2016; 1(1); 156-161.
-
[9] A. P. Wijaya, H. A. Santoso, J. T. Informatika, U. Dian, and N. Naive Bayes Classification pada Klasifikasi Dokumen Untuk Identifikasi Konten E-Government.J. Appl. Intell. 2016; 1(1): 48-55.
-
[10] A. R. Isnain, A. Sihabuddin, and Y. Suyanto, “Bidirectional Long Short Term Memory Method and Word2vec Extraction Approach for Hate Speech Detection.IJCCS (Indonesian J. Comput. Cybern.). 2020; 14(2).
-
[11] A. Amolik, N. Jivane, M. Bhandari, and M. Venkatesan. Twitter sentiment analysis of movie reviews using machine learning technique.Int. J. Eng. Technol. 2016; 7(6); 2038-2044.
-
[12] Elizabeth S, Indrawati Y. Merdeka Belajar Kampus Merdeka terhadap Perubahan Paradigma Pembelajaran pada Pendidikan Tinggi: Sebuah Tinjauan Literatur. JBME Jurnal Bisnis, Manajemen dan Ekonomi. 2021; 2(2): 30-38.
-
[13] Ketut Mediana A C, Agus Dwi S, Agung Cahyawan W. Analisis Sentimen Pembelajaran Daring Era Pandemi Covid-19 Menggunakan Naïve Bayes dan Support Vector
Machine.TEMATIK Jurnal Teknologi Informasi Komunikasi. 2023; 10(1): 47-53.
-
[14] J. H. Thrall et al. Artificial Intelligence and Machine Learning in Radiology: Opportunities, Challenges, Pitfalls, and Criteria for Success.Journal of the American College of Radiology. 2018; 15(3): 504-508.
-
[15] Ajif Yunizar P Y, Rafika S. Implementasi Algoritma Naïve Bayes untuk Klasifikasi Pemahaman Program MBKM bagi Mahasiswa.JIFORTY (Journal of Information and Information Security. 2022; 3(2): 171-180.
Sentiment Analysis of Merdeka Belajar-Kampus Merdeka Program on Twitter Using
the Naive Bayes Algorithm (I Made Teguh Arthana)
150
Discussion and feedback