Nowcasting the Number of Airplane Passengers at Ngurah Rai Airport Using Google Trends Data
on
LONTAR KOMPUTER VOL. 14, NO. 1 APRIL 2023
DOI : 10.24843/LKJITI.2023.v14.i01.p02
Accredited Sinta 2 by RISTEKDIKTI Decree No. 158/E/KPT/2021
p-ISSN 2088-1541
e-ISSN 2541-5832
Nowcasting the Number of Airplane Passengers at Ngurah Rai Airport Using Google Trends Data
I Putu Juni Adi Widianataa1, Nori Wilantikaa2
aDept. of Statistical Computing, Politeknik Statistika STIS Jakarta Timur, Indonesia
1 adiwidianata09@gmail.com 2wilantika@stis.ac.id
Abstract
Data on the number of aircraft passengers is essential to airport managers and the government's policies. The policy relates to improving the facilities and capacity of airports and other affected sectors, such as the transportation and tourism industries. A policy taken will be better if the data used is very close to the time of policy decision-making. Therefore, a technique is needed to forecast very close to the current condition of the number of aircraft passengers, namely nowcasting. One of the data sources that can be used for nowcasting is Google Trends data. In this study, the identification of relevant keywords used for nowcasting, the formation of nowcasting models, and the search for the best model for nowcasting the number of aircraft passengers was carried out. The nowcasting methods used are SARIMAX and multilayer perceptron. In this study, five relevant keywords were generated for domestic departures and two for international departures. In the nowcasting modeling, the best model for nowcasting domestic departures is produced, namely the multilayer perceptron with MAPE and MAE values of 11.194% and 28.048 respectively, while for departures Internationally, the best model was produced, namely SARIMAX with MAPE and MAE values of 8,641% and 50,205 respectively.
Keywords: Nowcasting, Google Trends, SARIMAX, airplane passengers, multilayer perceptron
Data on the number of aircraft passengers is one of the air transportation statistical data released by Badan Pusat Statistik (BPS) every month through the Official Statistical Statistics (BRS), divided into two types: domestic departure aircraft passengers and international departure aircraft passengers. The development of the number of aircraft passengers at an airport is essential regarding the policies that airport managers and the government will carry out. High-flight activity must be balanced with the airport's safety, facilities, and capacity factors. For example, such as the addition of a runway at Soekarno Hatta Airport by airport managers due to high flight activities at Soekarno Hatta Airport [1]. For the government, the increase in airplane passengers can be used to take a policy because high aviation activities will impact the economy, especially in the transportation and tourism industries.
Taking a policy requires data that is very close to the time of policy decision-making. Data on the number of aircraft passengers issued by BPS has a lag time of approximately two months from the reported data. With the time lag, data is not suitable to be used as a basis for policy decision-making. The closer the data period is to the decision-making time, the better the policies will be generated. Therefore, techniques are needed to carry out forecasting that is very close to the current conditions of the number of aircraft passengers.
Forecasting related to air passenger demand is essential to developing a proper airport operation plan in the aviation industry. The airport operation requires long-term demand forecasting to draw up a long-term plan and short-term demand forecasting to draw up more urgent plans, such as short-term maintenance plans, airport schedules, and monthly operation plans [2].
With the importance of short-term demand forecasting for airport managers and government policies, techniques are needed to make current predictions or nowcasting. Nowcasting is very
close to forecasting the present and the future. The process of nowcasting requires an indicator that can come from various sources. The development of technology and internet use in this digital era is developing very rapidly. In line with that, more and more new data can be used for nowcasting. One of the data sources that can be used for nowcasting is Google Trends data, which is available in real time.
Google is a search engine that is quite widely used. In Indonesia, from 2009 to October 2021, the average user who used Google as a search engine was 96.87%, with the highest reaching 98.78% occurring in February 2018 [3]. The percentage is calculated by comparing search engine users using Google against all search engine users. With such a large number of Google search engine users in Indonesia, the Google search index data can be used to represent the behavior of internet users in Indonesia. This is supported by research [4], which states that internet search data can provide an overview of the micro-behavior of internet users so that it can be used in predicting socioeconomic indicators.
Ngurah Rai Airport is one of the main airports in Indonesia. In addition, the airport is ranked in the top 100 best airports in the world [5]. Based on publications issued by BPS [6], the transportation and warehousing sector is the third largest contributor to the GRDP of Bali Province. In 2020, this sector generated an added value of only 15.66 trillion rupiah, a decrease of 36.24% compared to the previous year. The main cause of the decline in air transportation is the restrictions applied during the pandemic. The decline in air transportation impacts the decrease in flight activities at Ngurah Rai Airport, starting in the early quarter of the second quarter of 2020.
Bali Province is a province with a high level of internet penetration. Based on the publication of BPS [7], the percentage of people who have accessed the Internet aged five years and over is 61.06%. This percentage is higher than the national internet penetration rate of 53.73%. The significant level of internet penetration makes Bali Province the province with the fifth highest internet penetration rate in Indonesia in 2020. The high internet penetration rate in Bali Province can be used to see an overview of air transportation conditions through searches conducted on the Internet related to flight information.
Modeling nowcasting the number of airplane passengers at Ngurah Rai Airport with Google Trends requires keywords relevant to the data on the number of aircraft passengers. The search keywords obtained must be able to describe the indicators of the number of airplane passengers at Ngurah Rai Airport well. Therefore, the identification process is necessary for generating keywords suitable for delineating the indicator of the number of aircraft passengers at Ngurah Rai Airport.
In addition, models built for nowcasting should be appropriate for predicting the number of passengers in the aircraft. The model was created using statistically time-guided methods and machine learning, such as research [8], which uses SARIMAX and Neural Network (NN). Specifically, this study used one of the NN models with a perceptron multilayer architecture recommended in the study [9].
Google Trends is a service from Google that provides internet search information based on queries. Google Trends generates an index of search activity ranging from 0 to 100, measured based on comparing a particular query in the selected region and time against the total number of queries for the same period. Before making a comparison, Google Trends normalizes search data to facilitate comparison. The data on Google Trends shows the user's daily search, but there are unnatural searches as it is. Automated searches can be interpreted as spam attempts on search results[10]. For this reason, based on Google support, Google Trends filters several searches such as[10] :
-
1. Few people conduct searches: Google Trends only shows data for popular terms. Search terms with a low number will be displayed with a value of "0".
-
2. Duplicate searches: Google Trends removes repeated inquiries by the same user shortly.
-
3. Special characters: Google Trends filter queries related to punctuation and other special characters.
Data on the number of airplane passengers departing at Ngurah Rai Airport was obtained through the BPS website, and Google Trends index data was obtained from the Google Trends application using Python version 3.8.3 with an API for Google Trends, namely "pytrends." The keywords used for the index data collection process are relevant to nowcasting the number of passengers on domestic and international departure aircraft at Ngurah Rai Airport.
The stages of collecting Google Trends Index data in this study are as follows.
-
1. Define a list of basic keywords (seed queries)
Basic search keywords are relevant to air transportation, especially the number of domestic and international departing passengers at Ngurah Rai Airport. The basic search keywords are determined by researchers through theoretical studies related to air transportation demand and adding keywords derived from related research.
-
2. Download related queries
Related keywords are keywords that users also use when searching. Related keywords are obtained from basic keywords whose process has been provided by Google Trends with its features. Related keyword results from each base keyword are added to the base keyword list, increasing the number of keywords used.
-
3. Eliminate duplicate keywords
The results of related keywords added to the list of basic keywords are then eliminated. The elimination process to avoid duplicating related keywords is generated from each base keyword so that the resulting list of keywords is unique.
-
4. Download Google Trends Index data.
The list of keywords that have been obtained is then used to download Google Trends search index data. Downloading data is adjusted to the location of Ngurah Rai Airport, namely Bali Province.
-
5. Perform feature selection. This section consists of two stages: Pearson correlation with values over 0.7 and selection of LASSO variables. These two stages refer to research [11]
The research data period for Google Trends index data related to domestic departures and data on the number of domestic departure aircraft passengers is January 2016 – December 2021, while Google Trends index data related to international departures and data on the number of international departure aircraft passengers is January 2016 – February 2020.
The modeling method used for nowcasting in this study is SARIMAX and multilayer perceptron, whose process stages can be seen in Figure 1. Both methods are implemented in Rstudio. Data for modeling is divided into training data for the period January 2016–December 2020, with a total of 60 data for domestic departures and January 2016–February 2019 for international departures with 38 data, while data testing each with 12 testing data for domestic departures for the January 2021 period – December 2021 and international departures for the period March 2019 – February 2020.
Time series data can have seasonal movement patterns seen from the repeated increase or decrease in specific periods influenced by seasonal factors. The seasonal ARIMA model (SARIMA) is used if the data contains seasonal patterns. SARIMAX is a time series model called an extension of the SARIMA model. The extension contained in the SARIMAX model is the presence of additional or exogenous variables. The formation of the SARIMAX model begins with establishing the SARIMA model, which has fulfilled the parameter significance test and diagnostic test.

Figure 1. SARIMAX Method Flowchart (left) and Multilayer Perceptron (right)
The MLP method is one of the network architectures in ANN that has one or more hidden layers between the input and output layers. In MLP, data training is carried out through a backpropagation algorithm process. This algorithm can solve real problems with skilled architectural models by performing well for various data and recognizing complex patterns [12]. The backpropagation algorithm is carried out in two stages: feed-forward and backward. The data will be entered into the input layer in the forward feed. At this stage, there is a calculation process from the input layer stage through the hidden layer to reach the output layer that produces the predicted value. The resulting prediction error value can be known because the real value in training is known. Therefore, in the second stage, backward are carried out, and the error value generated from the previous process will be used to adjust the weight in each neuron on the output layer and hidden layer.
The nowcasting modeling results of the SARIMAX method and perceptron multilayer were then compared with error values. This study used several evaluation methods: Mean Absolute Percentage Error (MAPE) and Mean Absolute Error (MAE). For MAPE, there are criteria, namely [13] :
-
1. MAPE value is below 10%; then forecasting is excellent,
-
2. MAPE values are in the range of 10% - 20%, then forecasting is good,
-
3. MAPE values are in the range of 20% - 50%, then forecasting is quite good, and
-
4. MAPE value is greater than 50%; hence, the forecasting is poor.
-
3. Result and Discussion
-
3.1. Identify Relevant Keywords
-
3.1.1. Basic Search Keyword List
-
-
Researchers determine basic search keywords through theories related to air transport demand and add some basic keywords derived from previous research, namely research[8]. According to Kağan Albayrak, several factors that influence the demand for air transportation are income level, population, airport accessibility, air tickets, flight frequency, airline competition, and other modes of transportation [14]. Among these factors, there are two factors that researchers think can be used as a reference in determining basic search keywords because these two factors can be searched in searches on the Internet. The two factors are airfare and airline competition.
Air tickets can be seen from the search for prospective passengers regarding airfare prices and airline competition related to the airline's image, which can be seen from the search for prospective passengers for the particular airline to be used. For this reason, researchers used basic search keywords for airline ticket factors in the form of airline ticket sales sites and for airline competition factors using the name of the airline that serves domestic departures and the name of the airline that serves international departures.
With the large number of airlines that serve international departures, researchers limit only the airlines with the most departure destinations from 2016 – 2020—according to a publication issued by BPS Bali Province, Bali Province Air and Sea Transportation Statistics for 2016 – 2020 recorded that the most departure destination countries were Australia, Singapore, Malaysia, China, Qatar, and Hong Kong. For this reason, researchers are looking for airlines that serve departures to the country through information on the Internet. In addition, because Google Trends does not provide a search with few people, researchers ensure data availability in advance from each basic search keyword. Therefore, the following list of basic search keywords in Table I constitutes keywords with searches by quite a person.
Table 1. Basic Search Keyword List
|
Factor |
Domestic |
International |
|
tiket.com |
tiket.com | |
|
pegipegi |
pegipegi | |
|
Flight Ticket |
traveloka skyscanner |
traveloka skyscanner |
|
tripadvisor |
tripadvisor | |
|
nam air |
garuda Indonesia | |
|
citilink |
air asia | |
|
lion air |
jetstar | |
|
garuda indonesia |
malindo air | |
|
batik air |
qantas | |
|
airasia |
virgin australia | |
|
wings air |
batik air | |
|
sriwijaya air |
KLM | |
|
Airline |
scoot | |
|
Competition |
singapore airlines | |
|
malaysia airlines | ||
|
air china | ||
|
lion air | ||
|
china eastern airlines | ||
|
china southern airlines | ||
|
qatar airways |
Factor Domestic International
cathay
|
Previous |
airport |
airport |
|
Research |
flight |
flight |
|
Keywords |
booking |
booking |
Related search keywords are obtained from basic keywords whose process has been provided by Google Trends with its features. This process resulted in a total list of related search keywords of 597 for domestic and 842 for international departures. Then, the total keywords are added with basic search keywords, which are 613 for domestic and 867 for international departures.
The elimination is done on the total domestic and international departure search keywords list. From the process, 315 unique keywords out of 613 search keywords for domestic departures. It has generated 426 unique keywords for international departures out of 867 search keywords. After getting a list of unique keywords, it downloads Google Trends index data based on keywords resulting from the elimination process.
The downloaded Google Trends Index data is then selected by looking at Pearson's correlation value with data on the number of passengers departing domestic and international departures. This process obtained 69 keywords that correlated more than 0.7 for domestic departures and one for international departures. But among these keywords, there are irrelevant keywords related to domestic and international departures. Therefore, researchers manually eliminate keywords based on searching the meaning of each keyword on the Internet.
The elimination process obtained 40 relevant search keywords for domestic departures. However, no relevant keywords correlated more than 0.7; therefore, researchers lowered the minimum correlation limit to more than 0.6 for international departures to obtain two relevant search keywords. A correlation of more than 0.6 is based on the interpretation of a correlation value that is still quite strong for more than 0.6 [15].
In the LASSO variable selection process, the determination of the λ parameter is important because the λ parameter controls the reduction of the data dimensions. For this reason, researchers use the cv.glmnet() function in R software to assist in determining the right λ parameter by using the cross-validation rule to determine the exact value of k for k-fold crossvalidation. Still, the value of k is determined subjectively based on the number of instances in the data. It is generally used 5-fold or 10-fold [16]. This study uses 5-fold based on research [11]. The following explains the LASSO variable selection process results based on domestic and international departures.
-
a. Domestic Departures
Figure 2 is the process of determining the value of λ by providing the possible value of λ seen from the vertical line in the figure. The first vertical dash–dash line shows a value of λmin, which expresses the average of the minimum cross-validation errors, and the second vertical dash-dash line shows a value of λ1se stating the value that results in the most regular model so that the error from cross-validation is within one error standard Minimum. Based on Figure 2, the values λmin and λ1se indicate a value of five, stating that both values of λ give a variable sum of five on LASSO selection. In the LASSO process, determining the parameter value λ is very important because λ is a parameter that controls the reduction of data dimensions. According to [17], when the parameter value λ is too large, it will cause more variable coefficients to be depreciated to zero so that it will reduce dimensions. Conversely, when the parameter value λ is close to zero, it will be the same as the OLS (Ordinary Least Square) regression. Therefore, the LASSO selection results for domestic
departures are five variable Google trends index data, namely "ticket," "web check-in," "trip," "booking," and "online check-in."
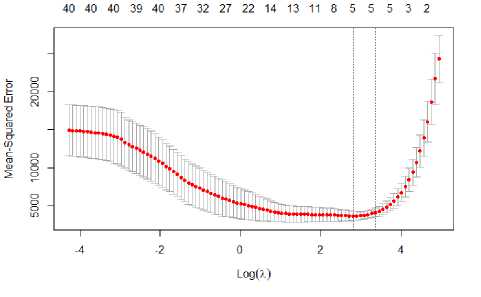
Figure 2. LASSO Domestic Departures with 5-fold Cross Validation
-
b. International Departures
The process is the same for international departures as the selection domestic departure variable. Google trends data for departures international amounted to two variables (correlated search keywords), and the LASSO variable selection process was carried out. The following are the results of the LASSO selection for departure international.
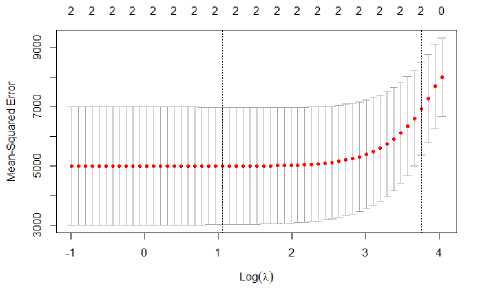
Figure 3. LASSO International Departures with 5-fold Cross Validation
Based on Figure 3, the values λmln and λ1se indicate the value of two, stating that both values of λ give the sum of variables two to the LASSO selection so that on international departure, all variables resulting from the previous process proceed to the nowcasting modeling process. The Google Trends index data variables are "batik air check-in" and "scoot."
The first process of SARIMAX modeling is to conduct a stationary test using the Augmented Dickey-Fuller (ADF) test and the Kwiatkowski-Phillips-Schmidt-Shin (KPSS) test by looking at the resulting p-value. If the p-value of the ADF test is smaller than the value of α = 5%, then it can be said that the data is already stationary, and if the p-value of the KPSS test is greater than the value of α = 5%, then the data can be declared stationary [18]. The test results at the level showed that the data was not stationary, so a differencing process was carried out.
After differencing, the data has shown stationary results. The next process is identifying the SARIMA model by looking at the patterns in the Autocorrelation Function (ACF) and Partial Autocorrelation Function (PACF). From this process, several SARIMA models are in Table 2.
Table 2. SARIMA model
|
Domestic Departures |
International Departures |
|
SARIMA (0,1,0)(0,0,1)12 |
SARIMA (4,1,0)(0,0,1)12 |
|
SARIMA (0,1,0)(1,0,0)12 |
SARIMA (0,1,4)(0,0,1)12 |
|
SARIMA (0,1,0)(1,0,1)12 |
SARIMA (4,1,4)(0,0,1)12 |
|
SARIMA (0,1,0)(0,0,1)12 | |
The next process is carried out by selecting the best SARIMA model. The selection of the best SARIMA model must meet the parameter significance test and white noise diagnostic test. If more than one model meets both tests, then the model is seen from the smallest MAPE and MAE values.
The parameter significance test is seen from the p-value generated by each order. The p-value that is below 0.05 can be said to be significant. The model is then performed residual tests to see the adequacy of the model to be used in forecasting. Residual examinations include white noise diagnostics with Ljung-Box (LBQ) testing. The determination of the LBQ test is seen from the p-value. If it is smaller than α = 5%, then it violates the assumption of white noise. Here are Tables 3 and 4 regarding the results of the best SARIMAX model.
Table 3. Best SARIMA Model Results in Domestic Departures
|
Model |
Significant parameters |
Assumption of white noise |
MAPE |
MAE |
|
SARIMA (0,1,0)(0,0,1)12 |
√ |
√ |
88.097 |
128.762 |
|
SARIMA (0,1,0)(1,0,0)12 |
√ |
√ |
82.215 |
126.733 |
|
SARIMA (0,1,0)(1,0,1)12 |
X |
√ |
102.153 |
145.458 |
|
Table 3 shows that the model that meets the parameter significance test and the assumption of white noise is the SARIMA model (0,1,0)(1,0,0)12. The model also has the smallest MAPE and MAE values compared to other models. | ||||
|
Table 4. Best SARIMA Model Results in International Departures | ||||
|
Model |
Significant parameters |
Assumption of white noise |
MAPE |
MAE |
|
SARIMA (4,1,0)(0,0,1)12 |
X |
√ |
8.734 |
48.987 |
|
SARIMA (0,1,4)(0,0,1)12 |
X |
√ |
9.998 |
57.93 |
|
SARIMA (4,1,4)(0,0,1)12 |
X |
√ |
9.334 |
53.437 |
|
SARIMA (0,1,0)(0,0,1)12 |
√ |
√ |
10.798 |
63.81 |
|
Based on Table 4, researchers chose the SARIMA (0,1,0)(0,0,1)12 |
model as the best model, | |||
considering that it had met the parameter significance test and white noise assumptions despite
the highest MAPE and MAE value results compared to other models.
The best SARIMA model obtained based on Tables 3 and 4 was then used to form the SARIMAX model by adding the Google Trends (GT) index variable as an independent variable. Before being added to the model, data that act as exogenous variables must be subjected to stationarity tests[19]. Using non-stationary data will cause the model's estimation to be inconsistent[19]. Therefore, the Google Trends index data used in creating the SARIMAX model is already stationary. In building the SARIMAX model, the white noise model's parameter significance tests and diagnostics were carried out again. In addition, a comparison of MAPE and MAE values was carried out.
In this study, the addition of the Google Trends (GT) variable to the SARIMAX model using all existing combinations of variables. For domestic departures, there are 31 combinations of 5 GT variables; for international departures, there are three combinations of two GT variables. For domestic departures, because it has quite a lot of combinations, the model results for domestic departures are displayed as the best models of each combination. SARIMAX modeling results can be seen in Tables 5 and 6.
Table 5. SARIMAX Modeling Results for Domestic Departures
|
GT Variables |
Significant parameters |
Assumption of White Noise |
MAPE |
MAE |
|
All GT variables |
X |
√ |
119.521 |
166.659 |
|
check in online |
√ |
√ |
93.894 |
136.296 |
|
trip + booking |
X |
√ |
80.187 |
124.159 |
|
tiket + trip + booking |
X |
√ |
86.33 |
133.334 |
|
tiket + trip + booking + check in online |
X |
√ |
100.347 |
147.286 |
Based on Table 5, the best SARIMAX model for domestic departures is the SARIMAX model (0,1,0)(1,0,0)12 using the GT variable "online check in". The model has fulfilled the parameter significance test and white noise even though the MAPE and MAE evaluation values are not the lowest compared to the other models.
Table 6. SARIMAX Modeling Results for International Departures
|
GT Variables |
Significant parameters |
Assumption of White Noise |
MAPE |
MAE |
|
All GT variables |
X |
X |
13.082 |
77.972 |
|
batik air check in |
X |
X |
12.311 |
73.159 |
|
scoot |
√ |
√ |
8.641 |
50.205 |
Based on Table 6, the best model for international departures was obtained, namely SARIMAX (0,1,0)(0,0,1)12 using the gt variable "scoot." Of all models, only selected models that have fulfilled the parameter significance test and white noise. In addition, the selected model has the lowest evaluation value among other models.
Modeling with multilayer perceptron using the help of R software using the neuralnet() function in the neuralnet package. In this modeling, determining the number of neurons on the hidden layer considers the rule suggested in the book by Heaton: the number of hidden neurons must be within the size range of the input layer and output layer [20]. For the number of hidden layers, use a maximum of two hidden layers because the book written by Laurene Fausett explains that one hidden layer is enough to solve the problem. Still, some problems are easier with two hidden layers [21]. Therefore, in this modeling, the number of neurons in the first hidden layer is 1 to n, with n being the size of the input layer. Based on research recommendations [9], the number of hidden second layers is a maximum of two neurons.
In modeling with a perceptron multilayer, researchers used two scenarios. For the first scenario, not applying the activation function on the neuron output or the neuralnet() function sets linear.output = TRUE, while the second scenario applies the activation function on the neuron output or linear.output = FALSE. The activation function used in this study is the logistic sigmoid activation function. The model naming for the first scenario is the MLP-sigmoid model, and the second is the MLP+sigmoid model.
Before modeling, data as input variables are standardized data. Data standardization aims to avoid data with different scales to cause all inputs to be in the same range, namely 0-1.
The Google Trends (GT) variable used in this modeling uses all existing combinations. For domestic departures, there are 31 combinations of 5 GT variables; for international departures, there are three combinations of two GT variables. Here are the results of each combination's best perceptron multilayer models for domestic and international departures.
Table 7. Domestic Departure Multilayer Perceptron Model Results
Model GT Variables Hidden layer MAPE MAE
|
All GT variables |
3 |
12.213 |
31.297 | ||
|
web check in |
1 |
1 |
24.283 |
52.043 | |
|
web check in + check in online |
2 |
1 |
15.43 |
38.507 | |
|
MLP-sigmoid |
booking + check in online + web check in |
3 |
11.194 |
28.048 | |
|
booking + trip + check in online + web check in |
4 |
2 |
14.106 |
32.199 | |
|
All GT variables |
3 |
1 |
14.26 |
33.783 | |
|
web check in |
1 |
21.155 |
47.5 | ||
|
web check in + check in online |
2 |
18.338 |
41.416 | ||
|
MLP+sigmoid |
booking + check in online + web check in |
3 |
1 |
17.21 |
35.116 |
|
tiket + web check in + booking + check in online |
4 |
1 |
14.919 |
33.42 | |
Based on Table 7, the selected perceptron multilayer model for domestic departures was obtained by MLP-sigmoid using three GT variables, namely "booking," "online check in," and "web check in" with one hidden layer having several neurons, namely three. The model has the lowest MAPE and MAE evaluation values among other models.
Table 8. International Departure Multilayer Perceptron Model Results
|
Model |
GT Variables |
Hidden layer |
MAPE |
MAE | |
|
I II | |||||
|
MLP-sigmoid |
All GT Variables |
2 |
11.772 |
78.914 | |
|
scoot |
1 |
1 |
12.266 |
86.497 | |
|
MLP+sigmoid |
All GT Variables |
2 |
1 |
11.945 |
79.525 |
|
web check in |
1 |
1 |
12.411 |
87.92 | |
Based on Table 8, the selected perceptron multilayer model for international departures was obtained with MLP-sigmoid using all GT variables, namely "batik air check in" and "scoot" with one hidden layer, which has some neurons, namely two. The model has the lowest MAPE and MAE evaluation values among other models.
After modeling using SARIMAX and multilayer perceptron, error nowcasting was compared between each method's best models. Each of the best models is then compared to MAPE and MAE values. Here is a list of the best model modeling results with SARIMAX and multilayer perceptron.
|
Table 9. List of Best Nowcasting Models | |||
|
Forecasting variables |
Model |
MAPE |
MAE |
|
SARIMAX (0,1,0)(1,0,0)12 + GT variable “check in online” |
93.894 |
136.296 | |
|
Domestic Departure |
MLP-sigmoid, 1 hidden layer with 3 neurons with 3 GT variables “booking, check in online, dan web check in” |
11.194 |
28.048 |
|
International Departure |
SARIMAX (0,1,0)(0,0,1)12 + GT variable “scoot” |
8.641 |
50.205 |
|
MLP-sigmoid, 1 hidden layer with 2 neurons with all GT variables |
11.772 |
78.914 | |
Table 9 shows that the best model for domestic departures is the model of a perceptron multilayer with MLP-sigmoid. That is, it does not apply the logistic sigmoid activation function to the neuron output, one hidden layer with three neurons, and using three GT variables, namely "booking," "online check in," and "web check in." The model has the smallest error value with MAPE and MAE values of 11.194% and 28,048, respectively. Based on MAPE values in the 10% - 20% range, the forecasting results can be said to be good. Meanwhile, the best model for international departures is the SARIMAX model using the variable GT "scoot." The model has the smallest error value with MAPE and MAE values, respectively, 8.641% and 50.205. The forecasting results are excellent based on the MAPE value below 10%.
Based on the results of the research that has been carried out, it can be concluded that several things: Search keywords are obtained that are relevant to the data on the number of airplane passengers for domestic departures, namely "ticket," "web check in," "trip," "booking," and "online check " for international departures, namely "batik air check in" and "scoot." The SARIMAX method and multilayer perceptron can be used to nowcast the number of passengers on domestic and international departure flights with good results. The best model for nowcasting the number of passengers on domestic departure flights is a multilayer perceptron neural network architecture with MLP-sigmoid, which does not apply the sigmoid logistic activation function to the output neurons, one hidden layer with three neurons. It uses three GT variables: "booking" and "check-in." “online,” and “web check-in”. This model has a MAPE and MAE evaluation value of 11,194% and 28,048, respectively. Based on the MAPE value, which is in the range of 10% - 20%, the forecasting results can be said to be good. For international departures, the best model is SARIMAX (0,1,0)(0,0,1)12 using the variable GT "scoot." Meanwhile, for international departures, the best model is the model from SARIMAX (0,1,0)(0,0,1)12 using the variable GT "scoot." This model has the lowest evaluation value compared to the multilayer perceptron model with MAPE and MAE values of 8.641% and 50.205, respectively. The forecasting results are excellent based on the MAPE value below 10%. Based on the results of this study, it is known that Google trends have the potential to be used in nowcasting the number of passengers departing domestically and internationally. The nowcasting results can be used to see the growth rate in the number of aircraft passengers as seen from the nowcasting results data compared to the last period of the actual data to be used as information and recommendations for airport management and government policies.
References
-
[1] CNBC Indonesia, “Pertama di RI Bandara Soekarno-Hatta Punya 3 Runway,” 2020. https://www.cnbcindonesia.com/news/20200126200422-4-132836/pertama-di-ri-bandara-soekarno-hatta-punya-3-runway (accessed Dec. 05, 2021).
-
[2] G. Xie, S. Wang, and K. K. Lai, “Short-term forecasting of air passenger by using hybrid seasonal decomposition and least squares support vector regression approaches,” Journal of Air Transport Management, vol. 37, pp. 20–26, 2014, doi:
10.1016/j.jairtraman.2014.01.009.
-
[3] StatCounter, “Search Engine Market Share Indonesia | Statcounter Global Stats,” 2021.
https://gs.statcounter.com/search-engine-market-share/all/indonesia/2020 (accessed Nov. 12, 2021).
-
[4] C. Anvik and K. Gjelstad, “‘Just Google it’. Forecasting Norwegian unemployment figures with web queries,” 82 Pages, no. 11, 2010, [Online]. Available:
https://brage.bibsys.no/xmlui/handle/11250/95460.
-
[5] Skytrax, “World’s Top 100 Airports 2021 | SKYTRAX,” 2021.
https://www.worldairportawards.com/worlds-top-100-airports-2021/ (accessed Nov. 12,
2021).
-
[6] BPS Provinsi Bali, “Produk Domestik Regional Bruto Provinsi Bali Menurut Lapangan Usaha Tahun 2016-2020,” 2021.
-
[7] BPS, “Statistik Telekomunikasi Indonesia Tahun 2020,” 2021.
-
[8] C. Li Long, Y. Guleria, and S. Alam, “Air passenger forecasting using Neural Granger causal Google trend queries,” Journal of Air Transport Management, vol. 95, no. May, p. 102083, 2021, doi: 10.1016/j.jairtraman.2021.102083.
-
[9] I. W. Adli and A. Aditsania, “Implementasi Model ARIMAX dan Jaringan Saraf Tiruan dalam Memprediksi Kedatangan Wisatawan ke Provinsi Bali,” e-Proceeding of Engineering, vol. 8, no. 2, pp. 3099–3110, 2021.
-
[10] Google Support, “FAQ tentang data Google Trends - Bantuan Trends,” 2021. https://support.google.com/trends/answer/4365533?hl=id&ref_topic=6248052 (accessed Dec. 28, 2021).
-
[11] I. A. Akbar and R. Kurniawan, “Pemodelan Nowcasting Tingkat Pengangguran Terbuka Menggunakan Data Google Trends Dengan Metode Antlion Optimization-Support Vector Regression,” Seminar Nasional Official Statistics 2020., vol. 2020, no. 1, pp. 760–770, 2021, doi: 10.34123/semnasoffstat.v2020i1.504.
-
[12] N. Nikentari, H. Kurniawan, N. Ritha, D. Kurniawan, U. Maritim, and R. Ali, “Particle Swarm Optimization Untuk Prediksi Pasang Surut Air Optimization of Backpropagation Artificial Neural Network With Particle Swarm Optimization To Predict Tide Level,” Jurnal Teknologi Informasi dan Ilmu Komputer, vol. 5, no. 5, pp. 605–612, 2018, doi:
10.25126/jtiik2018551055.
-
[13] R. Gustriansyah, D. I. Sensuse, and A. Ramadhan, “A sales prediction model adopted the recency-frequency-monetary concept,” Indonesian Journal of Electrical Engineering and Computer Science, vol. 6, no. 3, pp. 711–720, 2017, doi: 10.11591/ijeecs.v6.i3.pp711-720.
-
[14] M. B. Kağan Albayrak, İ. Ç. Özcan, R. Can, and F. Dobruszkes, “The determinants of air passenger traffic at Turkish airports,” Journal of Air Transport Management, vol. 86, 2020, doi: 10.1016/j.jairtraman.2020.101818.
-
[15] J. P. Guilford, Fundamental statistics in psychology and education, vol. 5, no. 2. Mcgraw hill book company, 1956.
-
[16] M. Kuhn and K. Johnson, Applied predictive modeling, vol. 26. Springer, 2013.
-
[17] V. Fonti, “Feature Selection using LASSO,” VU Amsterdam, pp. 1–26, 2017.
-
[18] O. Claveria and S. Torra, “Forecasting tourism demand to Catalonia: Neural networks vs. time series models,” Economic Modelling, vol. 36, pp. 220–228, 2014, doi:
10.1016/j.econmod.2013.09.024.
-
[19] W. Alam, R. A. Y. Mrinmoy, R. R. Kumar, K. Sinha, S. Rathod, and K. N. Singh, “Improved ARIMAX modal based on ANN and SVM approaches for forecasting rice yield using weather variables,” The Indian Journal of Agricultural Sciences, vol. 88, no. 12, pp. 1909– 1913, 2018.
-
[20] J. Heaton, Introduction to neural networks with Java. Heaton Research, Inc., 2008.
-
[21] L. Fausett, “Fundamentals of neural networks: architectures, algorithms, and applications.” Prentice-Hall, Inc., 1994.
23
Discussion and feedback