Efforts of Performance Optimization: The Experiment on Ten Accounting Datasets
on
LONTAR KOMPUTER VOL. 13, NO. 3 DECEMBER 2022
DOI : 10.24843/LKJITI.2022.v13.i03.p04
Accredited Sinta 2 by RISTEKDIKTI Decree No. 158/E/KPT/2021
p-ISSN 2088-1541
e-ISSN 2541-5832
Efforts of Performance Optimization: The Experiment on Ten Accounting Datasets
Zico Karya Saputra Domasa1, M. Rizkiawana2, Roby Rakhmadib3
aDirectorate General of Taxes of Indonesia
Jakarta, Indonesia 11401190046.zicoksd@gmail.com (corresponding author) 2rizkiawan.edu@gmail.com
bInternational Relations Department of Lampung University Lampung, Indonesia
3roby.rakhmadi007@fisip.unila.ac.id
Abstract
In the big data and digitalization era, fast-accurate decision-making has become a basic need, so data mining has a crucial role. The decision tree algorithm is quite commonly applied for classification functions, but performance level must always be evaluated for optimizing accuracy rate. Several optimization methods to accommodate these objectives include GA-bagging, PSO-bagging, forward selection, backward elimination, SMOTE, under-sampling, GA-Adaboost, and ABSMOTE-WIGFS. The results of the decision tree experiment on ten types of accountingfinance datasets used in this study obtained results with an average accuracy of 83.46%, an average precision of 65.64%, and an average AUC of 71.9%, while the majority of various optimizations are proven in improving the performance of decision tree algorithm where the application of ABSMOTE-WIGFS method is proven in providing the best rate with an average accuracy 87.71%, an average precision 87.09%, and an average AUC 84.87%, so it can be concluded that various optimization efforts are worth to be applied in case of accounting-finance themes for increasing the performance rate. Furthermore, the next research can prove these methods in other fields outside of accounting cases.
Keywords: Classification, Optimization, Accuracy, AUC, Precision
Today, the data mining approach has developed rapidly. It has already been applied in more expansive fields [1], some of which are [2] and [3] used a data mining approach to the agriculture sector [4] in the health sector, [5], [6], and [7] in the biology sector, and [8] who applied a data mining approach in the financial industry. One of the data mining algorithms, which is often used, is a decision tree. The decision tree classification algorithm has advantages in visualizing decision trees that easily interpret and handle discrete and numeric type attributes. However, the decision tree is also at risk of having weaknesses in entropy and Gini, so accuracy calculations are prone to be less than optimal when the dataset has an unequal class imbalance [9]. The class imbalance pattern is characterized by a case label being more unequal than others. For example, a label is represented by an extensive sample, while others are represented by a much smaller sample [10] [11].
The class imbalance obstacle can be overcome with various efforts, one of which is the sampling method [12], where [13] and [14] conducted optimization experiments by applying under-sampling and over-sampling methods. The sampling approach is basically training data manipulated to neutralize the distribution tendency of a label or class [14], [15].
Then, [16] conducted optimization experiments by applying genetic algorithm (GA)-bagging and particle swarm optimization (PSO)-bagging. Feature selection through GA and PSO methods is a pre-processing data activity to select feature subsets that minimize classifier prediction errors. Testing all possible combinations of features can be almost impossible, so the feature selection
techniques, both GA and PSO methods, try to find solutions in the range between sub-optimal and near-optimal areas by means of local search (not global search) throughout the process. Moreover, [17] observed that the Adaboost method could be applied to improve classifier performance. In addition, [18], [19], and [20] also conducted experiments by assessing comparisons among SMOTE, Adaboost, and bagging techniques to increase the accuracy level of a prediction.
Furthermore, [21] and [22] observe that the forward selection method is feasible to be applied as an optimization effort, whereas [23] also experimented with using the backward elimination method as an optimization effort. The feature selection method, both forward selection and backward elimination, is based on a large feature space reduction, for example, by eliminating irrelevant attributes [23] to increase accuracy [23]. In this study, researchers will apply various optimization efforts, namely the GA-bagging method, PSO-bagging, forward selection, GA-Adaboost, SMOTE, backward elimination, and under-sampling, to ABSMOTE-WIGFS on ten types of datasets in the financial-accounting sector.
Through this research, the researcher hopes to contribute adequate scientific references for opening the focus of further research on the financial-accounting theme with the data mining approaches.
In essence, data mining is analyzing hidden data in an extensive database by combining statistical science and artificial intelligence so that a pattern or information previously unknown is found to make it easier to understand and provide benefits in future decisions making [24].
-
[25] compared over-sampling, under-sampling, and synthetic minority over-sampling (SMOTE) techniques to improve prediction accuracy on minority labels. The results showed that the SMOTE optimization method achieved the best performance with an accuracy rate of 90.24%. Then, [17] observed that the ordinary version of the classification algorithm on 20 datasets obtained from the NASA Metrics Data Program and Predictor Models in Software Engineering Repository was proven that most of them experienced an increase in the AUC score after being optimized by applying the SMOTE method. Statistical tests prove that there is a significant difference between most of the ordinary version classifier models and the SMOTE model. Then, [14] observed that the ordinary version classifier on the telecommunications industry customer churn dataset obtained from https://bigml.com/dashboard/source/55c69eca200d5a25a0005180, it was proven that the AUC level had increased after being optimized by applying the over-sampling method that combined with Adaboost technique from 83.8% to 85.6%. Furthermore, [26] observed that the ordinary version classifier on the protein compound interaction prediction dataset [27] proved that the AUC level had increased after being optimized by the application of the Synthetic Minority Oversampling Technique (SMOTE) method from 50.3% to 64.9%. [28] also observed that the ordinary version classifier in the car evolution dataset taken from the UCI machine learning repository has proven that the average AUC level has increased by 9.97% after being optimized by the application of the SMOTE method.
Meanwhile, [29] observed that the ordinary version of the classification algorithm on nine datasets obtained from the NASA metric data repository proved that most of them experienced an increase after being optimized by applying the GA-bagging method so that the AUC level that did not increase was only one of the nine datasets. Statistical tests prove that there is a significant difference between the ordinary classifier model and the GA-bagging model. Then, [30] observed that ten ordinary version classification algorithms on nine datasets obtained from the NASA metric data repository proved that most of them experienced an increase in the AUC score after being optimized by applying the GA-bagging method. Statistical tests prove that there is a significant difference between most of the ordinary version classifier models and the GA-bagging model. Statistical tests prove a significant difference between most ordinary classifier models and the GA-bagging and PSO-bagging models. In contrast, statistical tests prove no significant difference between eight out of ten GA-bagging and PSO-bagging models. Then, [31] observed that the
ordinary version classifier in the banking marketing dataset obtained from the UCI Machine Learning Repository proved that the AUC level had increased after being optimized by applying the GA (genetic algorithm) method from 66.7% to 83.46%. Then, [32] observed that the ordinary version classifier in the diabetes mellitus prediction dataset proved that the AUC level had increased after being optimized by applying the Particle Swarm Optimization (PSO) method from 75.8% to 76.5%. [33] Also, the ordinary version of the classifier in the high school selection dataset for students of SMP Islam Al-Hikmah Pondok Cabe proved that the accuracy rate had increased by 7.36% after the application's optimization of the GA (genetic algorithm) method. Furthermore, [34] and [35] also observed that the Particle Swarm Optimization (PSO) technique was proven to produce a better level of accuracy.
In addition, [22] observed that the ordinary version classifier in the heart disease diagnosis dataset proved that the level of accuracy had increased after being optimized with the application of the forward selection method from 73.44% to 78.66%. Then, [23] observed that the ordinary version classifier in the Movie Review Polarity V2.0 dataset [36], it was proven that the AUC level had increased after being optimized with the application of the forward selection method from 71.26% to 76.2 %. Likewise, with the implementation of backward elimination, it is proven that the accuracy rate has increased from 75.2% to 78.66%. Then, [37] observed that the ordinary version classifier in two datasets, churn [38] and telecom [39], it was proven that the AUC level had increased after being optimized by applying the forward selection-weighted information gain method, which is combined with bootstrapping technique. [21] also observed that the ordinary version of the classifier in the graduation dataset of the Faculty of Computer Science UNAKI Semarang students proved that the level of accuracy had increased after being optimized with the application of the forward selection method from 90.95% to 97.14%.
Regarding the Adaboost method, [40] observed that the classification algorithm produced an AUC level (area under curves) for predicting student graduation of 0.864, which was then optimized using Adaboost so that the AUC level increased to 0.951. Then, [41] observed that the ordinary version classifier in the restaurant review dataset located in New York, it was proven that the AUC level had increased after being optimized by applying the Adaboost method combined with the information gain feature selection technique from 50% to 88.7%. [42] Also, the classification algorithm resulted in an AUC level of for predicting heart disease is 0.957, which was then optimized using Adaboost to increase the AUC level to 0.982.
In this study, the researchers applied a decision tree classification algorithm combined with various optimization methods to compare with the decision tree algorithm without the optimization method. The ten of accounting-finance datasets, which are the basis of the research, can be broken down into datasets that are publicly accessible and that cannot be publicly accessible, namely the credit card default dataset for banking customers [43], subscribing term deposits to prospective banking customers [44], lack of transparency in disclosing anti-corruption information on private sector corporations in Indonesia [45], indications of manipulation of financial statements using the Beneish Score on state-owned companies in Indonesia [46], credit approvals for banks [47], South German credit [48], banknote authentication [49], audit risk [50] for Indian companies, census of income [51], and bankruptcy dataset on Polish companies [52]. Thus, as presented in table I, the researcher utilized eight public access datasets and two non-public access datasets. After optimization, all datasets will undergo a data training model and then data testing to ensure whether.
Table 1. Dataset Type
Dataset Name Access Data Volume Label Label
Composition 0 Composition 1
Default of credit card Public (UCI machine 5.000 rows 77,88% 22,12%
learning repository)
Subscribing term Public (UCI machine 5.000 rows 88% 12%
deposit learning repository)
|
Dataset Name |
Access |
Data Volume |
Label Composition 0 |
Label Composition 1 |
|
Lack of anticorruption transparency |
Non-Public |
141 rows |
52,48% |
47,52% |
|
Beneish M-score fraud |
Non-Public |
105 rows |
44,76% |
55,24% |
|
Credit card approval |
Public (UCI machine learning repository) |
690 rows |
55,5% |
44,5% |
|
South German credit |
Public (UCI machine learning repository) |
1.000 rows |
70% |
30% |
|
Banknotes authentication |
Public (UCI machine learning repository) |
1.372 rows |
55,54% |
44,46% |
|
Audit Risk |
Public (UCI machine learning repository) |
776 rows |
60,7% |
39,3% |
|
Census of income |
Public (UCI machine learning repository) |
5.000 rows |
75,92% |
24,08% |
|
Bankruptcy |
Public (UCI machine learning repository) |
5.000 rows |
94,74% |
5,26% |
Based on table 1, datasets that have a data volume of more than 5,000 rows will be trimmed randomly to 5,000 rows while maintaining a proportional data structure, namely the percentage of majority labels and the percentage of minority labels so that the dataset used by the researcher remains as representative as the original version. This pruning was done because the rapidminer 9.9 application used by the researchers was an unpaid version, so it was constrained by the maximum number of limitations related to the volume of data that could be processed. The preprocessing stage, if the original dataset has a missing value, the researcher will apply the replacement with the average value. The replacement technique with the average value is carried out because the researcher believes that the replacement with the average value is still representative of the original version with the condition that the number of missing value attributes is not proportional to the total number of data attributes in a dataset. In practice, there are only three datasets out of 10 datasets that have missing values where the number of missing value attributes in a dataset is not proportional to the total number of data attributes, so the average value technique is feasible to apply. Then the data that has gone through the cleaning process is ready to be sorted into a dataset for training and testing purposes. After that, it is processed using nine types of classifiers, namely the usual version of the decision tree algorithm and eight optimization methods, namely GA-bagging, PSO-bagging, forward selection, GA-Adaboost, SMOTE, backward elimination, under-sampling, ABSMOTE-WIGFS. Then in the next step, a validation process is carried out using 10-fold cross-validation so that the performance aspects to be observed can be measured, namely the accuracy, precision, and AUC level.
Genetic algorithm (GA) is an optimization technique analogous to the principles of genetics and natural selection based on Charles Darwin's theory of evolution [53]. The rule that the stronger individual is likely to be the winner in a competitive environment can be analogized as the optimal solution can be obtained or represented in the final winner of the genetic game [31]. GA works with a population of individuals, denoted by a fitness value, which will be used to find the best solution to the problem. In the end, the most appropriate solution will be obtained from the existing problems. Then, the bagging technique has the potential to be superior to the boosting technique when it comes to environments containing noise data because boosting is more about trying to build a model to classify noise data correctly [16].
Meanwhile, the Adaboost method gives different weights to the training data distribution in each iteration. Each boosting iteration adds weight to the wrong classification variety and decreases
the weight to the correct classification variety to effectively change training data distribution [54]. In other words, Adaboost builds a robust classifier by combining several weak classifiers [14].
Particle swarm optimization (PSO) is a population search method that is analogous to the social behavior of animal colony organisms such as termites, bees, birds, or fish, using a population (swarm) of individuals (particles) that is updated from iterations [32], [55]. That is, the rule that if a termite finds a food source through the right (optimal) path, then the rest of the members of the other termite group will also take the same way even though the location of the termites in the group is not close to each other, can be analogized as an attempt to find the optimal solution then each -each particle moves towards the best individual experience position (p-best) and towards the best global position (g-best) [55], [56]. Then, the bagging technique has the potential to be superior to the boosting approach when it comes to environments containing noise data because boosting is more about trying to build a model to classify noise data correctly [29].
Feature selection is a technique to determine the most relevant attribute in the dataset by selecting the correct subset of the original attributes because not all attributes may be relevant to the problem; even some of these attributes can interfere with the impact at reduced accuracy. In the forward selection method (FS), modeling starts with zero variables (empty model) then the variables are entered one by one until specific criteria are met [21], [22].
Feature selection is a technique to determine the most relevant attribute in the dataset by selecting the correct subset of the original attributes. Not all attributes may be relevant to the problem. Even some of these attributes can interfere with the impact at reduced accuracy. In the backward elimination method (BE), the modeling starts with the complete model (full model), and then the variables are reduced one by one until specific criteria are met.
The synthetic minority oversampling technique (SMOTE) selects data from minority labels synthetically. It then adds it to the training data so that the minority label data is equal to the majority label data [15].
Under-sampling (US) selects the majority label data at random and removes it from training data so that the number of majority label data is the same as that of minority label data [57].
The ABSMOTE-WIGFS method is a combination method that refers to the substance of the experimental ideas of [37], [41] so that researchers experiment by combining data level
approaches (Adaboost, Bootstrap, SMOTE), filtering approaches (Weight Information Gain), to the wrapping approach (forward selection) in an integrated technique as shown in figure 1, 2, and Figure 3 meanwhile bootstrapping is a resampling method that has been widely applied and allows the creation of more realistic models [37]. That is, bootstrap resamples with a replacement where the data, which has been selected in an experiment, can still be chosen again in the next experiment [37].
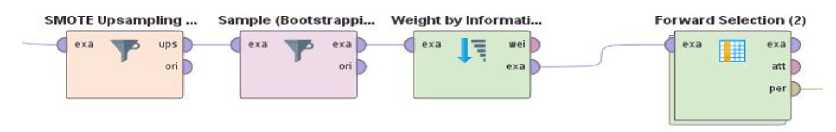
Figure 1. The process of the ABSMOTE-WIGFS method by version 9.9 of the Rapidminer application
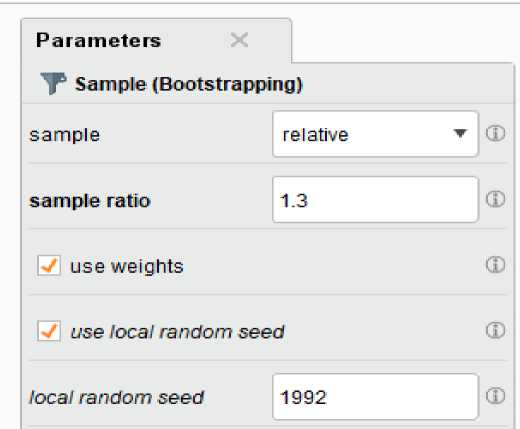
Figure 2. Bootstrap resampling parameters for small data volume dataset by the Rapidminer 9.9
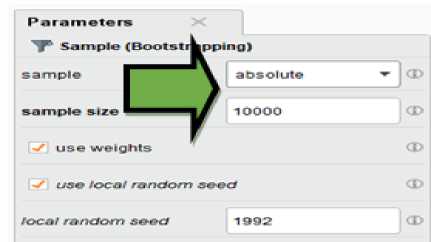
Figure 3. ABSMOTE-WIGFS method process for small data volume datasets by the Rapidminer 9.9
Based on Figure 4, a resampling of 10,000 records was implemented because resampling with a ratio of 1.3 times the input records has the potential to exceed the data processing capacity of the Rapidminer application, which has constraints on the maximum data volume limit. If the resampling selection on the bootstrap parameter exceeds the capacity, it will impact the potential for decreasing accuracy by up to 30%.
Cross-validation is a method that divides the dataset into two parts, where one part acts as training data while the other part acts as testing data. Some studies divide the data into ten parts, 90% is applied as training data, and the additional 10% is applied as testing data. This process is repeated up to 10 times, also known as ten-fold cross-validation. Researchers widely use this technique because it produces a more stable algorithm performance [24].
According to [58], the four fundamental matrices in evaluating the performance of the classification algorithm consist of True Positive (TP), False Positive (FP), True Negative (TN), and False Negative (FN). Then, the level of accuracy is defined as the ratio of the total number of correctly predicted observations, sensitivity is defined as the proportion of the positive observations correctly predicted as positive, and specificity is defined as how accurately the negative observations are correctly predicted as negative, so the Area Under Curve (AUC) representants the level of separability measurement that a model can distinguish among labels or classes.
Accuracy = (TP+TN)/ (TP+FP+TN+FN)
AUC = 1/2 * (Sensitivity + Specificity)
Furthermore, research [59] explains that the Area Under Curve (AUC) performance can be classified into five categories, namely:
-
1. 0.90 – 1.00 = Excellent Classification
-
2. 0.80 – 0.90 = Good Classification
-
3. 0.70 – 0.80 = Fair Classification
-
4. 0.60 – 0.70 = Poor Classification
-
5. 0.50 – 0.60 = Failure
The optimization variance experiment was applied to ten datasets using the rapidminer application version 9.9. Ten-fold stratified cross-validation is applied to validate the algorithm model, repeated ten times on the entire dataset, where each repetition uses different random data [60]. After the ten-fold stratified cross-validation is completed, the results of the ten-fold test for 90% of the training data are combined. The pattern of the training data results is automatically applied to 10% of the testing data so that the performance evaluation results of the eight optimization experiments can be measured objectively, as presented in table 2, table 3, and table 4.
Table 2. Recapitulation of the evaluation of the comparison of the level of accuracy
|
Dataset |
D-tree |
Optimization results of accuracy | |||||||
|
GA-B |
PSO-B |
FS |
GA-A |
SMOTE |
BE |
US |
ABSMOTE-WIGFS | ||
|
Default of credit card |
77,98% |
80,60% |
78,46% |
80,66% |
78,50% |
50,69% |
78,44% |
49,82% |
71,52% |
|
Subscribing term deposit Lack of anti- |
92,36% |
97,16% |
97,16% |
97,10% |
97,18% |
93,93% |
94,84% |
89,92% |
96,23% |
|
corruption transparency |
73,76% |
77,30% |
77,30% |
73,05% |
77,30% |
73,65% |
75,89% |
76,12% |
77,60% |
|
Beneish M-score fraud |
62,86% |
73,33% |
74,29% |
70,48% |
77,14% |
69,83% |
69,52% |
56,38% |
89,40% |
|
Credit card approval |
80,43% |
88,12% |
86,67% |
86,96% |
87,39% |
84,46% |
84,49% |
83,71% |
90,56% |
|
German credit |
70,70% |
74,20% |
75,50% |
72,30% |
74,7% |
70,50% |
72,2% |
69,33% |
87,97% |
|
Banknotes authentication |
97,81% |
98,98% |
99,05% |
97,96% |
99,78% |
97,31% |
97,96% |
96,80% |
99,75% |
|
Audit risk |
100% |
100% |
100% |
100% |
100% |
100% |
100% |
100% |
100% |
|
Census of income |
83,96% |
85,46% |
85,26% |
85,38% |
85,36% |
81,64% |
85,26% |
79,98% |
86,53% |
|
Bankruptcy |
94,72% |
94,76% |
94,76% |
94,80% |
94,76% |
62,11% |
94,74% |
59,89% |
77,56% |
|
Average |
83,46% |
86,99% |
86,85% |
85,87% |
87,21% |
78,41% |
85,33% |
76,20% |
87,71% |
accuracy
Bold: improved over the regular version of the decision tree; *: best performance
Based on table 2, when viewed from the ten types of datasets, most optimization methods are proven to increase the average level of accuracy, which is better than the standard version of the decision tree algorithm. Only the SMOTE and under-sampling methods reduce the average accuracy level. Then, it can be concluded that the ABSMOTE-WIGFS method is proven to increase the average level of accuracy with the best performance among the seven other optimization methods, which is a score of 87.71%.
|
Table 3. Recapitulation of the evaluation of the comparison of the level of precision | |||||||||
|
Dataset |
D-tree |
Optimization results of precision | |||||||
|
GA-B |
PSO-B |
FS |
GA-A |
SMOTE |
BE |
US |
ABSMOTE-WIGFS | ||
|
Default of credit card |
55,32% |
64,47% |
63,81% |
63,55% |
77,19% |
50,35% |
73,33% |
49,91% |
79,11% |
|
Subscribing term deposit |
63,1% |
99,14% |
99,35% |
98,92% |
99,14% |
91,3% |
77,06% |
88,82% |
95,2% |
|
Lack of anti- |
70,27% |
72,15% |
71,6% |
75,44% |
74,29% |
70,13% |
71,79% |
71,62% |
78,5% |
|
corruption transparency Beneish M-score fraud |
64,62% |
78,95% |
74,55% |
76,36% |
81,82% |
64,06% |
75% |
60% |
92,11% |
|
Credit card approval |
86,42% |
93,2% |
90,28% |
91,27% |
90,81% |
90,71% |
85,98% |
87,95% |
95,53% |
|
German credit |
50,96% |
60,61% |
60,4% |
59,74% |
60,5% |
63,47% |
64,63% |
60,25% |
83,13% |
|
Banknotes authentication |
98,49% |
98,53% |
98,69% |
97,7% |
99,51% |
98,03% |
98,19% |
97,87% |
99,69% |
|
Audit risk |
100% |
100% |
100% |
100% |
100% |
100% |
100% |
100% |
100% |
|
Census of income |
79,39% |
78,56% |
77,9% |
81,83% |
78,37% |
76,22% |
80,21% |
74,79% |
83,63% |
|
Bankruptcy |
0% |
100% |
66,67% |
80% |
66,67% |
56,98% |
0% |
66,05% |
78,19% |
|
Average |
65,64% |
83,41% |
80,12% |
81,90% |
81,89% |
75,94% |
71,85% |
75,20% |
87,09% |
|
accuracy |
* | ||||||||
|
Bold: improved over the regular version of the decision tree; |
*: best performance | ||||||||
Based on table 3, when viewed from the ten types of datasets, all optimization methods are proven to increase the average level of precision, which is better than the standard version of the decision tree algorithm. Then, it can be concluded that the ABSMOTE-WIGFS method is proven to increase the average level of precision with the best performance among the seven other optimization methods, which is a score of 87.09%.
Table 4. Recapitulation of the comparative evaluation of AUC level
|
Dataset |
D-tree |
Optimization results of AUC | |||||||
|
GA-B |
PSO-B |
FS |
GA-A |
SMOTE |
BE |
US |
ABSMOTE-WIGFS | ||
|
Default of credit card |
51,70% |
71,80% |
66,30% |
69,70% |
51,80% |
50,70% |
52,50% |
49,70% |
73,70% |
|
Subscribing term deposit |
92% |
89,90% |
89,70% |
90,30% |
88,50% |
97,40% |
93,30% |
90,90% |
98,10% |
|
Lack of anticorruption transparency Beneish M-score fraud |
77,20% 62,00% |
81,50% 76,50% |
80,50% 75,50% |
72,90% 70,4% |
80,00% 76% |
76,40% 72,70% |
78,00% 66,60% |
79,20% 49,80% |
78,70% 92,40% |
|
Credit card approval |
85,60% |
92,60% |
91,40% |
91,30% |
90,40% |
88,20% |
87,20% |
86,10% |
93,50% |
|
German credit |
70,50% |
75% |
75,20% |
62,6% |
67,7% |
73,50% |
60,20% |
72,10% |
93,80% |
|
Banknotes authentication |
97,60% |
99,40% |
99,60% |
98,4% |
99,90% |
97,80% |
98,50% |
96,80% |
99,90% |
|
Audit risk |
50% |
100% |
100% |
50% |
50% |
50% |
50% |
50% |
50% |
|
Census of income |
82,40% |
88,50% |
87,80% |
80,50% |
75,20% |
86% |
83,50% |
85,80% |
90,80% |
|
Bankruptcy |
50% |
51,50% |
51,50% |
53,60% |
50,50% |
62,20% |
50% |
59,60% |
77,80% |
|
Average accuracy |
71,90% |
82,67% |
81,75% |
73,97% |
73,00% |
75,49% |
71,98% |
72,00% |
84,87% * |
Bold: improved over the regular version of the decision tree; *: best performance
Based on table 4, when viewed from the ten types of datasets, all optimization methods are proven to increase the average level of AUC (area under the curve), which is better than the standard version of the decision tree algorithm. Then, it can be concluded that the ABSMOTE-WIGFS method can increase the average AUC level with the best performance among the seven other optimization methods, which is a score of 84.87%.
Statistically, the standard version of the decision tree cannot be concluded as a different cluster from the decision tree algorithm based on the optimization method. However, the various optimization efforts briefly appear to have a better level of performance based on experiments on these ten datasets. Thus, it is necessary to carry out a different T-test to know the statistical differences level as presented in table 5.
Table 5. Test results of the T-test
|
Dataset |
GA-B |
PSO-B |
FS |
GA-A |
SMOTE |
BE |
US |
ABSMOTE -WIGFS |
|
Default of credit card |
0,000 |
0,257 |
0,000 |
0,423 |
0,000 |
0,497 |
0,000 |
0,000 |
|
Subscribing deposit |
0,000 |
0,000 |
0,000 |
0,000 |
0,044 |
0,034 |
0,035 |
0,000 |
|
Lack of anticorruption transparency |
0,608 |
0,552 |
0,927 |
0,546 |
0,994 |
0,716 |
0,68 |
0,52 |
|
Beneish M-score fraud |
0,071 |
0,081 |
0,262 |
0,022 |
0,235 |
0,298 |
0,309 |
0,000 |
|
Credit card approval |
0,000 |
0,004 |
0,004 |
0,000 |
0,028 |
0,04 |
0,108 |
0,000 |
|
South German credit |
0,106 |
0,012 |
0,265 |
0,012 |
0,897 |
0,356 |
0,507 |
0,000 |
|
Banknotes authentication |
0,031 |
0,02 |
0,782 |
0,000 |
0,481 |
0,808 |
0,132 |
0,000 |
|
Audit risk |
-- |
-- |
-- |
-- |
-- |
-- |
-- |
-- |
|
Census of income |
0,045 |
0,022 |
0,034 |
0,036 |
0,002 |
0,072 |
0,000 |
0,000 |
|
Bankruptcy |
0,449 |
0,591 |
0,255 |
0,449 |
0,000 |
0,714 |
0,000 |
0,000 |
Bold: statistically significant; --: can be interpreted as insignificant
Based on table 5 for four datasets with a large data volume pattern, namely 5,000 records, the majority of the alpha values are less than 0.05, so it can be concluded that statistically, there is a significant difference between the default of the decision tree algorithm and the majority of various optimization efforts. However, for the six datasets with a small data volume pattern which is below 1,372 records, the majority of the alpha values are above 0.05, so it can be concluded that statistically, there is no significant difference between the default of the decision tree and the majority of the various optimization efforts. This means that the majority of optimization methods can increase the performance level of the decision tree from the perspective of predictive accuracy of the classification function in finance research. Still, statistically, the various optimization methods sometimes provide significant differences with the decision tree for datasets with extensive data volume input (in this study, it means 5,000 rows and above) and sometimes do not provide significant differences with the decision tree for datasets with small data volume input (in this study it means 1,372 rows and below). This is understandable because a dataset with a small input data volume will affect the quality of the training data representation and data testing. Then, the results of the performance evaluation on the average AUC level for the ABSMOTE-WIGFS method of 84.87% so that it can be concluded that it is in the good classifier category [59]. However, in one out of ten datasets, namely the audit risk dataset with the data volume of 776 records, an anomaly occurs casuistically that the ABSMOTE-WIGFS method fails to improve the AUC performance on the decision tree classification while ABSMOTE-WIGFS on the other nine datasets always proves successful in improving the AUC performance.
Based on the experiment results, this study concludes that most optimization efforts for the classification function algorithm can improve the performance level of experiments on ten types of datasets as a whole. However, based on a statistical perspective, the majority of optimization efforts have no significant difference for the classification function algorithm on datasets with low data volume (1,372 records and below), while the majority of optimization efforts have a considerable difference for classification function algorithms on datasets with large data volumes (5,000 records and above). Thus, if the decision tree performance is still unsatisfactory, then the various optimization methods, especially the ABSMOTE-WIGFS method, are worth applying to the financial-accounting problem because the ABSMOTE-WIGFS is proven to improve the best performance compared to the other seven optimization methods.
Then, the researcher also stated two main limitations of this study. First, the research dataset does not use all of the original versions of public data records because the unpaid version of the Rapidminer 9.9 application has a maximum limit on data processing. Consequently, it is necessary to trim the number of data records so that this limitation of trimming can add hidden and random loads to each test item. Second, this study also uses two datasets that are not accessible publicly, so the quality of these characteristics datasets has the limitation that they still have not been validated publicly.
The author also recommends suggestions for further research related to data mining. Further research can apply various optimization efforts to the classification function algorithm, limited to decision tree algorithms and logistic regression algorithms, k-nn, naive Bayes, and other classification algorithms. Finally, the author tries to provide input to stakeholders in the fields of management, economics, finance, accounting, and business, to apply various optimization efforts as one of the considerations in the decision-making process to be more accurate based on scientifically proven data. Besides, further research can also prove these methods in many other fields outside accounting cases.
References
-
[1] J. Liu et al., "Artificial intelligence in the 21st century," IEEE Access, vol. 6, pp. 34403–34421, 2018, doi: 10.1109/ACCESS.2018.2819688.
-
[2] S. Tangwannawit and P. Tangwannawit, "An optimization clustering and classification based on artificial intelligence approach for internet of things in agriculture," IAES International Journal of Artificial Intelligence (IJ-AI), vol. 11, no. 1, p. 201, March 2022, doi:
10.11591/ijai.v11.i1.pp201-209.
-
[3] A. A. J. V. Priyangka and I. M. S. Kumara, "Classification Of Rice Plant Diseases Using the Convolutional Neural Network Method," Lontar Komputer: Jurnal Ilmiah Teknologi Informasi, vol. 12, no. 2, p. 123, August 2021, doi: 10.24843/LKJITI.2021.v12.i02.p06.
-
[4] M. Panda, D. P. Mishra, S. M. Patro, and S. R. Salkuti, "Prediction of diabetes disease using machine learning algorithms," IAES International Journal of Artificial Intelligence (IJ-AI), vol. 11, no. 1, p. 284, March 2022, doi: 10.11591/ijai.v11.i1.pp284-290.
-
[5] Z. E. Fitri, L. N. Sahenda, P. S. D. Puspitasari, P. Destarianto, D. L. Rukmi, and A. M. N. Imron, “The The Classification of Acute Respiratory Infection (ARI) Bacteria Based on K-Nearest Neighbor,” Lontar Komputer: Jurnal Ilmiah Teknologi Informasi, vol. 12, no. 2, p. 91, 2021, doi: 10.24843/lkjiti.2021.v12.i02.p03.
-
[6] I. M. A. S. Widiatmika, I. N. Piarsa, and A. F. Syafiandini, “Recognition of The Baby Footprint Characteristics Using Wavelet Method and K-Nearest Neighbor (K-NN),” Lontar Komputer: Jurnal Ilmiah Teknologi Informasi, vol. 12, no. 1, p. 41, 2021, doi:
10.24843/lkjiti.2021.v12.i01.p05.
-
[7] P. A. W. Santiary, I. K. Swardika, I. B. I. Purnama, I. W. R. Ardana, I. N. K. Wardana, and D. A. I. C. Dewi, "Labeling of an intra-class variation object in deep learning classification," IAES International Journal of Artificial Intelligence (IJ-AI), vol. 11, no. 1, p. 179, March 2022, doi: 10.11591/ijai.v11.i1.pp179-188.
-
[8] M. Sánchez, V. Olmedo, C. Narvaez, M. Hernández, and L. Urquiza-Aguiar, "Generation of a Synthetic Dataset for the Study of Fraud through Deep Learning Techniques," International Journal on Advanced Science, Engineering and Information Technology, vol. 11, no. 6, p.
2534, December 2021, doi: 10.18517/ijaseit.11.6.14345.
-
[9] D. A. Cieslak, T. R. Hoens, N. V. Chawla, and W. P. Kegelmeyer, "Hellinger distance decision trees are robust and skew-insensitive," Data Mining and Knowledge Discovery, vol. 24, no. 1, pp. 136–158, January 2012, doi: 10.1007/s10618-011-0222-1.
-
[10] Y. Sun, M. S. Kamel, A. K. C. Wong, and Y. Wang, "Cost-sensitive boosting for classification of imbalanced data," Pattern Recognition, vol. 40, no. 12, pp. 3358–3378, December 2007, doi: 10.1016/j.patcog.2007.04.009.
-
[11] A. Fernández, S. García, M. Galar, R. C. Prati, B. Krawczyk, and F. Herrera, Learning from Imbalanced Data Sets, 10th ed. Berlin: Springer, 2018.
-
[12] J. Van Hulse and T. Khoshgoftaar, "Knowledge discovery from imbalanced and noisy data," Data & Knowledge Engineering., vol. 68, no. 12, pp. 1513–1542, December 2009, doi: 10.1016/j.datak.2009.08.005.
-
[13] A. Ilham, “Komparasi Algoritma Kasifikasi dengan Pendekatan Level Data Untuk Menangani Data Kelas Tidak Seimbang,” Jurnal Ilmiah Ilmu Komputer, vol. 3, no. 1, 1 April 2017, pp. 16, doi: 10.35329/jiik.v3i1.60.
-
[14] S. Mulyati, Y. Yulianti, and A. Saifudin, “Penerapan Resampling dan Adaboost untuk Penanganan Masalah Ketidakseimbangan Kelas Berbasis Naϊve Bayes pada Prediksi Churn Pelanggan,” Jurnal Informatika Universitas Pamulang, vol. 2, no. 4, p. 190, Desember 2017, doi: 10.32493/informatika.v2i4.1440.
-
[15] N. V. Chawla, K. W. Bowyer, L. O. Hall, and W. P. Kegelmeyer, "SMOTE: Synthetic Minority Over-sampling Technique," Journal Of Artificial Intelligence Research, vol. 16, no. 2, pp. 321–357, June 2002, doi: 10.1613/jair.953.
-
[16] R. S. Wahono, N. S. Herman, and S. Ahmad, "Neural network parameter optimization based on genetic algorithm for software defect prediction," Advanced Science Letters, vol. 20, no. 10–12, pp. 1951–1955, 2014, doi: 10.1166/asl.2014.5641.
-
[17] A. Saifudin and R. S. Wahono, “Pendekatan Level Data untuk Menangani Ketidakseimbangan Kelas pada Prediksi Cacat Software,” IlmuKomputer.com Journal of Software Engineering, vol. 1, no. 2, pp. 76–85, 2015.
-
[18] J. Sun, J. Lang, H. Fujita, and H. Li, "Imbalanced enterprise credit evaluation with DTE-SBD: Decision tree ensemble based on SMOTE and bagging with differentiated sampling rates, " Information Sciences, vol. 425, pp. 76–91, Jan. 2018, doi: 10.1016/j.ins.2017.10.017.
-
[19] J. Shin, S. Yoon, Y. W. Kim, T. Kim, B. G. Go, and Y. K. Cha, "Effects of class imbalance on resampling and ensemble learning for improved prediction of cyanobacteria blooms," Ecological Informatics, vol. 61, p. 101202, 2021, doi: 10.1016/j.ecoinf.2020.101202.
-
[20] Y. E. Kurniawati and Y. D. Prabowo, "Model optimization of class imbalanced learning using ensemble classifier on over-sampling data," IAES International Journal of Artificial Intelligence (IJ-AI), vol. 11, no. 1, p. 276, March 2022, doi: 10.11591/ijai.v11.i1.pp276-283.
-
[21] M. F. Nugroho and S. Wibowo, “Fitur Seleksi Forward Selection Untuk Menetukan Atribut Yang Berpengaruh Pada Klasifikasi Kelulusan Mahasiswa Fakultas Ilmu Komputer UNAKI Semarang Menggunakan Algoritma Naive Bayes,” Jurnal Informatika Upgris, vol. 3, no. 1, pp. 63–70, September 2017, doi: 10.26877/jiu.v3i1.1669.
-
[22] J. Zeniarja, A. Ukhifahdhina, and A. Salam, "Diagnosis Of Heart Disease Using K-Nearest Neighbor Method Based On Forward Selection," Journal of Applied Intelligent System (JAIS), vol. 4, no. 2, pp. 39–47, March 2020, doi: 10.33633/jais.v4i2.2749.
-
[23] V. Chandani and R. S. Wahono, “Komparasi Algoritma Klasifikasi Machine Learning Dan Feature Selection pada Analisis Sentimen Review Film,” Journal of Intelligent Systems, vol. 1, no. 1, pp. 55–59, 2015.
-
[24] E. Pradana, “Analisis Penerapan Adaptive Boosting ( Adaboost ) Dalam Meningkatkan Performasi Algoritma C4.5,” Skripsi, Program Studi Teknik Informatika Universitas Pelita Bangsa, 2018.
-
[25] D. Thammasiri, D. Delen, P. Meesad, and N. Kasap, "A critical assessment of imbalanced class distribution problem: The case of predicting freshmen student attrition," Expert Systems with Applications, vol. 41, no. 2, pp. 321–330, February 2014, doi: 10.1016/j.eswa.2013.07.046.
-
[26] N. S. Ramadhanti, W. A. Kusuma, and A. Annisa, “Optimasi Data Tidak Seimbang pada Interaksi Drug Target dengan Sampling dan Ensemble Support Vector Machine,” Jurnal Teknologi Informasi dan Ilmu Komputer (JTIIK), vol. 7, no. 6, p. 1221, Desember 2020, doi: 10.25126/jtiik.2020762857.
-
[27] Y. Yamanishi, M. Araki, A. Gutteridge, W. Honda, and M. Kanehisa, "Prediction of drugtarget interaction networks from the integration of chemical and genomic spaces," Bioinformatics, vol. 24, no. 13, pp. i232–i240, July 2008, doi: 10.1093/bioinformatics/btn162.
-
[28] F. D. Astuti and F. N. Lenti, “Implementasi SMOTE untuk mengatasi Imbalance Class pada Klasifikasi Car Evolution menggunakan K-NN,” JUPITER (Jurnal Penelitian Ilmu dan Teknologi Komputer), vol. 13, no. 1, pp. 89–98, 2021.
-
[29] R. S. Wahono, N. Suryana, and S. Ahmad, "Metaheuristic Optimization based Feature Selection for Software Defect Prediction," Journal of Software, vol. 9, no. 5, pp. 1324–1333, May 2014, doi: 10.4304/jsw.9.5.1324-1333.
-
[30] R. S. Wahono and N. S. Herman, "Genetic Feature Selection for Software Defect Prediction," Advanced Science Letters, vol. 20, no. 1, pp. 239–244, Jan. 2014, doi: 10.1166/asl.2014.5283.
-
[31] I. Ispandi and R. S. Wahono, “Penerapan Algoritma Genetika untuk Optimasi Parameter pada Support Vector Machine untuk Meningkatkan Prediksi Pemasaran Langsung,” Journal of Intelligent Systems, vol. 1, no. 2, pp. 115–119, 2015, [Online]. Available:
http://journal.ilmukomputer.org/index.php/jis/article/view/53
-
[32] F. Handayanna, “Prediksi Penyakit Diabetes Mellitus Dengan Metode Support Vector Machine Berbasis Particle Swarm Optimization,” Jurnal Teknik Informatika (JTI), vol. 2, no. 1, pp. 30–37, 2016, [Online]. Available: https://ejournal.antarbangsa.ac.id/jti/article/view/5
-
[33] A. A. Saraswati, “Optimasi Algoritma C4.5 dalam Prediksi Sekolah Lanjutan Tingkat Atas Menggunakan Seleksi Fitur Algoritma Genetika di SMP Islam Al-hikmah Pondok Cabe,” Skripsi, Program Studi Teknik Informatika Universitas Pelita Bangsa, Bekasi, 2019.
-
[34] Y. Aufar, I. S. Sitanggang, and - Annisa, "Parameter Optimization of Rainfall-runoff Model GR4J using Particle Swarm Optimization on Planting Calendar," International Journal on Advanced Science, Engineering and Information Technology, vol. 10, no. 6, p. 2575, December 2020, doi: 10.18517/ijaseit.10.6.9110.
-
[35] H. A. Younis, D. S. Hammadi, and A. N. Younis, "Identify tooth cone beam computed tomography based on contourlet particle swarm optimization," IAES International Journal of Artificial Intelligence (IJ-AI), vol. 11, no. 1, p. 397, March 2022, doi:
10.11591/ijai.v11.i1.pp397-404.
-
[36] B. Pang and L. Lee, "A Sentimental Education: Sentiment Analysis Using Subjectivity Summarization Based on Minimum Cuts," ACL '04: Proceedings of the 42nd Annual Meeting on Association for Computational Linguistics, vol. 42, pp. 271--278, 2004, [Online]. Available: http://arxiv.org/abs/cs/0409058
-
[37] A. R. Naufal, R. Satria, and A. Syukur, “Penerapan Bootstrapping untuk Ketidakseimbangan Kelas dan Weighted Information Gain untuk Feature Selection pada Algoritma Support Vector Machine untuk Prediksi Loyalitas Pelanggan,” Journal of Intelligent Systems, vol. 1, no. 2, pp. 98–108, 2015.
-
[38] G. Xia and W. Jin, "Model of Customer Churn Prediction on Support Vector Machine," Systems Engineering - Theory & Practice, vol. 28, no. 1, pp. 71–77, January 2008, doi: 10.1016/S1874-8651(09)60003-X.
-
[39] Z.-Y. Chen, Z.-P. Fan, and M. Sun, "A hierarchical multiple kernel support vector machine for customer churn prediction using longitudinal behavioral data," European Journal of Operational Research, vol. 223, no. 2, pp. 461–472, December 2012, doi:
10.1016/j.ejor.2012.06.040.
-
[40] A. Bisri and R. S. Wahono, “Penerapan Adaboost untuk Penyelesaian Ketidakseimbangan Kelas pada Penentuan Kelulusan Mahasiswa dengan Metode Decision Tree,” Journal of Intelligent Systems, vol. 1, no. 1, pp. 27–32, 2015.
-
[41] L. D. Utami and R. S. Wahono, “Integrasi Metode Information Gain Untuk Seleksi Fitur dan Adaboost Untuk Mengurangi Bias Pada Analisis Sentimen Review Restoran Menggunakan Algoritma Naïve Bayes,” Journal of Intelligent Systems, vol. 1, no. 2, pp. 120–126, 2015.
-
[42] A. Rohman, V. Suhartono, and C. Supriyanto, “Penerapan Agoritma C4.5 Berbasis Adaboost Untuk Prediksi Penyakit Jantung,” Jurnal Teknologi Informasi, vol. 13, no. 1, pp. 13–19, 2017.
-
[43] I.-C. Yeh and C. Lien, "The comparisons of data mining techniques for the predictive accuracy of probability of default of credit card clients, " Expert Systems with Applications, vol. 36, no. 2, pp. 2473–2480, March 2009, doi: 10.1016/j.eswa.2007.12.020.
-
[44] S. Moro, R. M. S. Laureano, and P. Cortez, "Using data mining for bank direct marketing: An
application of the CRISP-DM methodology," European Simulation and Modelling Conference 2011, no. 1, pp. 117–121, 2011.
-
[45] Z. K. S. Domas, “Pengaruh Tekanan, Kesempatan, Rasionalitas, Kompetensi, Arogansi, serta Kolusi terhadap Ketidakbersediaan Transparansi Pengungkapan Anti-korupsi: Analisis Model Heksagon,” Skripsi. Program Studi Diploma IV Akuntansi Politeknik Keuangan Negara STAN, Tangerang Selatan, 2021.
-
[46] M. Rizkiawan, “Analisis Fraud Hexagon dan Tata Kelola Perusahaan Atas Adanya Kecurangan Dalam Laporan Keuangan,” Skripsi, Program Studi Diploma IV Akuntansi Politeknik Keuangan Negara STAN, 2021.
-
[47] UCI Machine Learning Repository, "Credit Approval Data Set," 1998. https://archive.ics.uci.edu/ml/datasets/credit+approval
-
[48] UCI Machine Learning Repository, "South German Credit (UPDATE) Data Set," 2019. https://archive.ics.uci.edu/ml/datasets/South+German+Credit+%28UPDATE%29
-
[49] V. Lohweg, "banknote authentication Data Set," UCI Machine Learning Repository, 2012. https://archive.ics.uci.edu/ml/datasets/banknote+authentication
-
[50] N. Hooda, CSED, TIET, and Patiala, "Audit Data Data Set," UCI Machine Learning Repository, 2018. https://archive.ics.uci.edu/ml/datasets/Audit+Data
-
[51] R. Kohavi and B. Becker, "Census Income Data Set," UCI Machine Learning Repository, 1994. https://archive.ics.uci.edu/ml/datasets/Census+Income
-
[52] S. Tomczak, "Polish companies bankruptcy data Data Set," UCI Machine Learning Repository, 2016.
https://archive.ics.uci.edu/ml/datasets/Polish+companies+bankruptcy+data
-
[53] Adiyanto, “Prediksi Harga Crude Palm Oil Menggunakan Metode Support Vector Machine dengan Optimasi Parameter Menggunakan Algoritma Genetika,” Jurnal IPSIKOM, vol. 1, no. 1, 2013.
-
[54] D. Kanellopoulos, S. Kotsiantis, and P. Pintelas, "Handling imbalanced datasets: A review Cite this paper Related papers Handling imbalanced datasets: A review," GESTS International Transaction on Computer Science and Engineering, vol. 30, no. 1, pp. 25–36, 2006.
-
[55] J. S. D. Raharjo, “Model Artificial Neural Network Berbasis Particle Swarm Optimization Untuk Prediksi Laju Inflasi,” Jurnal Sistem Komputer, vol. 3, no. 1, pp. 10–21, 2013.
-
[56] R. S. Wahono and N. Suryana, "Combining Particle Swarm Optimization based Feature Selection and Bagging Technique for Software Defect Prediction," International Journal of Software Engineering and Its Applications, vol. 7, no. 5, pp. 153–166, September 2013, doi: 10.14257/ijseia.2013.7.5.16.
-
[57] C. Shabrina, “Metode Hibrida Oversampling Dan Undersampling Untuk Menangani Ketidakseimbangan Data Kegagalan Akademik Pada Universitas XYZ,” Desertasi, Institut Teknologi Sepuluh Nopember, 2019.
-
[58] F. Itoo, Meenakshi, and S. Singh, "Comparison and analysis of logistic regression, Naïve Bayes and KNN machine learning algorithms for credit card fraud detection, " International Journal of Information Technology, vol. 13, no. 4, pp. 1503–1511, August 2021, doi: 10.1007/s41870-020-00430-y.
-
[59] F. Gorunescu, Data Mining, 12th ed., vol. 12. Berlin, Heidelberg: Springer Berlin Heidelberg, 2011. doi: 10.1007/978-3-642-19721-5.
-
[60] J. Perols, "Financial Statement Fraud Detection: An Analysis of Statistical and Machine Learning Algorithms," Auditing: A Journal of Practice & Theory, vol. 30, no. 2, pp. 19–50, May 2011, doi: 10.2308/ajpt-50009.
184
Discussion and feedback