The Comparison of SVM and ANN Classifier for COVID-19 Prediction
on
LONTAR KOMPUTER VOL. 13, NO. 2 AUGUST 2022
DOI : 10.24843/LKJITI.2022.v13.i02.p06
Accredited Sinta 2 by RISTEKDIKTI Decree No. 158/E/KPT/2021
p-ISSN 2088-1541
e-ISSN 2541-5832
The Comparison of SVM and ANN Classifier for COVID-19 Prediction
Ditha Nurcahya Aviantya1, I Gede Pasek Suta Wijayaa2, Fitri Bimantorob3
Dept Informatics Engineering,Faculty of Engineering, University of Mataram Jl. Majapahit No.62, Mataram, Lombok NTB - Indonesia 1dithanurcahya55@email.com
2,3[gpsutawijaya,bimo]@unram.ac.id
Abstract
Coronavirus 2 (SARS-CoV-2) is the cause of an acute respiratory infectious disease that can cause death, popularly known as Covid-19. Several methods have been used to detect COVID-19-positive patients, such as rapid antigen and PCR. Another method as an alternative to confirming a positive patient for COVID-19 is through a lung examination using a chest X-ray image. Our previous research used the ANN method to distinguish COVID-19 suspect, pneumonia, or expected by using a Haar filter on Discrete Wavelet Transform (DWT) combined with seven Hu Moment Invariants. This work adopted the ANN method's feature sets for the Support Vector Machine (SVM), which aim to find the best SVM model appropriate for DWT and Hu moment-based features. Both approaches demonstrate promising results, but the SVM approach has slightly better results. The SVM's performances improve accuracy to 87.84% compared to the ANN approach with 86% accuracy.
Keywords: X-ray image, COVID-19, Classification, Support Vector Machine, Artificial Neural Network
The COVID-19 disease's first outbreak in Wuhan, China, in December 2019 [1] is a respiratory infectious disease caused by coronavirus 2 (SARS-CoV-2). This disease is highly contagious and can be transmitted through the droplet, spreading quickly and widely [2]. The PCR (Polymerase Chain Reaction) swab test is a highly recommended method for detecting COVID-19 patients [3], but it requires health personnel resources and expensive equipment, and a lengthy analysis process [4]. Another method is a rapid antigen that requires a fast time but can only detect suspected COVID-19. The delay in test outcomes and the deficiency of test kits create it challenging to determine the number of positive possibilities of COVID-19 so that the spread of the infection is more expansive and can worsen the situation [4] [5].
Other techniques to detect COVID-19 are examining clinical symptoms, epidemiological records, Computed Tomography (CT) images or chest X-rays, and positive pathogen tests [6]. Radiographic images obtained via X-rays can be used to examine suspected cases of COVID-19 through analysis of pneumonia. Chest X-rays were chosen for examination because they are cheaper, have minor radiation exposure, and have more comprehensive use coverage than CT scans [9][10]. Based on WHO data, that COVID-19 patients generally suffer from severe pneumonia [7]. The Ref [7] is in line with research in China, which showed that 91.1% of 1099 patients diagnosed with Covid-19 developed pneumonia [8]. The similarities between COVID-19 and pneumonia make it difficult for radiologists to distinguish between them, leading to misdiagnosis. Misdiagnosis of disease can result in delays and incorrect treatment resulting in mental and material losses.
Artificial Intelligence (AI) can be developed to assist doctors in diagnosing patients, such as the diagnosis of chest radiographs. One of them uses the Support Vector Machine (SVM). SVM is a learning machine that can be used for image classification of more than two classes. Multiclass SVM can currently classify data into several classes (more than two). Previous studies related to the classification of COVID-19 based on X-ray images using the Convolution Neural Network
(CNN) approaches succeeded in providing an accuracy of 83.4% and 93.2% [11]. While the CNN variation model called CVDNet has succeeded in classifying x-ray images into COVID-19, pneumonia, and normal categories, which has an accuracy of 96.69% [12]. Another radiographic image study based on the Artificial Neural Network (ANN) for classifying six categories was also successfully developed and gave the best accuracy of 88.5% [13].
The moment invariant feature of MRI image application for classifying Alzheimer's disease[14] has been successfully carried out and provides 91.4% accuracy for the KNN technique and 100% accuracy for the SVM technique. Application of features based on Discrete Wavelet Transforms (DWT) and ANN to classify brain images with an accuracy of 94.8% [15].
Another study that applied DWT and ANN haar filters to view cracks under the support of ScaleInvariant Feature Transformation and K-means clustering has achieved an accuracy of 93.4% [16]. Furthermore, the application of DWT feature extraction and Principal Component Analysis with ANN classifier to detect minor chronic brain hemorrhage resulted in 88.43% accuracy. Another work to classify weeds based on moment invariant features and ANN classification techniques has achieved an accuracy of 92.5%[17].
Based on the background outlined above, the author intends to conduct a study to create a model to predict COVID-19 by comparing the SVM and ANN methods. The comparison is made because the two calculation methods have similarities in the information to be considered, distinguishing them in the settlement process. Additionally, this study is a development of the DWT and Moment Invariant-based features of chest x-ray images[18] and Covid-19 prediction based on DWT and moment invariant features and ANN classifier[19]. The main aim of this work is to find the best SVM model appropriate for mentioned features.
This research utilizes a dataset of chest radiography images [20] consisting of three categories, namely COVID-19, pneumonia, and normal. Each class has 1345 images with a resolution of 1024x1024 pixels and is saved in jpg format. The hardware tool used to complete the research is a computer with specifications Intel 8th Gen Core i7 processor, NVIDIA Geforce GPU, and 8 GB RAM. While the software running in this work is Windows 10 64-bit, Python 3.8.5, JupyterLab, and Visual Studio Code.
The research was completed through four main processes: literature study, data preparation, and modeling and testing. The literature study examined the primary sources of research, especially journals and proceedings related to radiographic images, DWT methods, invariant moments, and SVM. The study is in the form of analyzing the advantages and disadvantages of the methods associated with this research.
Data preparation is data selection for the training and testing process. The dataset is a collection of chest radiography images from a research team from Qatar University and the University of Dhaka Bangladesh and collaborators from Pakistan and Malaysia. In this case, the data were randomly selected from a dataset consisting of 15153 images [20]. Based on the query, it turns out that the number of samples of the image is not balanced per category, which can generate issues associated with the achievements of the machine learning model that was built. This issue is solved by resampling the dataset in two manners: under-sampling and over-sampling. In the case of covid classification, the primary item to remark is the number of false negatives because this fallacy is the most harmful compared to false positives. So, under-sampling is done to reduce the large class size so that the data is proportional.
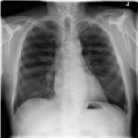
Examples of chest radiographic images for the three classes from the data preparation process are presented in Figures 1, 2, and 3. Figures 2 and 3 show the class data for Covid-19 and Pneumonia, which have characteristic white marks on the lungs with particular intensity levels. However, the white mark intensity level on the COVID-19 chest radiograph is different in brightness. This pattern will be extracted and made into a model for its classification. While Figure
4 is a chest radiograph image of the normal class, which is dominated by black color in the lungs, which shows the air content in the lungs.

Figure 1. COVID-19 image samples
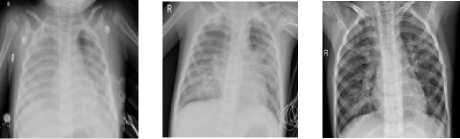
Figure 2. Pneumonia image samples

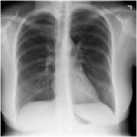
Figure 3. Normal image samples
Modeling and testing require several sub-processes, such as pre-processing, feature extraction, and SVM creation, which will be explained in the following subsection.
In simple terms, there are two main processes, namely training and testing, for developing a COVID-19 prediction model, which is presented in Figure 4.

Figure 4. Training and Testing Process
The training process's first stage is image resizing, grayscale conversion, and normalization, which aims to speed up the process and avoid data inconsistency problems. The second stage is the feature extraction process, which uses the DWT and moment invariant methods, which are then used to train SVM. The third stage is to do SVM testing using validation data taken from training data. Finally, the best training SVM model is stored for the testing data prediction process.
The testing process is carried out using the first and second stages of the training process for each testing image. Furthermore, the best training SVM model is used for the classification of testing image features. Confusion matrix, precision, and recall are used to assess the performance of the proposed prediction system.
At this stage, the input image dataset with a resolution of 1024x1024 pixels is converted to grayscale, resized to 128x128 pixels, and finally normalized. An illustration of the pre-processing process is presented in Figure 5.
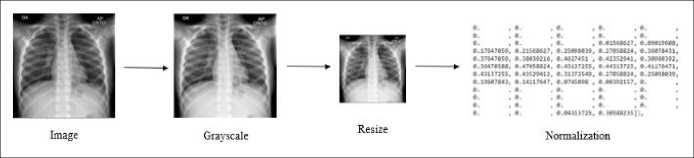
Figure 5. Pre-processing illustration
Each pre-processed image will have its features extracted using the DWT method and invariant moment. Feature extraction was performed using a first-order Daubechies wavelet filter (Haar). The implementation process to get four sub-image called average, detail-horizontal, detailvertical, and detail-diagonal of the input image are done by applying the "PyWavelets" library. Furthermore, the mean, variance, and statistical energy values were calculated from each of the approximation, horizontal, vertical, and diagonal sub-images. An illustration of the feature extraction process with DWT is given in Figure 6.
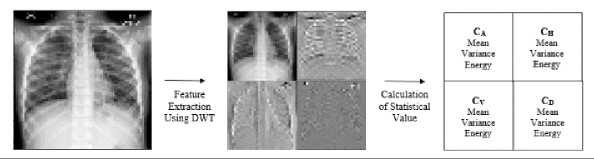
Figure 6. The illustration of DWT's feature extraction
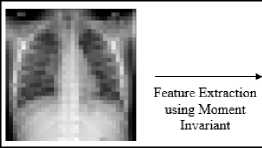
The moment invariant value, which represents the change in value for translational and rotational variations, is extracted from the approximation component (C_A) of the DWT results. This component was chosen because it is the most similar component to the input image. The illustration of moment invariant feature extraction is given in Figure 7.
|
Approximation component.png | |
|
pl |
0.16276407596556242 |
|
pl |
0.026555625477610725 |
|
Pl |
4.28057395545598e-05 |
|
<p4 |
0.0004818795427940936 |
|
φS |
-6.916433479932948e-O8 |
|
φ6 |
3.6081291901626007e-06 |
|
l,6752194357134434e-O8 |
Figure 7. The illustration of invariant moment feature extraction.
The initial process of the training stage is to load the features from the feature extraction stage. The features will be trained with the SVM method. The multiclass support is handled according to a one-vs-one scheme. The One-vs-One strategy splits a multiclass classification into one binary classification problem per each pair of classes. The training process results are stored in the form of a struct for later use in the testing process.
The confusion matrix shown in Table 1 is a tool to assess the result of the model's achievements. True COVID-19 (TC) is the actual data of the COVID-19 category correctly predicted COVID-19. False COVID-19 (FC) is pneumonia or normal category data incorrectly predicted as COVID-19. True Pneumonia (TP) is pneumonia category data correctly predicted as pneumonia. False Pneumonia (FP) is another category incorrectly predicted as pneumonia. True Normal (TN) is a normal category correctly predicted as a normal category. False Normal (FN) is another category incorrectly predicted as a normal category.
Table 1. Confusion matrix tool for model evaluation
Predicted category
Covid-19 Pneumonia Normal
|
Actual |
Covid-19 |
TC |
FP |
FN |
|
Pneumonia |
FC |
TP |
FN | |
|
category |
Normal |
FC |
FP |
TN |
The Confusion matrix will calculate three quantities: accuracy, precision, and recall. Accuracy is calculated using equation 1.
accuracy =
(TC) + (TP) + (TN)
Total
(1)
The precision calculated using equation 2 is the level of correctness of the instance to forecast the category that matches the actual category. The accuracy is very valuable for specifying the effect of false positives. The model detects a non-covid category as COVID-19, implying that the instance lacks precision.
precision =
(TC)
(TC) + (FC)
(2)
The recall calculated using equation 3 is valuable for defining the effect of false negatives. The instance incorrectly predicts COVID-19 data as non-covid, meaning recall is of low value. The Covid prediction system becomes very dangerous if the system has a low recall.
recall =-----ctc)-----
(3)
(TC) + (FP) + (FN)
Testing is accomplished with several phases to obtain the best model. The first phase is to choose 1345 images randomly from the dataset. Furthermore, the selected data is split under the ratio of 80% versus 20% for the training and testing set, respectively. The SVM model is tested to find the best parameters using Grid Search:
-
1) C (0.1, 1, 10, 100, 1000)
-
2) Kernel (linear, polynomial, sigmoid, and radial basis function (RBF))
-
3) Gamma (1, 0.1, 0.01, 0.001, 0.0001)
The initial parameters applied in the model test are the value of C=0.1, Gamma=1, and the linear kernel. The initial parameter values are selected from the first-order value of each test parameter. Finally, the best model is evaluated by k-fold cross-validation utilizing the k = 2~10 to validate and keep away bias in data sharing.
This test aims to determine the best value of the C parameter of the SVM model. It is well known that the values of C and Gamma depend on the case of the image being handled. The test results for variations in the value of C are presented in Table 2.
|
Table 2. The value of C versus the performance indicator | |||
|
C |
Accuracy |
Precision |
Recall |
|
0.1 |
47% |
35% |
48% |
|
1 |
58% |
55% |
56% |
|
10 |
63% |
62% |
62% |
|
100 |
67% |
67% |
66% |
|
1000 |
77% |
77% |
76% |
According to Table 4, the best achievement was obtained at the value of C=1000. The C parameter tells the SVM optimizer how much we want to avoid misclassifying each training instance. In this case, the larger the value of C, the higher the model's performance. For larger C values, the optimization will select a hyperplane with less margin if that hyperplane provides all training data classified correctly. Furthermore, the value of C=1000 will be employed in the following evaluation.
A kernel is a way of adding more features to the data to make it linearly separable. The kernel variations will also produce different performances depending on the data. Polynomial, RBF, and sigmoid kernels are popular, especially for non-linear data. The achievement of each variation on the kernel type is shown in Table 3.
Table 3. The type of kernel versus the performance indicator
|
kernel |
Accuracy |
Precision |
Recall |
|
linear |
77% |
77% |
76% |
|
polynomial |
86% |
86% |
86% |
|
RBF |
81% |
81% |
81% |
|
sigmoid |
16% |
10% |
15% |
The experimental result in Table 3 shows that the best achievement of the SVM model is given when the polynomial kernel type is applied. Furthermore, the polynomial kernel type will be employed for the next evaluation.
Similar to the C parameter, the variations values of Gamma will deliver different interpretations depending on the image obstacle being addressed. In this work, five Gamma variations were evaluated, and the experimental results are presented in Table 4.
Table 4. The Gamma variations versus the performance indicator Gamma
|
Gamma |
Accuracy |
Precision |
Recall |
|
1 |
86% |
86% |
86% |
|
0.1 |
72% |
72% |
71% |
|
0.01 |
46% |
37% |
47% |
|
0.001 |
30% |
10% |
33% |
|
0.0001 |
30% |
10% |
33% |
Table 4 shows that the Gamma=1 gives the best achievement. It can be seen that the Gamma value significantly affects the accomplishment of the SVM model. The achievement of the SVM model decreases along with the smaller Gamma value.
Finally, it can be concluded that the three best parameters for the SVM model are C=1000, Gamma=1, and polynomial kernel type, which provides the highest performance. Hence, the best SVM model is evaluated for the data test, and the confusion matrix in Table 5 represents the test results.
Table 5. The best SVM model achievements
Predicted Class
|
COVID-19 |
Pneumonia |
Normal | ||
|
Actual Class |
COVID-19 |
257 |
15 |
13 |
|
Pneumonia |
16 |
203 |
27 | |
|
Normal |
11 |
32 |
233 | |
Based on the data in Table 5, the best model of SVM performs well for a chest radiography image prediction, indicated by 86.87% accuracy, 85.68% precision, and 85.71% recall.
The next test was conducted to evaluate the variation of data splitting using k-fold cross-validation on the best SVM model. The splitting technique in the previous test data was hold-out validation which had the weakness of bias between training data and testing data because of a sharing process. Thus, testing using k-fold cross-validation, which divides the data into several k groups and ensures that each group is used as testing data, can overcome the weaknesses of the previous test.
Variations in the k value or fold value used in this test are 2, 3, 4, 5, 6, 7, 8, 9, and 10. For each variation in the value of k, one-fold will be taken as testing data and the rest as training data. The test results are presented in Table 6.
Table 6. The experimental result on data-splitting
|
K |
Accuracy |
Precision |
Recall |
|
2 |
83.91% |
83.75% |
83.67% |
|
3 |
83.91% |
83.98% |
83.88% |
|
4 |
85.40% |
85.32% |
85.56% |
|
5 |
83.91% |
83.85% |
83.80% |
|
6 |
82.88% |
83.16% |
82.87% |
|
7 |
83.37% |
83.28% |
83.31% |
|
8 |
85.11% |
85.76% |
85.20% |
|
9 |
85.86% |
85.87% |
85.96% |
|
10 |
87.84% |
87.80% |
87.96% |
Table 6 shows that the k = 10 delivers the most increased accuracy, precision, and recall (87.84% accuracy rate, 87.8% precision, and 87.96% recall) when the ratio of training and testing data sharing is 9:1. It means the best model of SVM could deliver a good performance for k= 10, which is the best data sharing with low bias.
The comparison of the model is based on the best results from the predictions proposed using SVM with the previous predictions using the method[19]. Based on the experimental results, it is known that the success of the two models is slightly different. However, the prediction model using SVM gave a slightly better performance with 87.84% accuracy, 87.8% precision, and 87.96% recall, as presented in Table 7.
Table 7. Model Comparison
|
Method |
Accuracy (%) |
Precision (%) |
Recall (%) |
|
SVM |
87.84 |
87.80 |
87.96 |
|
ANN |
86.32 |
86.35 |
86.26 |
Our proposed SVM model's accuracy, precision, and recall are slightly better than our previously reported ANN method[19]. The excellent optimization and similarity treatment of both the SVM and ANN methods allowed us to analogize these computational approaches. The SVM method slightly outperforms ANN for the chest radiographic images for our application using the current data set. The exact reason for this improvement is difficult to determine and may be due to better or varying-parameter selection and non-linear nature of the dataset, or both. It could also be because SVM converges on a global minimum and allows for better noise tolerance; therefore, it may be more robust for a large set of features [21]. Nevertheless, both ANN and SVM could be used to identify COVID-19 suspects, pneumonia, or normal from chest radiographic images. Compared to the most related method, CVDNet[12], which provided an accuracy of 96.69%, Our proposed SVM shows a lack of performance; however, the SVM model requires much fewer parameters than the commonly CNN-based method (CVDNet)[12].
The best SVM prediction model with statistical features of DWT results and moment invariance has been successfully developed with good performance, as evidenced by 86% accuracy, 86% precision rate, and 86% recall rate. The best parameters of the SVM prediction model for chest radiography image prediction are C=1000, Gamma=1, and polynomial kernel type. Based on the k-fold cross-validation test conducted to verify the model's achievement, the best accuracy rate is 87.84%, the precision level is 87.8%, and the recall rate is 87.96% for the best k value is 10. When compared to the model ANN prediction, the SVM prediction model gives slightly outperformed ANN results for the chest radiographic images for our application using the current data set.
Other models still need to be developed in the future, considering the performance is not yet optimal. Deep learning will likely improve predictive performance, considering that Deep-Learning assesses many features in the prediction process.
References
-
[1] World Health Organization, “Q&A on coronaviruses (COVID-19).” .
-
[2] World Health Organization, “Pesan dan Kegiatan Utama Pencegahan dan Pengendalian COVID-19 di Sekolah,” 2020.
-
[3] A. Susilo et al., “Coronavirus Disease 2019: Tinjauan Literatur Terkini,” Jurnal Penyakit Dalam Indonesia, vol. 7, no. 1, p. 45, 2020, doi: 10.7454/jpdi.v7i1.415.
-
[4] T. Yang, Y.-C. Wang, C.-F. Shen, and C.-M. Cheng, "Point-of-Care RNA-Based Diagnostic Device for COVID-19," Diagnostics, vol. 10, no. 3. 2020, doi: 10.3390/diagnostics10030165.
-
[5] A. News, "India's poor testing rate may have masked coronavirus cases," 2020.
-
[6] M. E. H. Chowdhury et al., "Can AI Help in Screening Viral and COVID-19 Pneumonia?,"
IEEE Access, vol. 8, pp. 132665–132676, 2020, doi: 10.1109/ACCESS.2020.3010287.
-
[7] World Health Organization, "Clinical management of severe acute respiratory infection
(SARI) when COVID-19 disease is suspected.".
-
[8] W. Guan et al., “Clinical Characteristics of Coronavirus Disease 2019 in China,” New
England Journal of Medicine, vol. 382, no. 18, pp. 1708–1720, Feb. 2020, doi: 10.1056/NEJMoa2002032.
-
[9] W. H. Self, D. M. Courtney, C. D. McNaughton, R. G. Wunderink, and J. A. Kline, "High discordance of chest x-ray and computed tomography for detection of pulmonary opacities in ED patients : implications for diagnosing pneumonia," The American Journal of Emergency Medicine, vol. 31, no. 2, pp. 401–405, 2013, doi: 10.1016/j.ajem.2012.08.041.
-
[10] G. D. Rubin et al., "The Role of Chest Imaging in Patient Management During the COVID-19 Pandemic A Multinational Consensus Statement From the Fleischner Society," no. July, pp. 106–116, 2020, doi: 10.1016/j.chest.2020.04.003.
-
[11] N. Science, C. Phenomena, S. Hassantabar, M. Ahmadi, and A. Sharifi, "Diagnosis and detection of infected tissue of COVID-19 patients based on lung x-ray image using convolutional neural network approaches," Chaos , Solitons & Fractals, vol. 140, 2020, doi: 10.1016/j.chaos.2020.110170.
-
[12] C. Ouchicha, O. Ammor, and M. Meknassi, "CVDNet: A novel deep learning architecture for detection of coronavirus ( Covid-19 ) from chest x-ray images," Chaos , Solitons & Fractals, vol. 140, 2020, doi: 10.1016/j.chaos.2020.110245.
-
[13] C. Z. Basha, G. Rohini, A. V. Jayasri, and S. Anuradha, "Enhanced And Effective Computerized Classification Of X-ray Images," in 2020 International Conference on
Electronics and Sustainable Communication Systems (ICESC), 2020, pp. 86–91, doi: 10.1109/ICESC48915.2020.9155788.
-
[14] A. Mohammed, F. al Azzo, and M. Milanova, "Classification of Alzheimer Disease based on Normalized Hu Moment Invariants and Multiclassifier," International Journal of Advanced Computer Science and Applications (IJACSA), vol. 8, pp. 10–18, Jan. 2017, doi:
10.14569/IJACSA.2017.081102.
-
[15] C. M. N. Kumar, B. Ramesh, and J. Chandrika, "Design and Implementation of an Efficient Level Set Segmentation and Classification for Brain MR Images," in Dash S., Bhaskar M., Panigrahi B., Das S. (eds) Artificial Intelligence and Evolutionary Computations in Engineering Systems. Advances in Intelligent Systems and Computing, Springer, New Delhi, 2016, pp. 559–568.
-
[16] C. Basha, T. Padmaja, and G. Balaji, "An Effective and Reliable Computer Automated Technique for Bone Fracture Detection," EAI Endorsed Transactions on Pervasive Health and Technology, vol. 5, p. 162402, Jul. 2018, doi: 10.4108/eai.13-7-2018.162402.
-
[17] A. Bakhshipour and A. Jafari, "Evaluation of support vector machine and artificial neural networks in weed detection using shape features," Computers and Electronics in Agriculture, vol. 145, pp. 153–160, 2018, doi: https://doi.org/10.1016/j.compag.2017.12.032.
-
[18] I. G. P. S. Wijaya, D. N. Avianty, F. Bimantoro, and R. Lestari, “Ekstraksi Fitur Citra Radiografi Thorax Menggunakan DWT dan Moment Invariant,” Journal of Computer Science and Informatics Engineering (JCOSINE), vol. 5, no. 2, pp. 158–166, 2021.
-
[19] D. N. Avianty, I. G. P. S. Wijaya, F. Bimantoro, R. Lestari, and T. D. Cahyawati, "COVID-19 Prediction Based on DWT and Moment Invariant Features of Radiography Image Using the Artificial Neural Network Classifier," in Proceedings of the 2nd Global Health and Innovation in conjunction with 6th ORL Head and Neck Oncology Conference (ORLHN 2021), 2022, pp. 152–162, doi: https://doi.org/10.2991/ahsr.k.220206.030.
-
[20] T. Rahman et al., "COVID-19 Chest Radiography Database," 2020.
-
[21] H. Bisgin et al., "Comparing SVM and ANN based Machine Learning Methods for Species Identification of Food Contaminating Beetles," Sci Rep, vol. 8, no. 1, p. 6532, 2018, doi: 10.1038/s41598-018-24926-7.
136
Discussion and feedback