Epileptic Seizure Classification using Deep Batch Normalization Neural Network
on
LONTAR KOMPUTER VOL. 11, NO. 3 DECEMBER 2020
DOI : 10.24843/LKJITI.2020.v11.i03.p01
Accredited B by RISTEKDIKTI Decree No. 51/E/KPT/2017
p-ISSN 2088-1541
e-ISSN 2541-5832
Epileptic Seizure Classification using Deep Batch Normalization Neural Network
Adenuar Purnomoa1, Handayani Tjandrasaa2
aDepartment of Informatics, Institut Teknologi Sepuluh Nopember Jalan Raya ITS, Surabaya, Indonesia 1Adenuar.19051@mhs.its.ac.id
Abstract
Epilepsy is a chronic noncommunicable brain disease. Manual inspection of long-term Electroencephalogram (EEG) records for detecting epileptic seizures or other diseases that lasted several days or weeks is a time-consuming task. Therefore, this research proposes a novel epileptic seizure classification architecture called the Deep Batch Normalization Neural Network (Deep BN3), a BN3 architecture with a deeper layer to classify big epileptic seizure data accurately. The raw EEG signals are first to cut into pieces and passed through the bandpass filter. The dataset is very imbalanced, so an undersampling technique was used to produce a balanced sample of data for the training and testing dataset. Furthermore, the balanced data is used to train the Deep BN3 architecture. The resulting model classifies the EEG signal as an epileptic seizure or non-seizure. The classification of epileptic seizures using Deep BN3 obtained pretty good results compared to other architectures used in this research, with an accuracy of 53.61%.
Keywords: Deep BN3, Seizure, Epilepsy, Deep Learning, Neural Network.
architecture is suited to a smaller dataset [15]. Since epilepsy EEG data is a big dataset, a deeper architecture may be better suited to classify big data.
Therefore, this research proposes a novel epileptic seizure classification architecture called the Deep Batch Normalization Neural Network (Deep BN3). The Deep BN3 architecture is a BN3 architecture with a deeper layer inspired by deep CNN architecture to classify big epileptic seizures data accurately. The Deep BN3 architecture is deep CNN architecture added with Batch Normalization layer, an essential layer in BN3 architecture. This research’s contribution is to design deeper BN3 networks, which was done by stacking uniform convolutions. The raw EEG signal is first cut into pieces and passed through the bandpass filter. The dataset is very imbalanced. The imbalanced dataset can result in a severe bias towards the majority class, reducing the classification performance and increasing the number of false negatives. So an undersampling technique was used to produce a balanced sample of data for the training and testing dataset. Undersampling is a technique to delete data in the majority class. Furthermore, Deep BN3 architecture is trained using balanced data. The resulting model is then used to classify whether the tested EEG signal is an epileptic seizure or non-seizure. The testing data results are compared with the existing ground-truth to compute the confusion matrix’s sensitivity, specificity, and accuracy. Deep BN3 will be concluded as a good architecture if it can compete with another architecture.
An overview of this research can be seen in Figure 1, starting from the dataset used, preprocessing, then classification using Deep BN3 architecture.
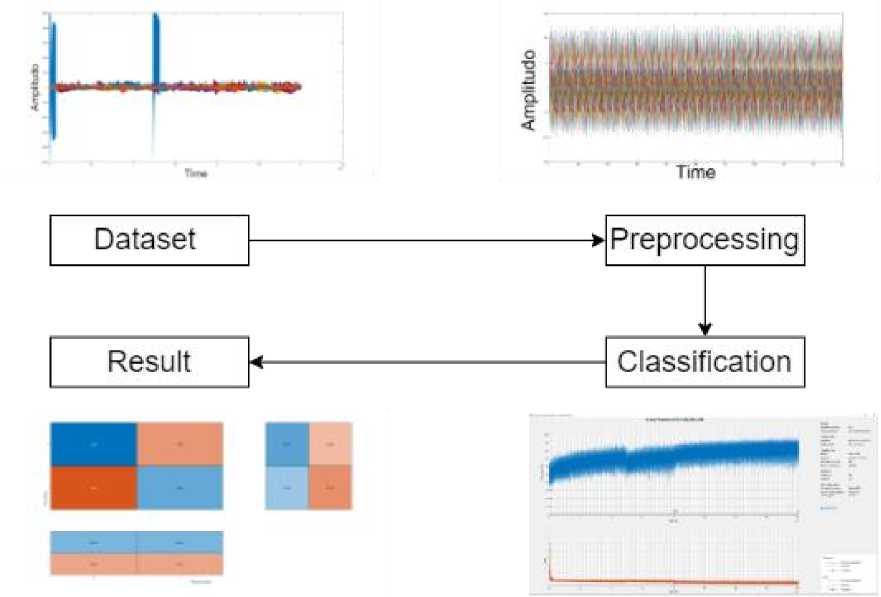
Figure 1. Overview of the process for Epileptic Seizure Classification
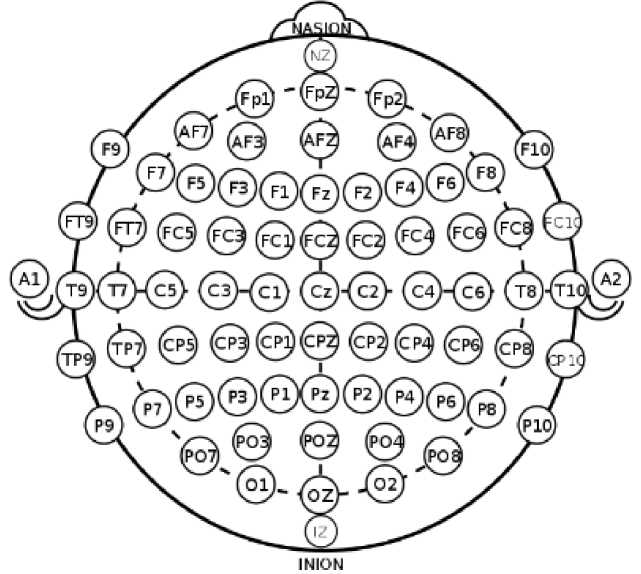
Figure 2. The International 10–20 Electrode System Featuring Modified Combinatorial Nomenclature (MCN).
The data used in this research is a dataset belonging to TUH (Temple University Hospital), The TUH EEG Seizure Corpus version 1.5. This dataset is recorded based on the International 10-20 Electrode System featuring Modified Combinatorial Nomenclature (MCN), shown in Figure 2, with a sampling rate of 250 Hz. The training set consists of 1185 sessions taken from 592 patients, of which 343 sessions were seizure sessions, while the testing set consists of 238 sessions taken from 50 patients with 108 sessions being seizure sessions. Both the training and testing set used in this research is only limited to sessions with seizures.
There are 26 channels used in both training and testing sets. The raw EEG signal seen in Figure 3 will initially be truncated every 2 seconds and then labeled according to the provided groundtruth. The EEG signal is then passed through a bandpass filter with a cut-off frequency of 0.5-44 Hz.
The undersampling technique will be carried out to produce balanced data for the training and testing sets. We balanced both training and testing sets because both sets are enormous and very unbalanced, with a non-seizure class around 20-25 times than seizure class. Therefore we must balance those data such that it can be appropriately classified. Otherwise, it will tend to classify closer to the class with more massive amounts of data. The details of class balancing for both training and testing sets are shown in Table 1 and Table 2.
Table 1. Amount of Training data
|
Class |
Before undersampling |
After undersampling |
|
Seizure |
28640 |
28640 |
|
Non-seizure |
308112 |
28640 |
Table 2. Amount of Testing data
|
Class |
Before undersampling |
After undersampling |
|
Seizure |
16998 |
16998 |
|
Non-seizure |
108373 |
16998 |
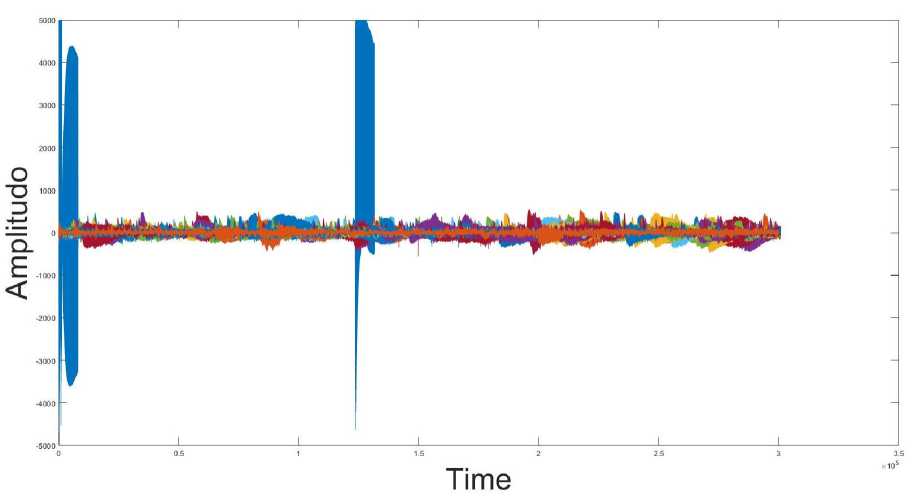
Figure 3. Raw EEG from The TUH EEG Seizure Corpus version 1.5
Deep BN3 architecture used in this research can be seen in Figure 4. The first layer is the input layer. The inputs are the preprocessed signals that converted into a 2-dimensional image graphic, as shown in Figure 5. Then the batch normalization layer, continued by the convolutional layer with the filter size of 4 × 4, and the number of filters is 16. The next layer is the convolutional layer, the batch normalization layer, and the max-pooling layer, repeated four times. Each convolutional layer has a filter size of 4 × 4, and the number of filters is 16. Then the last max-pooling layer is followed by the fully connected layer. The dropout layer repeated twice with the fully connected layer’s configuration output size is 32 for the first fully connected layer and 16 for the second and with both dropout value 0.5. Finally, the last layer is the fully connected layer with the softmax function to classify the input. The training configuration used in this research are maximum training epoch 200 epoch, initial learning rate 10-3, and after 100 iterations the learning rate become 10-4. The training option used in this research is Adam optimizer. Adam weight update equation can be seen in (1), where wt is model weights, η is the learning rate, e is the epsilon and mt, vtare bias-corrected estimators for the first and second moments. After the training model is obtained, then the testing set will be classified using the training model.
mt
(1)
wt = wt-ι-η√^
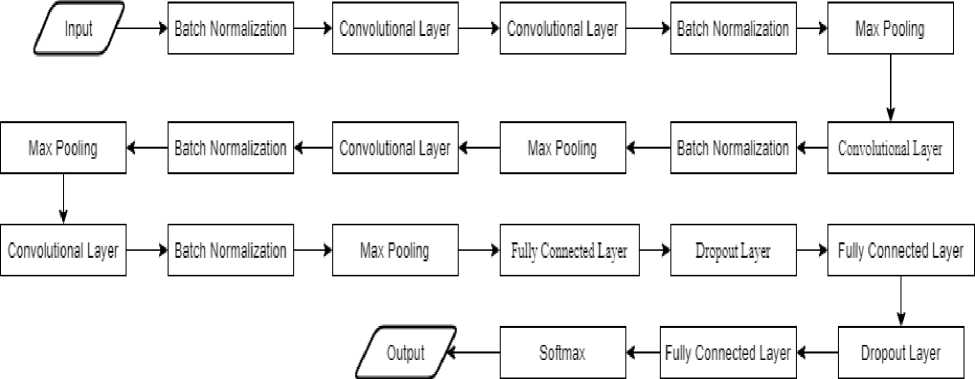
Figure 4. Deep BN3 Architecture
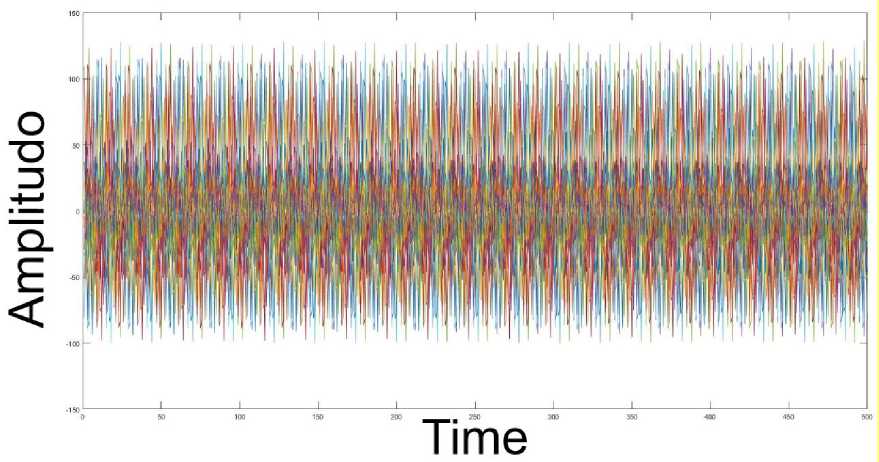
Figure 5. An input image of the 26 channel signal

Figure 6. CNN Architecture

Figure 7. BN3 Architecture
Table 3. Accuracy, Sensitivity, and Specificity results of each architecture for the testing set
|
Architecture |
Accuracy (%) |
Sensitivity (%) |
Specificity (%) |
|
Deep BN3 |
53.61 |
46.60 |
60.62 |
|
CNN |
49.99 |
46.54 |
53.44 |
|
BN3 |
52.95 |
42.54 |
63.35 |
An overview of the CNN and BN3 architecture can be seen in Figures 6 and 7. The results of each architecture are shown in Table 3. Deep BN3 has the highest testing set accuracy, with 53.61% accuracy, and has the highest sensitivity with 46.6%. However, for specificity, the BN3 architecture got the highest, at 63.35%. As we can see, the testing accuracy results of each architecture are only 50-55%. One of the key factors is that the subject in the testing set different from the training set. Suppose the signal between the training set and the testing set is different. In that case, the training set signal may have different extracted fundamental feature values than the testing set. The other factor, in this research’s dropout value is high so it makes the training accuracy is not too high. The low accuracy in the training model causing low testing accuracy. The preprocessing step is also a factor that influences the low metric results of the three architectures. The different cutting processes can affect whether the spike from the seizure can be captured intact or only a piece of it within the cut’s range. If the seizure spike in the data is only partly captured, it will affect the results. The undersampling technique used in this research is also one factor of why the accuracy is low. A better undersampling technique used may increase the accuracy results. The other factor in this research used a time-domain signal, so the key features can’t be shown clearly, compared to the frequency domain used in research [3]. In research [3], the FFT and power spectrum usage used to have better results when there are 20 features extracted, which can be used in the future.
Tables 4, 5, and 6 is the confusion matrix of the testing set for each architecture. The deep BN3 architecture has better accuracy, shown by the sum of truly predicted seizure and true predicted
non-seizure. Figure 9 is an example of a misclassified seizure signal. The signal has seizure spikes, but the Deep BN3 and the CNN architecture classified it as a non-seizure signal. Meanwhile, only BN3 architecture classified it as a seizure signal.
Table 4. Confusion Matrix of Deep BN3 Architecture
|
Predicted Seizure |
Predicted Non-Seizure | |
|
True Seizure |
7921 |
9077 |
|
True Non-seizure |
6694 |
10304 |
|
Table 5. Confusion Matrix of CNN Architecture | ||
|
Predicted Seizure |
Predicted Non-Seizure | |
|
True Seizure |
7911 |
9087 |
|
True Non-seizure |
7915 |
9083 |
|
Table 6. Confusion Matrix of BN3 Architecture | ||
|
Predicted Seizure |
Predicted Non-Seizure | |
|
True Seizure |
7231 |
9767 |
|
True Non-seizure |
6229 |
10769 |

Figure 8. The image of signal misclassified by the models of Deep BN3, and CNN Architecture
References
-
[1] WHO, “WHO Epilepsy Fact Sheet,” 2019. [Online]. Available: https://www.who.int/news-room/fact-sheets/detail/epilepsy. [Accessed: 11-Feb-2020].
-
[2] S. Roy, U. Asif, J. Tang, and S. Harrer, “Machine Learning for Seizure Type Classification: Setting the benchmark,” pp. 2–6, 2019.
-
[3] H. Tjandrasa, S. Djanali, and F. X. Arunanto, “Feature extraction using combination of intrinsic mode functions and power spectrum for EEG signal classification,” Proc. - 2016 9th International Congress on Image and Signal Processing, Biomedical Engineering and Informatics, CISP-BMEI 2016, pp. 1498–1502, 2017.
-
[4] H. Tjandrasa and S. Djanali, “Classification of EEG signals using single channel independent component analysis, power spectrum, and linear discriminant analysis,” in Lecture Notes in Electrical Engineering, 2016, vol. 387, pp. 259–268.
-
[5] U. R. Acharya, S. Lih, Y. Hagiwara, J. Hong, and H. Adeli, “Deep convolutional neural network for the automated detection and diagnosis of seizure using EEG signals,” Computer in Biology and Medicine, vol. 100, no. July 2017, pp. 270–278, 2018.
-
[6] S. Raghu, N. Sriraam, Y. Temel, S. V. Rao, and P. L. Kubben, “EEG based multi-class seizure type classification using convolutional neural network and transfer learning,” Neural Networks, vol. 124, pp. 202–212, 2020.
-
[7] J. Birjandtalab, M. Heydarzadeh, M. Nourani, and A. Background, “Automated EEG-Based Epileptic Seizure Detection Using Deep Neural Networks,” no. 1, pp. 2–5, 2017.
-
[8] I. Ullah, M. Hussain, E. Qazi, and H. Aboalsamh, “An automated system for epilepsy detection using EEG brain signals based on deep learning approach,” Expert Systems with Applications, vol. 107, pp. 61–71, 2018.
-
[9] F. Achilles, F. Tombari, V. Belagiannis, A. M. Loesch, S. Noachtar, and N. Navab, “Convolutional neural networks for real-time epileptic seizure detection,” Computer Methods Biomechanics and Biomedical Engineering Imaging and Visualisations, vol. 6, no. 3, pp. 264–269, 2018.
-
[10] N. D. Truong et al., “Convolutional neural networks for seizure prediction using intracranial and scalp electroencephalogram,” Neural Networks, vol. 105, pp. 104–111, 2018.
-
[11] M. Hosseini, D. Pompili, K. Elisevich, and H. Soltanian-Zadeh, “Optimized Deep Learning for EEG Big Data and Seizure Prediction BCI via Internet of Things,” IEEE Transactions Big Data, vol. 3, no. 4, pp. 392–404, Dec. 2017.
-
[12] M. Liu, W. Wu, Z. Gu, Z. Yu, F. F. Qi, and Y. Li, “Deep learning based on Batch Normalization for P300 signal detection,” Neurocomputing, vol. 275, pp. 288–297, 2018.
-
[13] Y. Chen et al., “Texts With Deep Learning Approaches,” IEEE Transactions and Intelligent Transportation Systems, vol. PP, no. 8, pp. 1–10, 2018.
-
[14] D. Macêdo, C. Zanchettin, A. L. I. Oliveira, and T. Ludermir, “Enhancing batch normalized convolutional networks using displaced rectifier linear units: A systematic comparative study,” Expert Systems with Applications, vol. 124, pp. 271–281, 2019.
-
[15] A. Schindler, T. Lidy, and A. Rauber, “Comparing shallow versus deep neural network architectures for automatic music genre classification,” CEUR Workshop Proceedings, vol. 1734, pp. 17–21, 2016.
131
Discussion and feedback