Buildings Cracks Classification Using Zoning and Invariant Moment Features and Quadratic Discriminant Analysis Classifier
on
LONTAR KOMPUTER VOL. 10, NO. 3 DECEMBER 2019
DOI : 10.24843/LKJITI.2019.v10.i03.p04
Accredited B by RISTEKDIKTI Decree No. 51/E/KPT/2017
p-ISSN 2088-1541
e-ISSN 2541-5832
Buildings Cracks Classification Using Zoning and Invariant Moment Features and Quadratic Discriminant Analysis Classifier
I Gede Pasek Suta Wijayaa1, Ida Bagus Ketut Widiarthaa2, Fitri Bimantoroa3, Aldian Wahyu Septiadia4
aInformatics Engineering Dept., Faculty of Engineering, University of Mataram
Jl. Majapahit 62, Mataram, Lombok NTB, Indonesia
1gpsutawijaya@unram.ac.id(corresponding author)
2widi@unram.ac.id, 3bimo@unram.ac.id, 4aldianwahyu78@gmail.com
Abstract
Natural disasters such as earthquake often cause cracks in buildings and even demolish them. The cracked building must be assessed by an expert to determine whether the building is still suitable for use or not. The feasibility of a building is assessed based on the width, depth, and length of cracks in walls, beams, columns, and even the floor of the building. Only experienced experts can do such kind of task so that building assessment requires many structural engineering experts when an earthquake has happened. However, structural engineering experts are limited which able to do buildings assessment in the area affected. Therefore, the research based on a pattern recognition approach is conducted to classify cracks in buildings to be mild, moderate, or severe. It will be part of automatic building assessment based on the crack analysis. An alternative pattern recognition approach for classifying buildings cracks is a scheme based on zoning and shape features and Quadratic discriminant analysis (QDA) classifier. Based on the experimental results the proposed scheme gives reasonable achievement more than 80% of accuracy.
Keywords: Expert System, Image Classification, Moment, Zoning, QDA
Earthquake is vibrations that occur on the surface of the earth due to the sudden release of energy, which creates seismic waves. Tectonic movements and volcanic eruptions usually cause earthquakes. Earthquake magnitude is measured by using the Richter Scale (RS). An earthquake measuring more than 5 RS has potentially caused cracks and even demolish buildings. Certain cracks in buildings (mild, moderate, or severe) are indicative of the failure rate of the structure of the building. Theoretically, crack is a symptom due to the many combinations of forces acting on the building that exceed the capacity of the building or its material components [1]. The level of damage to buildings can be seen from the shape of the cracks that can be assessed by experts during assessment activities. The building assessment activities can be carried out through two stages, namely the initial inspection and detail inspection through a series of tests before concluding in the reliability assessment. Until the testing phase, several standards and manuals must be available, which must be used as references.
Up today, the building’s assessment after the earthquake has been carried out manually by structural engineering experts. The expert checks the building cracks, measuring the level of damage, and adjusting to standards that will be used as a reference to determine whether the building still feasible to be used or not. Commonly, the damage level is classified based on crack’s
length, width, and area (quantitative metrics), which is categorized as minor, moderate, and severe cracks[2]. However, the assessment process requires a long time and is expensive due to limited experts and the large affected area.
On the other hand, digital image processing and pattern recognition have been widely used to analyze various things, including classification. In essence, the principle of pattern recognition follows the working principle of the human brain in recognizing and concluding about different objects captured by the human senses, especially the eyes for images and ears for sound. This concept is a challenge to utilize pattern recognition and digital image processing in carrying out assessment activities for post-earthquake buildings.
Various types of research related to pattern recognition and digital image processing have been carried out to determine conclusions. The pattern recognition process and digital image processing have several steps are taken, namely, feature extraction stages and classification. Several studies on the concept of pattern recognition and digital image processing have been conducted to classify building cracks, including image centroid approach, statistical approach, GLCM texture analysis, wavelet transformation, and so on. The results of the accuracy obtained using the methods mentioned are 70% to 95%[3]. The results showed that applying the concept of pattern recognition and digital image processing in the case of crack identification and classification could determine damage (damaged or undamaged) to a percentage of 75-95%.
The most related work of the implementation of the zoning feature was for character recognition recognition[4], which obtained reasonable accuracy. Additionally, the other character recognition using local and global features and Learning Vector Quantization (LVQ) [5] was proposed in 2007, which provided reasonable achievement. Another approach using Quadratic Discriminant Analysis (QDA classifier produced the best accuracy with 20 features or less for Arabic character recognition, while Linear Discriminant Analysis (LDA) classifier provided the best accuracy with more features[6]. It means that Zoning features and QDA classifier is potential to be employed for crack classification because the crack patterns are similar to those of characters because some parts of the crack images are similar to the Arabic character’s handwriting style in terms of bows and arches.
Crack detection and classification techniques with quantitative analysis on an infrastructure (the road, bridge, pavement, building, railway track, tunnel, ship, vehicle, and aircraft) is an essential process in finding crack level using various approaches[2, 7, 8, 9]. A great review and analysis of crack detection had been successfully examined on 20 image processing algorithms[3]. From this review, it was found that the GLCM with ANN (Artificial Neural Network) methods were also included in the work for handling the crack detection for thermography, visual color and grayscale images of concrete blocks. However, its performance lack of accuracy (ranging from 71 to 75.2%)[10, 11]. Additionally, a deep-learning-based approach for road crack detection provided remarkable achievement compared with features obtained with existing hand-craft techniques[12].
Based on the previous research, the paper proposes zoning and shape features and QDA classifier for the crack level classification of Lombok earthquake-damaged building. The main propose of this work is to find out the compact and powerful scheme for crack level classification of damage building due to the earthquake. The compact scheme must require less computational complexity, which is potentially developed for the smartphone application.
Briefly, Figure 1 presents building crack classification using zoning and shape features and QDA classifiers. This system consists of several main processes, namely: pre-processing, feature extraction, and classification.
Each training image and test image are converted into grayscale to get an image value of 0 to 255 (0 for black and 255 for white). The grayscale matrix generated from the preprocessing will be
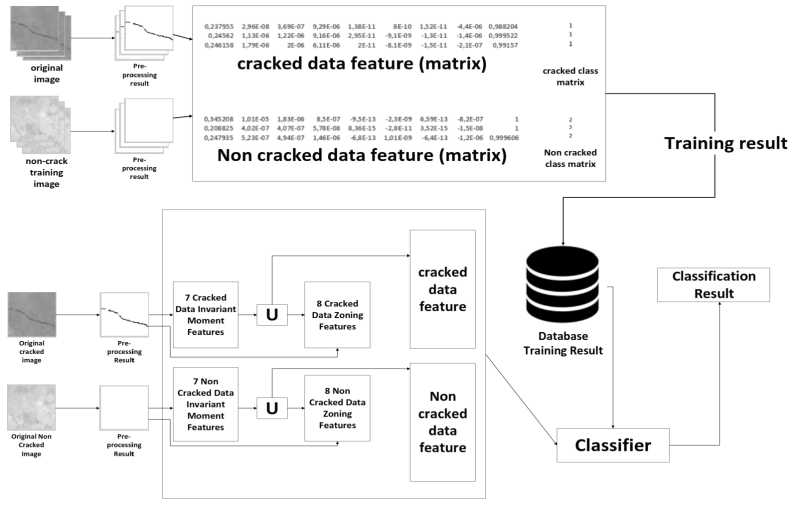
Figure 1. Crack classification block diagram.
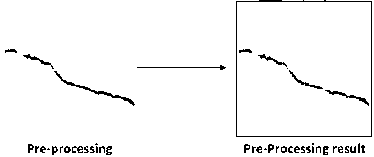
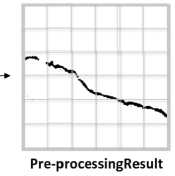
used to calculate seven invariant moments, which represents the shape information of the image. In this case, the a weighted sum of the R, G, and B components (0.2989 * R + 0.5870 * G + 0.1140 * B)[13] are employed for as grayscale transformation. Additionally, a binarization, which converts each pixel of the crack image into binary value (0 or 1) will be used to perform zoning features in this study. The binary image is obtained by replacing all pixels in the input image with luminance higher than level with the value 1 (white) and replacing all other pixels with the value 0 (black). The pre-processing sequence of the crack image is shown in Figure 2.
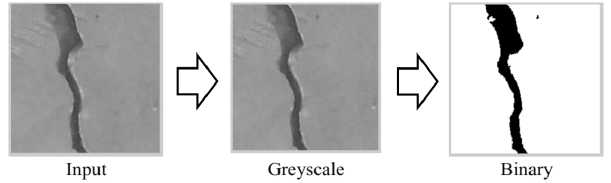
Figure 2. Pre-Processing sequence of crack image.
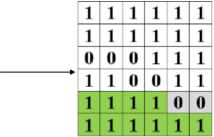
Feature extraction is used to extract unique values from an object that distinguishes from other objects. This study uses statistical feature methods, namely zoning and invariant moments. The zoning method has several algorithm variations. In this study, two ways, namely Image Centroid and Zone (ICZ) and Zone Centroid and Zone (ZCZ)[14] were employed for features extraction of the cracks. Four steps to determine the zoning feature using the ICZ method as follows:
-
1. Calculate the centroid of the input image, the centroid of the image is expressed as a coordinate value (xc,yc), using Equation (1) and (2).
xc
Pn
i=ι χiPi
Pn
i=ι Pi
yc =
Pn
i=ι yiPi
Pn
i=ι Pi
(1)
(2)
where xc is the centroid of the x coordinate; yc is the centroid of the y coordinate; xi is the x coordinate of the i-th pixel; yi is the y coordinate of the i-th pixel, and pi is the i-th pixel value.
-
2. Divide image input to be n same zone then calculate the distance between the centroid of the image with the coordinates of each pixel that has a value of one found in a particular zone, using Eq. (3).
d(p, c) = ∖J(xc- xp)2+ (yc- yp)2 (3)
where d is the distance between two points, p is the coordinates of the center of gravity, c is the pixel coordinate, xp is the x coordinate of gravity, yp is the y coordinate of gravity.
-
3. Repeat step 3 for all pixels in the particular zone.
-
4. Calculate the average distance between these points.
Figure 3 present the illustration of features extraction of crack images using the ICZ zoning algorithm.
Feature extractions result—
[1.0000 0.9642 0.9159]
Figure 3. Example of zoning feature extraction with centroid and zone (ICZ) image
While steps to determine the zoning feature using the ZCZ method as follows:
-
1. Divide the input image into N same zone.
-
2. Calculate the centroid of each zone with equations (1) and (2).
-
3. Calculate the distance between the centroid of the zone and each pixel in the zone with Eq. (3).
-
4. Repeat step c for all pixels in the zone.
-
5. Calculate the average distance between these points.
-
6. Repeat c-e steps for all zones in sequence.
-
7. N characteristics will be obtained for classification and recognition.
Figure 4 shows an illustration of taking features from a crack image using the ZCZ zoning calculation.
All features obtained from zoning ICZ and ZCZ algorithms combined as a vector. Another information that is included as features is shape information extracted using invariant moments. In this case, there are three processes performed to obtain the shape information of the crack image:
Pre-processing
Extraction feature result
Figure 4. Example of zoning feature extraction with centroid and zone (ICZ) image
firstly determining moments from each order of the image, secondly calculating the central moment, and finally normalizing the central moment. The each order moments (m11, m20, m02, m21, m12, m03, m30) in the discrete system are determined by using the Eq.(4)[13].
w-1 h-1
mp,q = X X xp yqf (x,y)
x=0 y=0
(4)
where h and w are the height and width of the image respectively, and p = 0,1,2 ... and q = 0,1,2 ... are integers. So using the Eq. (4) can be rewritten as Eq. (5).
w-1 h-1
mp,q = X X(x - x )p(y- y )qf (x, y) x=0 y=0
(5)
where x0 = m10∕m00 and y = mw∕m00. After getting the central moment, then the normalized central moment was determined by Eq. (6).
µp,q
q
(6)
where γ = ((p + q)/2) + 1 and μoo = moo.
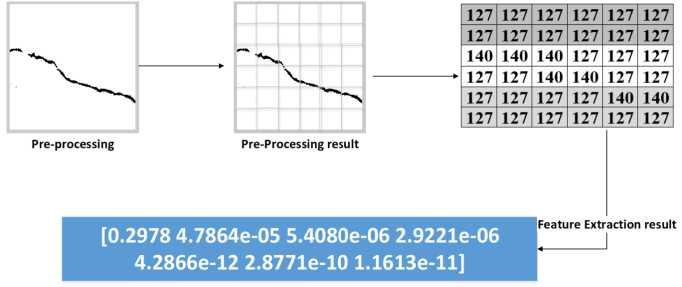
Figure 5. The illustration of moment feature extraction of input image.
Suppose there is a set of n observations X = X1, X2,. ..,Xn in p dimensional space derived from the random population. Quadratic discriminant analysis (QDA) is an alternative classifier which assumes that each class of sample data has its own covariance Σk. While the LDA classifier assumes that the sample data has a global covariance matrix (Σ) for all k classes and the X is a multivariate Gaussian distribution. The LDA function or linear score function is defined as Eq. (7)[15, 16, 17].
δk(x) = log∏k - 2μτ∑-1 + χτ∑-1 μk (7)
where πk and µk are prior probability and mean of k-th class. In LDA and QDA, the πk is defined as the class membership probabilities. It means that that given an input x is predicted to the class with the highest value of δk(x).
While the QDA classifier assigns an observation X = x to the class for which the quadratic score function is the largest using the Eq. (8)
(8)
δk(x) = log ∏k - 2 log ∣∑k| - ^(x - μk)TΣk 1 (x - μk)
Several experiments were carried out to find out the best variation of features of zoning and shape features for QDA classifier. We prepared the data for evaluation from two datasets: METU[18]and CDLE. The METU dataset consists of 40.000 standard images which were captured from structural laboratory testing under almost uniform lighting condition. The ratio between crack and noncrack images of METU dataset is 50%:50%. Fig. 6 is images samples from METU dataset. CDLE dataset is a crack image collection recorded from damage building due to Lombok earthquake in 2018. The images were captured by using a cellphone camera without capturing standardization in terms of distance of the camera to object, lighting, and camera resolution. The CDLE has 334 images which were annotated into three types of cracks: minor, moderate, and severe cracks by an expert (Pathurahman, S.T., M.T) from Civil Engineering Dept., University of Mataram. Fig. 7 presents the images samples from CDLE dataset.
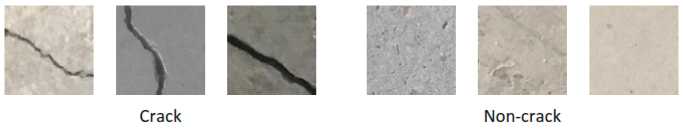
Figure 6. Images samples from METU dataset
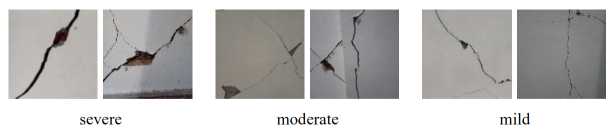
Figure 7. Images samples from CDLE dataset
The testing using METU dataset aims to evaluate our proposed scheme (zoning and shape features and QDA classifier) work properly for classifying the crack image. While the testing using CDLE dataset aims to validate whether the crack classification scheme can works correctly on non-standard building crack image due to the earthquake. Accuracy, Recall, and Precision metrics are performance evaluation parameter of the proposed methods, which are determined based on confusion matrix as given by Eq. (9, 10, and 11).
„ TP + TN
Accuracy = TP + TN + FP + FN
Recall =
TP
TP + FN
TP
Precision = ——--——
TP + FP
(9)
(10)
(11)
where:
• TP (True Positive) means the crack samples are correctly classified as crack
-
• TN (True Negative) means the non-crack samples are correctly classified as non-crack
-
• FP (True Positive) means the non-crack samples are falsely classified as crack
-
• TN (True Positive) means the crack samples are falsely classified classified as non-crack
Firstly, the proposed scheme was evaluated by using 10-fold cross-validation on the 1200 images set, which were sampled randomly from METU dataset. The images set has a balanced amount of data for crack and non-crack categories. This test was conducted to find the best combination moment invariant and zoning variation for classification crack types. Table 1 presented the experimental results, which 4-moment invariant features and 8 zoning features provided the best performances with a percentage of accuracy, precision, and recall of 89.42%; 90.16%; and 89.42%, respectively. In detail, the number of crack images was incorrectly predicted about 29 images from 180 testing images (83.5%), while the number of non-cracked data that was wrongly predicted by this scheme about 6 images out of 180 testing images (95,342%). This result could be obtained because the shape information representing by four-invariant moments (See Fig 8) have large differences between the shape information of crack and non-crack images. Therefore, explicitly four of seven moments are suitable for features of crack and non-crack. Additionally, Fig. 9 also presented that the 8 zoning features show significant differences between those of crack and non-crack. It means the combination between the shape and zoning information is good enough for features of the crack images.
Table 1. The performances of the proposed scheme on small size dataset
|
Model |
Amount of Feature |
Accuracy ' (%) |
Precision (%) |
Recall (%) |
Compilation Times | |
|
Shape |
Zoning | |||||
|
1 |
4 |
4 |
86,25 |
87,63 |
86,25 |
0,6902 |
|
2 |
4 |
8 |
89,42 |
90,16 |
89,42 |
1,1223 |
|
3 |
7 |
4 |
83,75 |
86,21 |
83,75 |
0,6900 |
|
4 |
7 |
8 |
85,17 |
87,04 |
85,17 |
1,1498 |
|
Mean |
86,15 |
87,76 |
86,15 |
0,9131 | ||
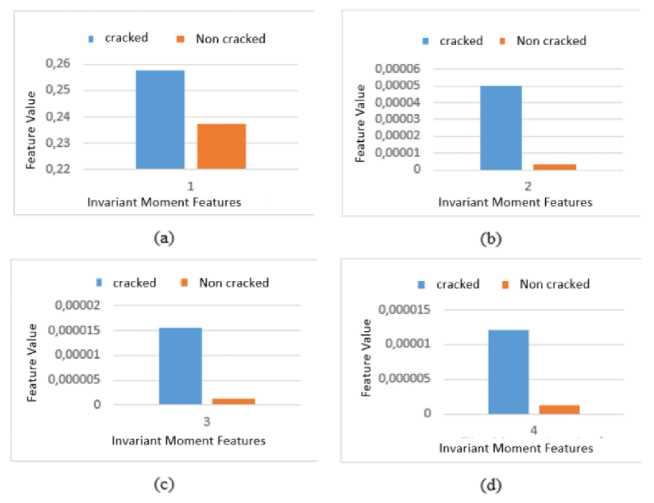
Figure 8. Comparison of crack and non-crack moment invariant features
Regarding computational time, it could be seen that there is no significant increment of computational time for each addition of features in the zoning method. It can be achieved by representing each image using small data (12 discrete values) instead of whole data pixels. In this case, the computational time was determined from the input image is given until the results of the classification results are released.
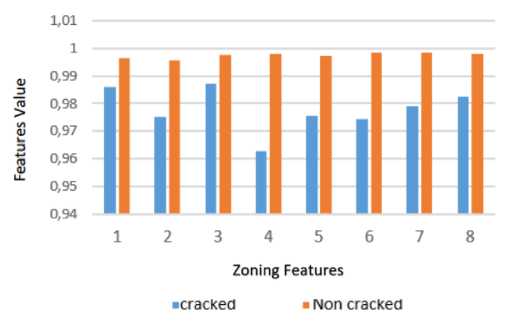
Figure 9. Comparison of crack and non-crack zoning features
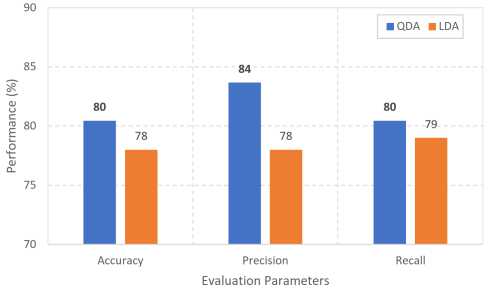
Figure 10. The performance of the proposed scheme on large size dataset (40000 images) compared to LDA
Based on the best features variation obtained in the first experiment, the second experiment was carried out to know the robustness of the proposed scheme on large size dataset (METU has 40.000 images)) and different classifiers. In the second experiments, the QDA classifier was also compared to the statistical classifiers (Linear Discriminant Analysis (LDA)[16]). Additionally, the ratio between training and testing data of METU dataset was set up 70:30% which was selected randomly. The experimental results (see Fig. 10) showed that the proposed method could work properly for large size dataset, which was in-line to the achievement of the first experiments. In detail, the proposed scheme provided more than 85% Accuracy, Precision, and Recall and it also gave a higher performance than LDA on the METU dataset. It means the experimental results reconfirmed that the proposed scheme (a combination of moment invariant and zoning features, as well as QDA classifier) could work properly on crack classification especially a large variety of crack and non-crack images.
The last experiment was conducted on CDLE dataset to classify real crack image due to Lombok Earthquake into three classes, namely minor, moderate, and severe. The best feature variation (4
moment invariant and 8 zoning), which were found in the first and second tests were implemented to determine the damage level of the crack image due to Lombok Earthquake. The data used in this test is 334 damaged images by the earthquake in Lombok, West Nusa Tenggara, which the ratio between training and testing images were set at 90%:10%, that was commonly used for small size data. The experimental results showed that the combination of our proposed features and QDA classifier did not give high enough accuracy by about 39.39%. It can be caused by large variability of CDLE dataset which was taken by different cameras, lighting condition, capturing distance, direction, and backgrounds. The same examples images which failed to classify are given in Figure 11(b). Even the human-vision is hard to the type of crack from the images in the Figure 11(b).
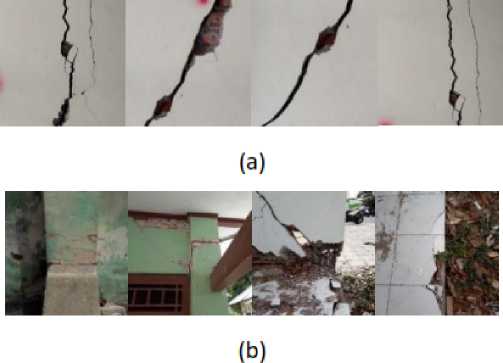
Figure 11. crack images (a)correctly and (b)falsely classified by our scheme
Based on this problem, only 82 standard images of 334 images were manually selected based on image sharpness, and the annotation results from an expert for the next experiments. Similar to the previous experiment, the ratio between training and testing images were set up 90%:10%. By using the same variety of features (4-moment invariant features and 8 zoning features) and QDA classifier, the accuracy increases significantly almost 49.5% (form 39.39% to be 88.89%). Therefore, the standardization of data input is the most essential part of crack image classification which must be considered for next works.
Based on the experimental results and discussion, it can be concluded as follows: firstly, the zoning and moment invariant method is a appropriate combination of feature extraction methods for determining the level of damage to buildings; secondly, the best combination of moment invariant and zoning features which obtain a high enough of accuracy (89.42%) is a combination of 4 features for moment invariant and 8 features for zoning; thirdly, the QDA classifier is better than LDA classifier for crack image classification; and the rest standardization of data is very influential in the process of training and classification, which is able to increase about 49.5% of accuracy when Standardization of data was given.
The achievements of the proposed scheme must be improved and developed in further research, including: training data must be updated/added for getting robust performances, data must be standardized by image pre-processing techniques, employing another classifier for increasing the accuracy.
Acknowledgements
The paper is part of a funded by the Ministry of Research, Technology and Higher Education of the Republic of Indonesia under the scheme basic research and contract no:182/SP2H/LT/DRPM/2019.
We also thank the expert system laboratory staff for hardware supporting and useful discussion.
References
-
[1] W. Nuswantoro, “Analisis jenis kerusakan pada bangunan perumahan (studi kasus pada perumahan pondok pasir mas palangka raya),” Jurnal Rekayasa Bangunan, vol. 11, no. 1, pp. 1–14, 2010.
-
[2] S. N. Sheerin, S. Kavitha, and G. Raghuraman, “Review and analysis of crack detection and classification techniques based on crack types,” International Journal of Applied Engineering Research, vol. 13, no. 8, pp. 6056–6062, 2018.
-
[3] A. Mohan and S. Poobal, “Crack detection using image processing: A critical review and analysis,” Alexandria Engineering Journal, vol. 57, no. 2, pp. 787–798, 2018.
-
[4] E. Hussain, A. Hannan, and K. Kashyap, “A zoning based feature extraction method for recognition of handwritten assamese characters,” International Journal of Computer Science and Technology, vol. 6, 01 2015.
-
[5] F. Camastra, “Handwritten greek character recognition with learning vector quantization,” in International Conference on Knowledge-Based and Intelligent Information and Engineering Systems. Springer, 2007, pp. 267–274.
-
[6] G. A. Abandah, K. S. Younis, and M. Z. Khedher, “Handwritten arabic character recognition using multiple classifiers based on letter form,” in Proceedings of the Fifth IASTED International Conference on Signal Processing, Pattern Recognition and Applications, ser. SPPRA ’08. Anaheim, CA, USA: ACTA Press, 2008, pp. 128–133. [Online]. Available: http://dl.acm.org/citation.cfm?id=1722683.1722710
-
[7] P. Prasanna, K. J. Dana, N. Gucunski, B. B. Basily, H. M. La, R. S. Lim, and H. Parvardeh, “Automated crack detection on concrete bridges,” IEEE Transactions on Automation Science and Engineering, vol. 13, no. 2, pp. 591–599, April 2016.
-
[8] Y. Shi, L. Cui, Z. Qi, F. Meng, and Z. Chen, “Automatic road crack detection using random structured forests,” IEEE Transactions on Intelligent Transportation Systems, vol. 17, no. 12, pp. 3434–3445, Dec 2016.
-
[9] A. R. Rizvi, P. R. Khan, and S. Ahmad, “Crack detection in railway track using image processing,” International Journal of Advance Research, Ideas and Innovations in Technology, vol. 3, no. 4, pp. 489–496, 2017.
-
[10] S. Kabir, “Imaging-based detection of aar induced map-crack damage in concrete structure,” NDT & E International, vol. 43, no. 6, pp. 461–469, 2010.
-
[11] S. Kabir, P. Rivard, G. Ballivy, and D.-C. He, “Textural analysis for crack-detection using infrared thermography, visual colour, and greyscale concrete imagery,” in Joint International Conference on Computing and Decision Making in Civil and Building Engineering, 06 2006, pp. 14–16.
-
[12] L. Zhang, F. Yang, Y. D. Zhang, and Y. J. Zhu, “Road crack detection using deep convolutional neural network,” in 2016 IEEE international conference on image processing (ICIP). IEEE, 2016, pp. 3708–3712.
-
[13] R. C. Gonzalez and R. E. Woods, Digital Image Processing (3Rd Edition). Prentice Hall, August, 2007.
-
[14] T. Zuraiyah, A. Qur’ania, and C. R Pitoyo, “Optimization of feature extraction using combined image centroid zone and zone centroid zone method,” in IORA International Conference on Operation Research, 09 2016.
-
[15] R. O. Duda, P. E. Hart, and D. G. Stork, Pattern Classification (2Nd Edition). New York, NY, USA: Wiley-Interscience, 2001.
-
[16] A. Tharwat, “Linear vs. quadratic discriminant analysis classifier: a tutorial,” International Journal of Applied Pattern Recognition, vol. 3, no. 2, pp. 145–180, 2016.
-
[17] X. Sicotte, “Linear and quadratic discriminant analysis,” 2018. [Online]. Available: https://xavierbourretsicotte.github.io/LDA_QDA.html
-
[18] Çag˘ lar Fırat Özgenel, “Concrete Crack Images for Classification,” 2018. [Online]. Available: http://dx.doi.org/10.17632/5y9wdsg2zt.1
168
Discussion and feedback