Electrical Daily Load Forecasting In Ramadhan Using Type-2 Fuzzy Logic In Sulselrabar System
on
LONTAR KOMPUTER VOL. 9, NO. 3 DECEMBER 2018
DOI : 10.24843/LKJITI.2018.v09.i03.p04
Accredited B by RISTEKDIKTI Decree No. 51/E/KPT/2017
p-ISSN 2088-1541
e-ISSN 2541-5832
Electrical Daily Load Forecasting In Ramadhan Using Type-2 Fuzzy Logic In Sulselrabar System
Marhatanga1, Muhammad Ruswandi Djalala2, Herman Nauwira3, Sononga4
aEnergy Engineering, State Polytechnic of Ujung Pandang
Jalan Perintis Kemerdekaan km.10, Makassar
E-mail : 1marhatang@gmail.com, 2wandi@poliupg.ac.id, 3hermannauwir@poliupg.ac.id,
Abstract
This study discusses the daily electricity load forecasting 24 hours on 150 kV electric power systems sulselrabar. Forecasting electrical load requires the accuracy of the results with a small error. Peak load forecasting methods used to use smart methods Interval Type-1 Fuzzy Logic (IT1FL) and Interval Type-2 Fuzzy Logic (IT2FL) to predict the needs of the electrical load 1 Ramadan 2016. As input data, it was used load data from 2012 through 2016 for the same day each 1st of Ramadhan each year, and as comparative data, it was used actual load data 1, 2016. For the Ramadhan input variable, it was used two of the data Variation Load Difference (VLD Max) 2015 as an input variable X, VLD Max 2016 as an input variable Y. From the simulation results obtained highly accurate results where each method produces a very small error, where for methods of using IT1FL of 1.607778264% while using IT2FL by, 1.344510913%.
Keywords: Type-1 Fuzzy Logic, Type-2 Fuzzy Logic, MAPE, Load Forecasting
Electric load forecasting is an important part of power system operation in order to achieve optimal planning in operation of the systems [1]. Load forecasting is covering short-term, medium-term and long-term load forecasting. Short-term load forecasting is required for controlling and scheduling the operation of power systems [2]. Medium and long-term load forecasting is required for maintenance, fuel purchases, plant development and planning of future distributions. Accurate load forecasting has a significant impact on the operation and production costs of electric utilities [3]. Research on load forecasting has spawned numerous papers and journals [4]. These publications have led to the development of various methods of forecasting. This method is classified into two categories: The classical approach (conventional method) and an artificial intelligence method.
The classical approach is based on statistical methods, which cannot accurately represent the complex nonlinear relationship between the load and a series of factors such as daily and weekly rhythms of time that can lead to high error in load forecasting [4]. Artificial intelligence method has the ability to provide better performance when dealing with nonlinear data. The advantages of artificial intelligence method compared to conventional method are computational technique and simple algorithm, structural simplicity and high accuracy performance without having to solve any nonlinear equations into mathematical equations. Therefore, the author in this research discusses the hybrid method in the load forecasting, which is a suggestion of earlier researchers. Thus the method of interval type 2 fuzzy inference system is used in this research. Interval type-2 fuzzy inference system (IT2FIS) becomes a concern for short-term load forecasting because it has a simple concept and high-performance identification.
IT2FIS is the formulation and mapping process from input to output using interval type 2 fuzzy logic [5-9]. One of the advantages of fuzzy logic is the knowledge and experience of experts can be easily used and applied. Interval Type-1 Fuzzy Logic and Interval Type-2 Fuzzy Logic is used in this research for load forecasting in Sulawesi Selatan, Tenggara dan Barat (Sulselrabar) system especially for 1 Ramadhan 2016. In the proposed method, we do not take environmental
factors as variable. The Sulselrabar electrical system is used because, this system has been growing, and requires further study on load forecasting. Several previous studies have been conducted and show satisfactory results [9-21].
The implementation of IT2FL for peak load forecasting on 1 Ramadhan 2016 is done by using three stages, namely the preparation stage (pre-processing), processing stage and final stage (post-processing) [4].
Preparation stage is the preparation of peak load data on 24 hours to look for load difference (LD), typical load difference (TLD), maximum weekdays (max WD) and variation load difference (VLD). Load difference (LD) for maximum load is a load difference within 4 days before the days which is given by [22]:
LDMAX (i) =
MaxSD (i) - MaxWD (i)
MaxWD (i) x
MaxWD. .= (i)
WD,.,, ++ WD,.,, +WWD,,,, +WWD,,,, ,
(i) d - 4 (i) d - 3 (i) d - 2 (i) d -1
4
(1)
(2)
MaxSD (i) is the peak load on a special day and maxWD is the average of maximum load 4 days before the days. Then, looking for a distinctive characteristic of a typical peak load or typical load difference (TLDMAX (i)) by averaging the peak load of similar LDMAX (i) in previous years. After that, calculating the variation load difference, which is the difference between Load Difference (LD) and Typical Load Difference (TLDMAX (i)) which can be seen by the following equation:
(3)
VLD (i) = LD (i)-TLD (i) max V J max V y max V S
JLD (0 = max V /
LDmx( i-1)+LDmax (i - 2)+LD i - 3)
(4)
3
Peak load data which is used to calculate Max WD and LD max is based on (1) and (2) equations respectively and the results are presented in Table 1 and 2.
Table 1. Peak Load In 2016
|
WD(i)d-4 |
WD(i)d-3 |
WD(i)d-2 |
WD(i)d-1 |
MaxSD(i) |
|
577.96 |
536.22 |
583.10 |
589.64 |
609.70 |
|
562.64 |
513.60 |
560.86 |
563.12 |
606.52 |
|
537.60 |
497.91 |
527.11 |
541.81 |
615.86 |
|
517.76 |
498.68 |
516.53 |
533.25 |
641.13 |
|
526.03 |
489.66 |
525.30 |
546.27 |
596.93 |
|
539.42 |
528.80 |
550.95 |
571.02 |
591.33 |
|
536.83 |
529.59 |
558.15 |
567.28 |
520.18 |
|
559.59 |
573.80 |
584.02 |
595.88 |
574.02 |
|
599.36 |
617.64 |
634.73 |
649.16 |
627.04 |
|
587.65 |
655.20 |
658.25 |
692.32 |
657.29 |
|
614.61 |
689.41 |
682.15 |
686.51 |
656.71 |
|
614.24 |
689.49 |
675.38 |
682.78 |
659.18 |
|
611.61 |
683.15 |
663.73 |
694.33 |
664.00 |
|
612.52 |
704.85 |
692.95 |
710.65 |
675.02 |
|
608.56 |
698.42 |
676.79 |
691.70 |
691.70 |
|
614.76 |
681.74 |
661.68 |
701.46 |
695.61 |
|
603.86 |
651.71 |
661.77 |
677.62 |
695.79 |
|
723.27 |
754.12 |
783.38 |
741.25 |
770.25 |
|
816.40 |
836.67 |
842.27 |
853.60 |
856.00 |
|
801.50 |
821.69 |
791.02 |
815.15 |
812.24 |
|
767.76 |
792.92 |
772.03 |
817.63 |
793.92 |
|
700.07 |
733.94 |
705.36 |
782.02 |
759.78 |
|
636.80 |
662.42 |
663.73 |
769.47 |
694.37 |
|
580.44 |
610.82 |
615.25 |
680.07 |
628.03 |
Fuzzyfication design of X and Y input is using IT2MF Editor. There are 11 membership functions is used [23], namely :
-
• Negative Very Big (NVB), range : [-48 -48 -40 -32.5 -48 -48 -40 -28.5 -48]
-
• Negative Big (NB), range : [-40.5 -32 -24.5 -36.5 -32 -20.5]
-
• Negative Medium (NM), range : [-32.5 -24 -16.5 -28.5 -24 -12.5]
-
• Negative Small (NS), range : [-24.5 -16 -8.5 -20.5 -16 -4.5]
-
• Negative Very Small (NVS), range : [-16.5 -8 -2.5 -12.5 -8 2.5]
-
• Zero (ZE), range : [-8.5 0 4.5 -4.5 0 8.5]
-
• Positive Very Small (PVS), range : [-2.5 8 12.5 2.5 8 16.5]
-
• Positive Small (PS), range : [4.5 16 20.5 8.5 16 24.5]
-
• Positive Medium (PM), range : [12.5 24 28.5 16.5 24 32.5]
-
• Positive Big (PB), range : [20.5 32 36.5 24.5 32 40.5]
-
• Positive Very Big (PVB), range : [28.5 40 48 48 32.5 40 48 48 48]
Examples of fuzzy rules can be seen in Table 2.
Table 2. Fuzzy Rules
|
No. Rules |
Antecedent |
Consequent Z | |
|
X |
Y | ||
|
1 |
NM |
PS |
PS |
|
2 |
PVB |
NS |
PVB |
|
3 |
NM |
PM |
PM |
|
4 |
NM |
PB |
PB |
|
5 |
NS |
PM |
PM |
|
6 |
NS |
PS |
PS |
|
7 |
NM |
ZE |
ZE |
|
8 |
NM |
PVS |
PVS |
|
9 |
NVB |
ZE |
ZE |
|
10 |
NVB |
ZE |
ZE |
|
11 |
NVB |
NVS |
NVS |
|
12 |
NVB |
ZE |
ZE |
|
13 |
NVB |
ZE |
ZE |
|
14 |
NVB |
ZE |
ZE |
|
15 |
NVB |
PVS |
PVS |
|
16 |
NVB |
PVS |
PVS |
|
17 |
NM |
PS |
PS |
|
18 |
NM |
PVS |
PVS |
|
19 |
NS |
PVS |
PVS |
|
20 |
NS |
PVS |
PVS |
|
21 |
NS |
PVS |
PVS |
|
22 |
NS |
PVS |
PVS |
|
23 |
NS |
ZE |
ZE |
|
24 |
ZE |
ZE |
ZE |
After getting VLDMAX forecasting value, then forecast load difference:
Forecast LDmax (i) = Forecast VLDmax (i) + TLDmax (i) (5)
Peak load forecasting can be calculated:
Pmax (i) = MaxWD (i) +
(ForecastLDMAXxMax WD (i))
100
(6)
The smaller error obtained show the accuracy of the proposed method is higher. The absolute error can be expressed as follows:
Error =
forecast actual
P , actual
x100%
Error =
P' MAX (i) - MaxSD(i) MaxSD (i)
x100%
(7)
(8)
The research flowchart is shown in the following figure.
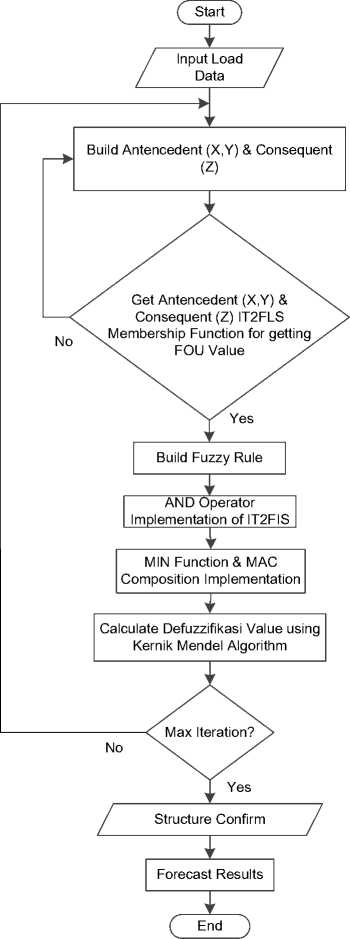
Figure 1. Flowchart IT2FL for Daily Peak Load Forecasting
The fuzzy type-2 set is a development of fuzzy type-1 which is re-defuzzy. The Fuzzy type-1 based-knowledge logic system is used to build the rules in an uncertainty fuzzy logic system (FLS). There are three reasons for uncertainty rules [6] :
-
1 Rules of antecedents and consequents can have different perception in different people.
-
2 Polling of group of experts on consequents is often different to the same rules as most experts do not agree on the rule.
-
3 The training data contains a lot of noise.
Type-2 fuzzy sets have their own membership levels are fuzzy. Rankings on type-2 fuzzy set can be on the subset of secondary membership. Similar with FLS Type-1, FLS Type-2 is also included FIS membership functions and defuzzification. The difference is that before the defuzzification process there is type reduction process which has several methods; one of them is Kernik Mendel Algorithm (KMA). Interval Type-2 Fuzzy Logic (IT2FL) structure can be seen in Figure 2. Figure 2 shows the process of IT2FL from an input value of crisp x set into the output value of Y=f(x) equation.
Input Crisp Output Crisp
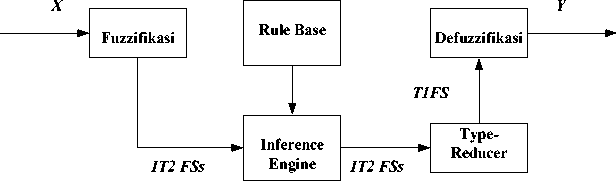
Figure 2. Type-2 Fuzzy Logic System (T2FLS) Structure
An interval type-2 fuzzy set (IT2FS) is denoted à by the membership function with ∈
and ∈ ⊆ [0,1], its characteristic can be recognized on the following equation:
a%=r r μ⅛u)Jx⊆[0.1] (9)
x ∈ Xjx ∈ Jx ( % ^ U ^
x is a primary variable; ∈ , secondary variable, have domain for each ∈ ; is primary membership. Uncertainty of is the combination primary membership (footprint of uncertainty). The equation can be seen as follows:
FOU (A%) = U Jχ = {(χ, u); u ∈ Jχ ⊆ [0,i]}
Vx ∈ X
Jx is an interval with the following equation:
From equation 2.5 FOU ( ) can be expressed by the equation:
Vx ∈ X
Where:
= Primary membership of
= Lower Membership Function (LMF) af
= Upper Membership Function (UMF)of
u
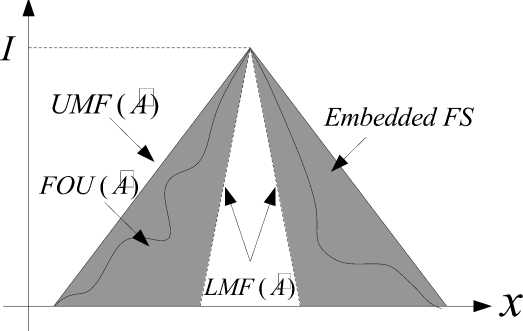
Figure 3. FOU (dark color), LMF (dotted line), UMF (solid line) and Embedded FS (wavy line).
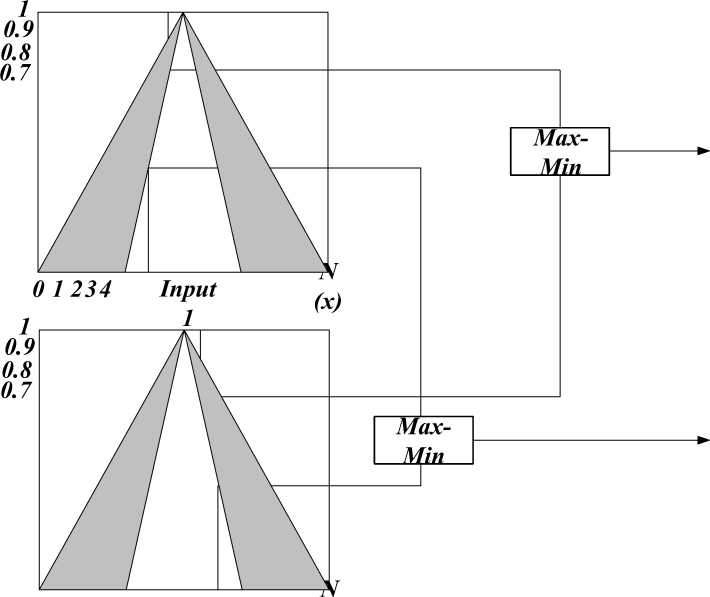
Operation on fuzzy interval type-2 set is almost the same as fuzzy type-1 set; but on the IT2FL logic system, the operation is performed on two intervals that are UMF (top) and LMF (below) at once. Operation on fuzzy interval type-2 membership function can be seen in Figure 4:
0 1 234 Output 1
(x)
Figure 4. Operation fuzzy set interval type-2 (IT2FL)
PLTD
PLTD PLTD PLTA
Smnsa
Arena Mateko Tmanipi
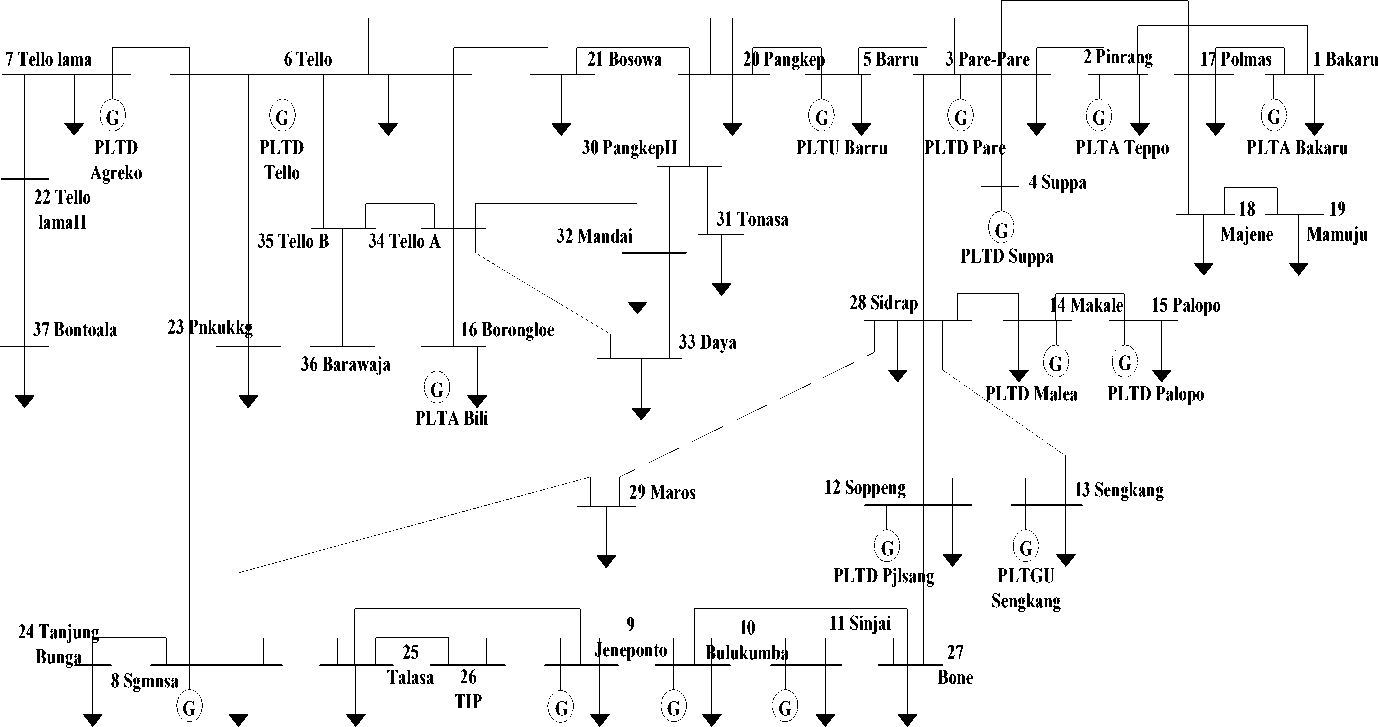
Figure 5. Sulselrabar System [10]
Table 3. Establishment Of Rule Base For Input X in 1st Ramadhan 2016
|
Hours |
Membership Function (μ) Set of Variable VLD max NB NM PVS PS X |
|
01.00 |
X -13.53477757 0.383694394 0.616305606 NM Y 7.837201199 0.0406997 0.9593003 PS Z 7.837201199 0.0406997 0.9593003 PS |
Table 4. Result Of Variable Calculations X, Y, Z on 1st Ramadhan 2016
|
Hours |
Input Set X Y Z X Y Z |
|
1:00 2:00 3:00 4:00 5:00 6:00 7:00 8:00 9:00 10:00 11:00 12:00 13:00 14:00 15:00 16:00 17:00 18:00 19:00 20:00 21:00 22:00 23:00 0:00 |
38.15805202 -8.455067268 -8.455067268 PVB NS NS
1.060461042 1.539682191 1.539682191 ZE ZE ZE |
Antecedent (X, Y) and consequent (Z) T2FIS figures as follows:

Figure 6. Design System
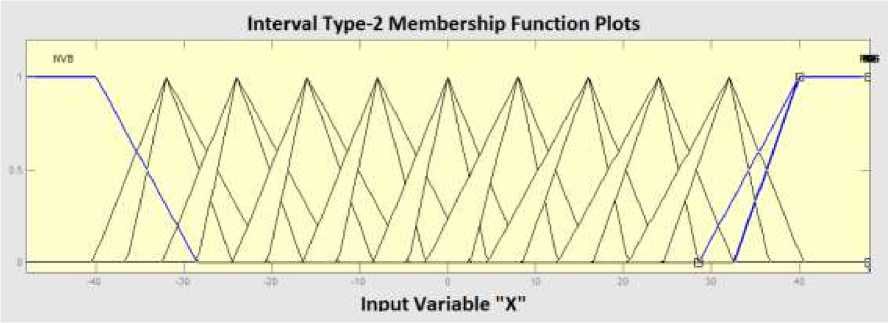
Figure 7. X,Y Input Design
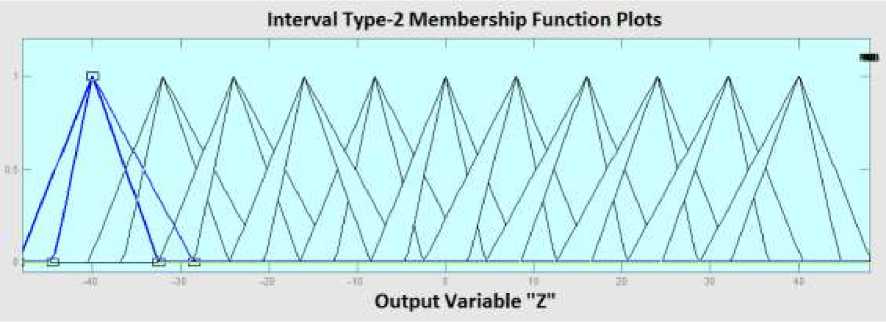
Figure 8. Z Output Design
The calculation of the input variable value X, Y, Z is to find the value of Load Difference Variable (VLDMAX) by first calculating WD Max, LD Max, TLDmax each input data of 2012-2015, which is calculated based on equation 1-4. The results of the calculation of variables X, Y, Z can be seen in table 3 above.
Figure 5 shows the single line diagram of the sulselrabar system, where there are 37 Buses, each serving load centers in the sulselrabar system. Table 3 shows an example of the calculation of the membership function fuzzy logic for 01.00 hours, and Table 4 shows the complete result of the membership function calculation.
Figure 6-8 shows the membership design function type-2 fuzzy logic using Matlab. Where each uses 11 membership functions. While the image forecasting results shown in graphs 8 and 9. Graph 8 is the result of load forecasting and graph 9 is the error of forecasting results with the method of comparison of type-1 fuzzy logic.
The data used is the peak load data of Sulselrabar electricity system started in 2012-2015 by using Interval Type-1 Fuzzy Logic method and Interval Type-2 Fuzzy Logic (IT2FL) as a comparison. Then, the data is devoted to four days before and during 1 Ramadhan 2016.
The test results by using the IT2 method as a proposed method for load forecasting showed excellent results, in which the Mean Absolute Percentage Error (MAPE) of VLDMAX is 1.344510913%. By using IT1FL, MAPE is 1.607778264%. For complete results can be seen in figure 9-10.
Load Perocaet UalngInterval Typod Porocaet VLD Ua∣∏o Morval Tvpo-2
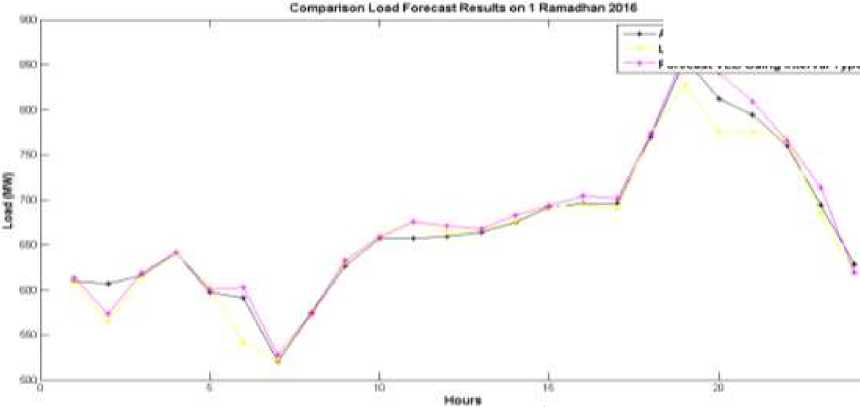
Figure 9. Results of Load Forecast for 1st Ramadhan in 2016
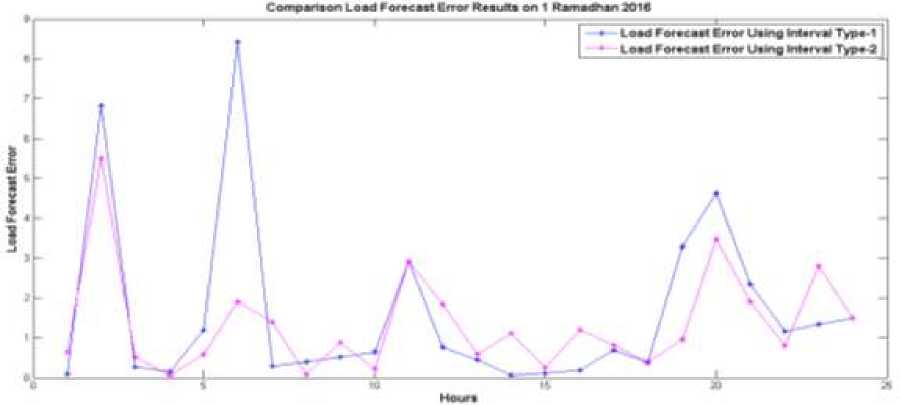
Figure 10. Results of Load Forecasting Error on 1st Ramadhan in 2016
Electrical Load Forecasting Day on the 1st of Ramadhan using intelligent methods based on Fuzzy Logic obtained very satisfactory results, with a very small error, this method is best used for short-term forecasting, medium and long-term. Error using Fuzzy Logic Type-2 of 1.607778264%, while using the proposed method Interval Type-2 Fuzzy Logic error is getting smaller in the amount of 1.344510913%. The application of intelligent methods for optimization of load forecasting is also highly recommended for yan forecasting methods used by PT. Perusahaan Listrik Negara (PLN) also still produce a sizable error.
References
-
[1] A. Srivastava, A. S. Pandey, and D. Singh, "Short-term load forecasting methods: A
review," in Emerging Trends in Electrical Electronics & Sustainable Energy Systems (ICETEESES), International Conference on, 2016, pp. 130-138.
-
[2] A. Jain, E. Srinivas, and S. kumar Kukkadapu, "Fuzzy based day ahead prediction of
electric load using mahalanobis distance," in Power System Technology (POWERCON), 2010 International Conference on, 2010, pp. 1-6.
-
[3] S. K. Panda, S. N. Mohanty, and A. K. Jagadev, "Long Term Electrical Load
Forecasting: An Empirical Study across Techniques and Domains," Indian Journal of Science and Technology, vol. 10, 2017.
-
[4] A. Ramadhani, Agus Dharma, & Imam Robandi, "Optimization FOU of Interval Type-2
Fuzzy Inference System Using Big Bang – Big Crunch Algorithm for Short Term Load Forecasting on National Holiday Case Study: South and Central Kalimantan-Indonesia," International Review of Electrical Engineering (IREE), vol. 10, pp. 123-130, 2015.
-
[5] A. Khosravi and S. Nahavandi, "Load forecasting using interval type-2 fuzzy logic
systems: Optimal type reduction," IEEE Transactions on Industrial Informatics, vol. 10, pp. 1055-1063, 2014.
-
[6] J. Zhao and L. Jiang, "Forecasting Of Type-2 Fuzzy Electric Power System Based On
Phase Space Reconstruction Model," network security, vol. 8, 2015.
-
[7] S. Hassan, A. Khosravi, J. Jaafar, and M. A. Khanesar, "Hybrid model for the training of
interval type-2 fuzzy logic system," in International Conference on Neural Information Processing, 2015, pp. 644-653.
-
[8] E. Kayacan, S. Coupland, R. John, and M. A. Khanesar, "Elliptic membership functions
and the modeling uncertainty in type-2 fuzzy logic systems as applied to time series prediction," in Fuzzy Systems (FUZZ-IEEE), 2017 IEEE International Conference on, 2017, pp. 1-7.
-
[9] S. Hassan, A. Khosravi, and J. Jaafar, "Training of interval type-2 fuzzy logic system
using extreme learning machine for load forecasting," in Proceedings of the 9th International Conference on Ubiquitous Information Management and Communication, 2015, p. 87.
-
[10] M. Y. Yunus, M. R. Djalal, and Marhatang, "Optimal Design Power System Stabilizer
Using Firefly Algorithm in Interconnected 150 kV Sulselrabar System, Indonesia," International Review of Electrical Engineering (IREE), vol. 12, pp. 250-259, 2017.
-
[11] M. R. Djalal, D. Ajiatmo, A. Imran, and I. Robandi, "Desain Optimal Kontroler PID Motor
DC Menggunakan Cuckoo Search Algorithm," SENTIA 2015, vol. 7, 2015.
-
[12] M. R. Djalal, A. Imran, and I. Robandi, "Optimal placement and tuning power system
stabilizer using Participation Factor and Imperialist Competitive Algorithm in 150 kV South of Sulawesi system," in Intelligent Technology and Its Applications (ISITIA), 2015 International Seminar on, 2015, pp. 147-152.
-
[13] M. R. Djalal, H. Nawir, H. Setiadi, and A. Imran, "An Approach Transient Stability
Analysis Using Equivalent Impedance Modified in 150 kV South of Sulawesi System," Journal of Electrical and Electronics Engineering UMSIDA, vol. 1, pp. 1-7, 2016.
-
[14] M. R. Djalal, H. Setiadi, D. Lastomo, and M. Y. Yunus, "Modal Analysis and Stability
Enhancement of 150 kV Sulselrabar Electrical System using PSS and RFB based on Cuckoo Search Algorithm," International Journal on Electrical Engineering and Informatics, vol. 9, pp. 800-812, 2017.
-
[15] M. R. Djalal, M. Y. Yunus, H. Setiadi, and A. U. Krismanto, "Small-Signal-Stability
Enhancement using a Power-System Stabilizer based on the Cuckoo-Search Algorithm against Contingency N-1 in the Sulselrabar 150-kV System," Makara Journal of Technology, vol. 22, pp. 1-8, 2018.
-
[16] M. R. Djalal, M. Y. Yunus, H. Nawir, and A. Imran, "Optimal Design of Power System
Stabilizer In Bakaru Power Plant Using Bat Algorithm," 2017, vol. 1, p. 6, 2017-11-10 2017.
-
[17] U. Umoh, I. Umoeka, M. Ntekop, and E. Babalola, "INTERVAL TYPE-2 FUZZY
NEURAL NETWORKS FOR SHORT-TERM ELECTRIC LOAD FORECASTING: A COMPARATIVE STUDY."
-
[18] N. Ammar, M. Sulaiman, and A. F. M. Nor, "Analysis Load Forecasting of Power
System Using of Fuzzy Logic and Artificial Neural Network," Journal of Telecommunication, Electronic and Computer Engineering (JTEC), vol. 9, pp. 181-192, 2017.
-
[19] D. Ali, M. Yohanna, P. M. Ijasini, and M. B. Garkida, "Application of fuzzy–Neuro to
model weather parameter variability impacts on electrical load based on long-term forecasting," Alexandria Engineering Journal, 2017.
-
[20] D. Ali, M. Yohanna, P. M. Ijasini, and M. B. Garkida, "Application of fuzzy–Neuro to
model weather parameter variability impacts on electrical load based on long-term forecasting," Alexandria engineering journal, vol. 57, pp. 223-233, 2018.
-
[21] A. T. Ali, E. B. Tayeb, and Z. M. Shamseldin, "Short term Electrical Load Forecasting Using Fuzzy Logic," International Journal Of Advancement In Engineering Technology, Management and Applied Science (IJAETMAS), vol. 3, 2016.
-
[22] F. Tuaimah, "Iraqi Short Term Electrical Load Forecasting Based On Interval Type-2
Fuzzy Logic," World Academy of Science, Engineering and Technology, International Science Index 92, International Journal of Electrical, Computer, Energetic, Electronic and Communication Engineering, vol. 8, pp. 1255 - 1261, 2014.
-
[23] M. R. Djalal and Faisal, "Intelligent Fuzzy Logic-Cuckoo Search Algorithm Method for
Short-Term Electric Load Forecasting in 150 kV Sulselrabar System," Lontar Komputer: Jurnal Ilmiah Teknologi Informasi, vol. 8, pp. 154-165, 2017.
157
Discussion and feedback