DATA MINING USING FUZZY METHOD FOR CUSTOMER RELATIONSHIP MANAGEMENT IN RETAIL INDUSTRY
on
LONTAR KOMPUTERVOL. 4, NO. 1, APRIL 2013
ISSN: 2088-1541
DATA MINING USING FUZZY METHOD FOR CUSTOMER RELATIONSHIP MANAGEMENT IN RETAIL INDUSTRY
Yohana Nugraheni
STIKOM, Bali, Indonesia e-mail: yohana_biz@yahoo.com
Abstrak
Masalah yang umum muncul dalam industri retail adalah bagaimana mengidentifikasi pelanggan potensial. Sebuah industri retail dapat mengidentifikasi pelanggan terbaiknya melalui segmentasi pelanggan dengan menerapakan teknologi data mining dan konsep customer relationship management (CRM). Paper ini memperlihatkan proses data mining dari data pelanggan dalam perusahaan retail dengan mengkombinasikan algoritma fuzzy RFM dengan fuzzy c-means (FCM) dan algoritma fuzzy subtractive. Data yang digunakan dalam riset terdiri dari 3.000.000 baris data transaksi dari tahun 2006 sampai 2010. Data ini ditransfer ke 499 RFM data untuk masing-masing periode waktu.Penelitian ini menguji dua sampai enam cluster dengan mengubah nilai nomer cluster (FCM) dan radii (fuzzy subtractive). Hasil clustering kemudian akan dikelompokkan untuk menentukan segmentasi pelanggan menggunakan model fuzzy RFM. Modified partition coefficient dan partition entropy index digunakan untuk mengevaluasi unjuk kerja kedua algoritma diatas.Hasil yang didapat dari penelitian ini ternyata FCM mempunyai tingkat validitas yang lebih baik daripada fuzzy subtractive. Hasil segmentasi Fuzzy RFM memperlihatkan bahwa fuzzy subtractive tidak dapat membentuk sebuah cluster yang dikelompokkan sebagai pelanggan potensial, oleh karena itu FCM lebih sesuai digunakan untuk segmentasi pelanggan di industri retail.
Kata kunci: fuzzy RFM model,fuzzy c-means, fuzzy subtractive, modified partition coefficient, partition entropy
Abstract
A problem that appears in a retail industry with a great quantity of customers is how to identify potential customers. A retail industry could identify their best customer through customer segmentation by applying data miningand customer relationship managementconcept. This paper presents data mining process from customer's data in retail company by combining fuzzy RFM model with fuzzy c-meansand fuzzy subtractive algorithm. The dataconsisted of 3.000.000 rows of transaction data from 2006 to 2010. The data transferred to 499 RFM data for each time period selected. Experiments tried two to six clusters by changing the value of cluster number (FCM) and radii(fuzzy subtractive). The clustering result will then be classified to determine customer segmentation using fuzzy RFM models. The modified partition coefficient and partition entropy indexes used to evaluate the performance of both clustering algorithm.The results indicate that FCM has a higher validity rate than fuzzy subtractive. Fuzzy RFM segmentationindicates that fuzzy subtractive can not form a cluster that are categorized as potential customers, therefore FCM is more appropriate for customer segmentation in retail industry.
Keywords: fuzzy RFM model,fuzzy c-means, fuzzy subtractive, modified partition coefficient, partition entropy
In the midst of a tight business competition nowadays, retail companies have shifted their attention from simply developing products and superior service to the creation of personal
experiences of customer. This is done with a full awareness that the relationship between companies and customer is essential to support the development and sustainability of the company [1]. According to the Pareto law (the law 80:20), only 20% of all customers represent 80% of corporate revenue. In this case, different customers represent different values.The management of retail companies should be able to recognize the best customer and increasing the company’s understanding of customers’ needs as individual to maintain customer value, satisfaction and loyalty.
Customer relationship management (CRM) has grown in recent decades to reflect the primary role of the consumer for setting corporate strategy. CRM is the strategy for building, managing, and strengthening loyal and long-lasting customer relationships. CRM should be a customercentric approach based on customer insight. Its scope should be the ‘‘personalized’’ handling of customers as distinct entities through the identification and understanding of their differentiated needs, preferences, and behaviors [1]. To succeed with CRM and address theafore mentioned objectives, organizations need to gain insight into customers, their needs, and wants through data analysis. This is where analytical CRM comes in. Analytical CRM is concerned with capturing, storing, extracting, integrating, processing, interpreting, distributing, using and reporting customer-related data to enhance both customer and company value [3]. Analytical CRM builds on the foundation of customer-related information. Customer-related data may be found in enterprise-wide repositories: sales data (purchase history), financial data (payment history, credit score), marketing data (campaign response, loyalty scheme data) and service data. With the application of data mining technology, a company can then interrogate these data for customer identification by segmenting customer [2]. Data mining aims to extract knowledge and insight through the analysis of large amounts of data using sophisticated modeling techniques. It converts data into knowledge and actionable information. The purpose of customer segmentation process is to provide an assessment of the customers (customer scoring) and determines profile of the customer [2], so a company can determine customer behavior and implement appropriate marketing strategies to maximize profit for the company.
Analysis of data mining in relation to explore the customer segmentation process has been done in many researches. Various algorithms and methods i.e k-means, k-medoids, fuzzy c-means, Gustafson Kessel dan Gath Geva Clustering algorithm [4],self organizingmap (SOM), decision tree, and Markov Chain Model [5]. Many research related to the RFM model also has been done a lot e.g. by combining RFM theory with k-means and rough set theory to segment customers in an electronics company [6], and also combining the use of RFM and bandwidth usage with k-means to determine the customer segmentation in a telecommunication company [7]. There is no data mining tools for CRM that works perfectly, therefore this paper is worth to explore combination of fuzzy RFM model with FCM and Fuzzy subtractive algorithm.
-
2. Methodology
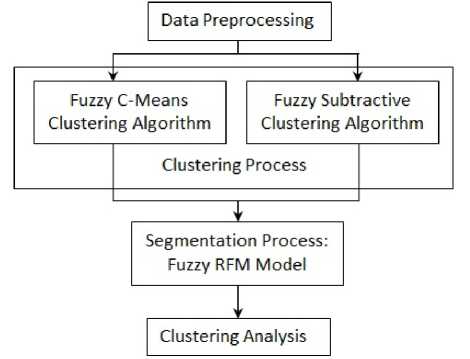
Figure 1. Research overview diagram
The overview diagram of this research is shown in Fig 1. In the figure there are five main steps: data processing, fuzzy RFM modeling, FCM and fuzzy subtractive clustering, cluster evaluation using MPC and PE index, and cluster analysis.
The data used in this paper is the transaction data from 2006 to 2010 with 3 million records data. This study performed an analysis of the clustering and segmentation process result of the transaction data in a period of one year, ie 2008, which consist of 17.999 rows of transaction data and was modeled into 499 rows of RFM data. Oneyear period was chosen on the data mining process in the consideration that it is the most appropriate period to describe the consumer behavior.
The aim of data preprocessing is to select and ensure the quality of data. At this stage the problem encountered are noisy data and missing values. At this stage the structure of the database will be prepared to facilitate the mining process. Table 1 shows the pieces of data used before transformed into RFM data. The pieces of data used in Table 1 will be modeled into RFM model (see Table 2). Value of recency is taken by searching the time interval between the last transaction dates until the end of period is set. Frequency is taken by summing the number of times the transaction is done by a customer until the end of period is set and Monetary is taken by summing the customers’ transaction amount until the end of period is set.
|
Table1. The pieces of data used before transformed into RFM data | ||
|
Customer Id |
Transaction Date |
Transaction Amount |
|
C0219 |
2008-11-17 |
155500000 |
|
C0308 |
2008-02-28 |
150570000 |
|
C0359 |
2008-01-30 |
123175000 |
|
CO311 |
2008-02-25 |
100980000 |
|
C0203 |
2008-02-29 |
86650000 |
|
C0203 |
2008-01-30 |
86650000 |
|
C0109 |
2006-04-29 |
2752250 |
|
C0246 |
2006-05-06 |
2869000 |
|
C0117 |
2006-05-06 |
16486240 |
Table 2. The pieces of RFM data used
|
Customer Id |
Recency |
Frequency |
Monetary |
Year |
|
C0234 |
364 |
118 |
240179800 |
2008 |
|
C0337 |
13 |
2 |
8357500 |
2008 |
|
C0752 |
347 |
120 |
2886000 |
2008 |
|
C0221 |
347 |
153 |
6136500 |
2008 |
|
C0026 |
365 |
175 |
256950800 |
2008 |
|
C0081 |
353 |
111 |
4134900 |
2008 |
|
C0050 |
365 |
236 |
176860250 |
2008 |
The traditional fuzzy c-means algorithm is one of the most widely used fuzzy clustering algorithms. This technique was originally introduced by Jim Bezdek in 1981. The fuzzy c-means algorithm attempts to partition a finite collection of elements X={ x1,x2,...,xn} into a collection of c fuzzy clusters with respect to some given criterions. Fuzzy sets allow for
degrees of membership. A single point can have partial membership in more than one class. There can be no empty classes and no class that contains no data points. The output of such algorithms is a clustering, but not a partition some times. Fuzzy clustering is a widely applied method for obtaining fuzzy models from data. It is based on minimization of the criterion function as defined follows:
Jm = ΣfL1Σj=1u^ h-ς∙∣∣2,l≤ m<∞
(1)
where m is any real number greater than 1, uij is the degree of membership of xi in the cluster j, xi is the ith of d-dimensional measured data, cj is the d-dimension center of the cluster, and ||*|| is any norm expressing the similarity between any measured data and the center. Fuzzy partitioning is carried out through an iterative optimization of the objective function shown above, with the update of membership uij and the cluster centers cj by:
uij
C
k=ι
IWI h-⅛ll
2/(m-l)
(2)
C ij=
¼=1 ul]λ : yW m ¼=ι uιj
(3)
This iteration will stop when u∏+1) -w∣jt)l∣ <ω, where is a termination criterion ∖J LJ IJ
between 0 and 1, whereas k are the iteration steps. This procedure converges to a local minimum or an encumber point of Jm. The algorithm is composed of the following steps:
Step 1 : Initialize U = [uiJ, matrix U(0)
Step 2 : In kstep: Calculate the centers of vector C[k} = [c∣] using Eq. 3
Step 3 : Compute U(k), U(k+1) using Eq.2
Step 4 : If {∣Uy+1) - Uy)∣} < ω, then stop, else go to step 2
This algorithm, data are leap to every cluster by membership procedure, which represents the fuzzy performance of algorithms. The algorithm constructs a suitable matrix named U, factors are numbers between 0 and 1 also represent the level of membership among data and centers of clusters.
Clustering algorithms typically require the user to pre-specify the number of cluster centers and their initial locations. The fuzzy c-means algorithm [8] is well-known examples of such clustering algorithms. The quality of the solution depends strongly on the choice of initial values (i.e., the number of cluster centres and their initial locations). Yager and Filev [9] proposed a simple and effective algorithm, called the mountain method, for estimating the number and initial location of cluster centers. Their method is based on gridding the data space and computing a potential value for each grid point based on its distances to the actual data points. A grid point with many data points nearby will have a high potential value. The grid point with the highest potential value is chosen as the first cluster center. The key idea in their method is that once the first cluster center is chosen, the potential of all grid points is reduced according to their distance from the cluster center. Grid points near the first cluster center will have greatly reduced potential. The next cluster center is then placed at the grid point with the highest remaining potential value. This procedure of acquiring new cluster center and reducing the potential of surrounding grid points repeats until the potential of all grid points falls below a threshold. Although this method is simple and effective, the computation grows
exponentially with the dimension of the problem because the mountain function has to be evaluated at each grid point.
Chiu [10] proposed an extension of Yager and Filev’s mountain method, called subtractive clustering.This method solves the computational problem associated with mountain method. It uses data points as the candidates for cluster centers, instead of grid points as in mountain clustering. The computation for this technique is now proportional to the problem size instead of the problem dimension. The problem with this method is that sometimes the actual cluster centres are not necessarily located at one of the data points. However, this method provides a good approximation, especially with the reduced computation that this method offers. It also eliminates the need to specify a grid resolution, in which tradeoffs between accuracy and computational complexity must be considered. The subtractive clustering method also extends the mountain method’s criterion for accepting and rejecting cluster centres.
The parameters of the subtractive clustering are xi is the normalized data vector of both input and output dimensions defined as:
i _ xj-min {xl}
(4)
X— r 'i ”
max[xl)-min {xl}
n is total number of data vectors, ra is hyper sphere cluster radius in data space, rb is the hyper sphere penalty radius in data space, Pi is the potential value of data vector i, is the squash factor — —.
rb
The subtractive clustering method works as follows. Consider a collection of n data points {x1, x2, x3,..., xn} in an M dimensional space. Without loss of generality, the data points are assumed to have been normalized in each dimension so that they are bounded by a unit hypercube. Each data point is considered as a potential cluster center. The potential of data point xiis defined as:
L⅛rt∣∣!^
P—J (5)
whererb is a positive constant. Thus, we subtract an amount of potential from each data point as a function of its distance from the first cluster center. The data points near the first cluster center will have greatly reduced potential, and therefore will unlikely be selected as the next cluster center. The constant rb is effectively the radius defining the neighborhood which will have measurable reductions in potential. When the potential of all data points has been revised, we select the data point with the highest remaining potential as the second cluster center. This process continues until a sufficient number of clusters are obtained. In addition to these criterions for ending the clustering process are criteria for accepting and rejecting cluster centers that help avoid marginal cluster centers.
Fuzzy RFM model integrated RFM model with fuzzy logic theory. RFM model is a common approach for understanding customer purchase behavior [1]. It is quite popular, especially in the retail industry. As its name implies, it involves the calculation and the examination of three variables – recency, frequency, and monetary – that summarize the corresponding dimensions of the customer relationship with the organization.The complete description is described below [1]:
-
1. Recency – Recency refers to the time interval between the last transactions was conducted by customer until the present time or within a certain period. The closer interval time between last times purchasing with the present produce the higher value of recency (R).
-
2. Frequency – Frequency refers to total number of transaction within a certain period. The larger number of transaction (frequently transaction) makes the higher value of frequency (F)
-
3. Monetary – Monetary refers to the amount of money was spent on a transaction within a specific time period. The larger amount of money was spent makes the higher value of monetary (M)
Each variables R, F, and M in fuzzy RFM model divided into three fuzzy set. Linguistic variable and domain value for each fuzzy set are shown in Table 3. Figs.2,3 and 4 show trapezoidal curve for fuzzy set of each variable R, F, and M.
Table 3.Linguistic variable and domain values for each of fuzzy set
|
Variable |
Linguistic Variable |
Domain Value |
|
Recency |
Recently Rather long-time Long-time |
0 ≤ r < 21 days 7 < r < 44 days 30 days < r |
|
Frequency |
Seldom Quite Often Often |
0 ≤ f < 100 transactions 40 < f < 200 transactions 140 transactions < f |
|
Monetary |
Low Medium High |
0 ≤ m < 500 mil Rupiahs 100 juta < m < 1 mil Rupiahs 600 mil Rupiahs < m |
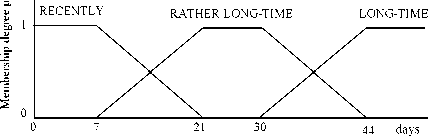
Figure 2.Trapezoidal Curve for Recency
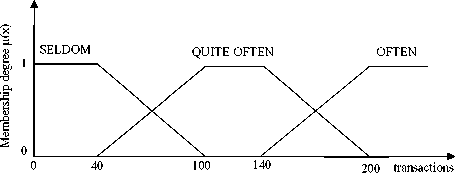
Figure 3.Trapezoidal Curve for Frequency
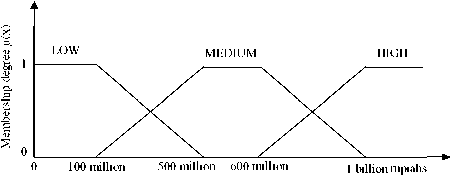
Figure 4.Trapezoidal Curve for Monetary
Class definition with the definition of linguistic variables and consumer label which is given in fuzzy RFM models are shown in Table 4. Consumer segmentation process will be done by calculating the degree of membership of the cluster center of each cluster ( ) to all customer classes (A) of fuzzy RFM model using Eq. 2:
μAW=(∏mιμiW)(1-v)(l-∏mι(l^^ ,0≤γ≤1
(6)
Where is a membership function of each linguistic variable (i) of R, F, and M in each customer classes (A), whereas x is a cluster centre. From the membership degree for each classes of which has been obtained, can be determined the class of cluster, ie the class which has the highest membership degree.
|
Table 4. Description of customer classes | |||
|
Description of Linguistic Variables |
Class | ||
|
Recency |
Frequency |
Monetary | |
|
Recently |
Seldom |
Low |
Dormant D |
|
Recently |
Seldom |
Medium |
Dormant A |
|
Recently |
Seldom |
High |
Occasional A |
|
Recently |
Quite Often |
Low |
Everyday D |
|
Recently |
Quite Often |
Medium |
Golden D |
|
Recently |
Quite Often |
High |
Superstar D |
|
Recently |
Often |
Low |
Everyday A |
|
Recently |
Often |
Medium |
Golden A |
|
Recently |
Often |
High |
Superstar A |
|
Rather Long-Time |
Seldom |
Low |
Dormant E |
|
Rather Long-Time |
Seldom |
Medium |
Dormant B |
|
Rather Long-Time |
Seldom |
High |
Occasional B |
|
Rather Long-Time |
Quite Often |
Low |
Everyday E |
|
Rather Long-Time |
Quite Often |
Medium |
Golden E |
|
Rather Long-Time |
Quite Often |
High |
Superstar E |
|
Rather Long-Time |
Often |
Low |
Everyday B |
|
Rather Long-Time |
Often |
Medium |
Golden B |
|
Rather Long-Time |
Often |
High |
Superstar B |
|
Long-Time |
Seldom |
Low |
Dormant F |
|
Long-Time |
Seldom |
Medium |
Dormant C |
|
Long-Time |
Seldom |
High |
Occasional C |
|
Long-Time |
Quite Often |
Low |
Everyday F |
|
Long-Time |
Quite Often |
Medium |
Golden F |
|
Long-Time |
Quite Often |
High |
Superstar F |
|
Long-Time |
Often |
Low |
Everyday C |
|
Long-Time |
Often |
Medium |
Golden C |
|
Long-Time |
Often |
High |
Superstar C |
Each class in fuzzy RFM model corresponds with a consumer label that states the characteristics of each consumer class. Generally there are five consumers label with the characteristic described as follows[1]:
Customers in this class are the most loyal customers with highest value, increased number of visit and high transaction spending.
Golden customers are the second highest value customers with increased number of visits and average transaction spending.
Occasions customers are customers who have low frequency, large basket and have a long time transaction after their last visit.
Everyday customers are customers with increasing number of visits but low in transaction value.
Dormant customers are the lowest class, customers in this class that have the lowest values, transaction amount andfrequency,did transaction long time after the last visit.
In fact, if cluster analysis is to make a significant contribution to engineering applications, much more attention must be paid to cluster validity issues that are concerned with determining the optimal number of clusters and checking the quality of clustering results. Cluster validation refers to procedures thatevaluate the clustering results in a quantitative and objective function. Some kinds of validity indices are usually adopted to measure the adequacy of a structure recovered through cluster analysis.Modified partition coefficient (MPC) and partition entropy (PE) indexeswill be used to verify the validity of the cluster and the comparison between fuzzy c-means and fuzzy subtractive.
Modified partition coefficient (MPC) index is a refinement from partition coefficient (PC) index. Bezdek designed the PC index to measure the amount of “overlap” between clusters. PC possess monotonic evolution tendency with cluster number and was defined by [11]:
PC W =⅛1∑‰(∕√) (7)
where is the membership of data point j in cluster i.Modification of the PC index proposed by Dave (1996) can reduce the monotonic tendency and was defined by [11] :
MPC(c) = 1 - ⅛(1- PC(c)) (8)
where 0 umber cisfound by solving
(max2<c<n~1PC (c)) to produce a best clustering performance for the data set.
Basically, partition entropy is a measure for the fuzziness of the cluster partition and defined by :
PE(c) = -⅛1∑⅛7∙ log (μij) (9)
where 0 ≤ PE(c) ≤ log2c .In general, an optimal c by solving(min2≤c≤n-1PE(c)).
Clustering process were tested with various value of cluster number (c) for FCM and radii (r) parameter (Fuzzy Subtractive) to form 2 until 6 cluster. Segmentation process using Fuzzy RFM model was performed on the result of each clustering algorithm. Below are some of the experiment results.

Figure 5.FCM clustering result (c=2)
Fig.5 shows clustering result using FCM with parameter value c=2. While the segmentation results using fuzzy RFM are shown in Table 5. The 2 clusters formed 2 consumer class, that is Dormant F and Superstar D.
Table 5.Fuzzy RFM segmentation result (FCM clustering result)
Fig.6 shows clustering result using fuzzy subtractive with parameter value r=0.5 which form 2 cluster. The segmentation results using fuzzy RFM are shown in Table 6. The 2 clusters formed 2 consumer class, that is Dormant E and Dormant F.

|
Cluster no |
Cluster member (%) |
Cluster centre coordinate and linguistic variable of R, F, M |
Consumer Class |
|
1 |
94.39 % |
R 62.2811 Long-time (µR=1) F 27.2048 Seldom (µF=1) M 64,887,916.46 Low (µM=1) |
Dormant F (µA=1) |
|
2 |
5.61 % |
R 4.2888 Recently (µR=1) F 161.3914 Quite Often (µF=0.6435) M 1,269,542,546.57 |
Superstar D (µA=0.8022) |
High (µM=1)
Figure 6.Fuzzy subtractive clustering result (r=0.5)
Table 6.Clustering (fuzzy subtractive) and segmentation result
|
Cluster no |
Cluster member (%) |
Cluster centre coordinate and linguistic variable of R, F, M |
Consumer Class |
|
1 |
81.96 % R F M |
21 Rather Long-time (µR=1) 24 Seldom (µF=1) 71,253,800.00 Low (µM=1) |
Dormant E (µA=1) |
|
2 |
18.04 % R F M |
231 Long-Time(µR=1) 1 Seldom (µF=1) 5,100,000.00 Low (µM=1) |
Dormant F (µA=1) |
Fig.7 shows clustering result using FCM with parameter value c=4. Segmentation results using fuzzy RFM are shown in Table 7. The 4 clusters formed 4 consumer class, that is everyday D, Superstar D, Superstar A, and Dormant F.
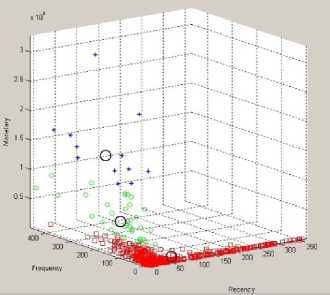
Figure 7.FCM clustering result (c=4)
Table 7.Fuzzy RFM segmentation result (FCM clustering result)
|
Cluster no |
Cluster member (%) |
Cluster centre coordinate and linguistic variable of R, F, M |
Consumer Class |
|
1 |
15.23 % |
R 6.3198 Recently (µR=1) F 74.8598 Quite Often (µF=0.5810) M 262,175,001.37 Low (µM=0.5946) |
Everyday D (µA=0.5877) |
|
2 |
3.81 % |
R 2.4884 Recently (µR=1) F 149.2276 Quite Often (µF=0,8462) M 935,793,370.97 High (µM=0,8395) |
Superstar D (µA=0.8428) |
|
3 |
2.00 % |
R 4.8983 Recently (µR=1) F 212.1149 Often (µF=1) |
Superstar A (µA=1) |
|
M |
1,761,409,932.74 High (µM=1) | ||
|
4 |
78.96 % R F M |
74.6464 Long-Time(µR=1) 16.6602 Seldom (µF=1) 25,895,238.98 Low (µM=1) |
Dormant F (µA=1) |
Fig.8 shows clustering result using fuzzy subtractive with parameter value r=0.15 which form 4 cluster. Segmentation results using fuzzy RFM are shown in Table 8. The 4 clusters formed 3 consumer class, theyare Dormant D, Dormant F, and Everyday D.

Figure 8.Fuzzy Subtractive clustering result (r=0.15)
Table 8.Clustering (fuzzy subtractive) and segmentation result
|
Cluster no |
Cluster member (%) |
Cluster centre coordinate and linguistic variable of R, F, M |
Consumer Class |
|
1 |
41.08 % |
R 13 Recently(µR=0.5714) F 16 Seldom (µF=1) M 59,218,000.00 Low (µM=1) |
Dormant D (µA=0.7559) |
|
2 |
12.22 % |
R 61 Long-Time (µR=1) F 3 Seldom (µF=1) M 16,125,350.00 Low (µM=1) |
Dormant F (µA=1) |
|
3 |
24.65 % |
R 0 Recently (µR=1) F 73 Quite Often (µF=0.5500) M 156,106,750.00 Low (µM=0.8597) |
Everyday D (µA=0.6876) |
|
4 |
22.04 % |
R 128 Long-Time (µR=1) F 6 Seldom (µF=1) M 9.088.100,00 Low (µM=1) |
Dormant F (µA=1) |
From the results of experiments performed using the transaction data in 2008, there are some things that can be analyzed. Table 9 shows the MPC and the CE index for each number of clusters tested using both clustering algorithm.Figs.9 and 10 showthe MPC and the CE index values that are displayed graphically for FCM and FS algorithm.
Table 9.MPC and CE index for FCM and Fuzzy Subtractive (FS) clustering result
|
Number of Cluster |
2 |
3 |
4 |
5 |
6 | |
|
MPC |
FCM |
0,9353 |
0,8981 |
0,8644 |
0,8640 |
0,8309 |
|
Index |
FS |
0,3194 |
0,1662 |
0,2017 |
0,1829 |
0,1541 |
|
CE |
FCM |
0,0597 |
0,1280 |
0,1901 |
0,2119 |
0,2777 |
|
Index |
FS |
0,1817 |
0,2115 |
0,3432 |
0,3142 |
0,2832 |
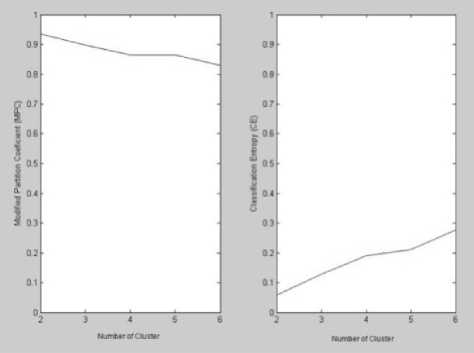
Figure 9. MPC and CE index graphs for FCM

Figure 10. MPC and CE index graphs for FS
FCM’s MPC index value for each number of clusters is greater than fuzzy subtractive’s. While the FCM’s CE index value for each number of clusters is smaller than fuzzy subtractive’s. From the results of this comparisonfuzzy c-means algorithm has better performance than fuzzy subtractive algorithm.
This paper demonstrated data mining process from customer's data in retail company by combining fuzzy RFM model with FCM and fuzzy subtractive algorithm. From the MPC and CE index obtained from clustering process to form 2 until 6 cluster, FCM has better performance than fuzzy subtractive algorithm for data mining process in retail company. Reffering the segmentation result using fuzzy RFM models, fuzzy subtractive algorithm failed to form a cluster that included in potential consumer i.e Superstar and Golden customer.For future development, data mining process can be improved with other method and use more than one cluster validation index algorithm to obtain better optimum cluster.The application of data mining tools for customer segmentation can with fuzzy method is expected also be done on a various kind of data.
Acknowledgments
Our thank goes to Department of Information Technology Udayana University, Bali, Indonesia who has helped organize this research.
References
-
[1] Tsiptsis, Kontantinos. Chorianopoulos, Antonios, “Data Mining Techniques in CRM: Inside Customer Segmentation”, United Kingdom, John Wiley & Sons.Ltd, 2009.
-
[2] Zumstein, D.,“Customer Performance Measurement: Analysis of the Benefit of a Fuzzy Classification Approach in Customer Relationship Management (Thesis)”, Switzerland, University of Fribourg, 2007.
-
[3] Buttle, F., “Customer Relationship Management: Concept and Technologies”, Butterworth-Heinemann, 2008.
-
[4] Jansen, S.M.H.,“Customer Segmentation and Customer Profiling for a Mobile Telecommunications Company Based on Usage Behavior: A Vodafone Case Study (Thesis)”,Maastricht ,University of Maastricht, 2007.
-
[5] Ha, S.H., Bae, S.M., & Park, S.C., “Customer's Time-Variant Purchase Behavior and Corresponding Marketing Strategies: An Online Retailer's Case”,Computers and Industrial Engineering, Volume 43, Number 4, pp.801-820(20), 2002.
-
[6] Cheng, C.H, Chen, Y.S., “ClassifyingTheSegmentation of CustomerValueVia RFM model and RS Theory”, Expert Systems with Applications, 36,pp.4176–4184, 2009.
-
[7] Gemala, Y., “Segmentasi Pelanggan dengan Algoritma K-Means dan Analisa RFM Untuk Mendukung Strategi Pengelolaan Pelanggan di PT. Indosat Mega Media”, Skripsi, Institut Teknologi Sepuluh November,2011.
-
[8] Bezdek, J. C., “Pattern Recognition with Fuzzy Objective Function”, Plenum Press, NewYork, 1981.
-
[9] Yager, R., Filev, D., “Generation of Fuzzy Rules by Mountain Clustering”, Journal of Intelligent & Fuzzy Systems, Vol. 2(3), pp.209-219,1994.
-
[10] Chiu, S.L., “Fuzzy model identification based on cluster estimation”, Fuzzy Systems, Vol. 2, pp.267-278, 1994.
-
[11] Wu, K., Yang, M.,“A Cluster Validity Index for Fuzzy Clustering”, Pattern Recognition Letters 26, pp.1275-1291, 2005.
200
Discussion and feedback