The Antecedent of Customer Satisfaction towards to Attitudinal Loyalty and Behavioural Loyalty (Study at Customers of PT. Telkom Indonesia Witel Denpasar)
on
Majalah Ilmiah Teknologi Elektro, Vol.22, No.1, Jan-Juni 2023
DOI: https://doi.org/10.24843/ MITE.2023.v22i01.P12
95
Antecedent of Customer Satisfaction towards to Attitudinal Loyalty and Behavioural Loyalty (Study at Customers of PT. Telkom Indonesia Witel Denpasar)
Komang Agus Putra Kardiyasa1, Rukmi Sari Hartati2, Yoga Divayana3
[Submission: 10-01-2023, Accepted: 05-03-2023]
ABSTRACT--- PT. Telkom Indonesia introduced fixed broadband, with its IndiHome product in 2015. According to the Triple Play service, IndiHome's flagship service, as well as other services, the core of IndiHome products is its internet service. Other services, such as voice (telephone) and interactive television (UseeTV) are ride products (augmented products). The goal of this study is to provide insight for future studies that will be conducted by researchers on service quality, which includes network quality, customer service, information quality, and customer data security. It also involves customer satisfaction, behavioural loyalty, and attitude loyalty. The issue in this study is that the number of customers who churn (unsubscribe the services) is increasing, indicating that customers are less loyal to IndiHome services. This study sent a questionnaire to 258 Witel Denpasar respondents who had subscribed to IndiHome for more than one month and had visited the Plaza Telkom in August 2022 in order to collect respondents' responses. The sampling technique used in this research is purposive sampling, which is a sampling technique with certain considerations. Data collection in this study was carried out by distributing questionnaires online via the Google form. And the data analysis technique used in this study is the structural equation modelling (SEM) method using LISREL 8.8 software.
Keywords: Customer Satisfaction; IndiHome; Structural Equation Model; Behavioural Loyalty
-
I. Introduction
In this study, the terms Internet Service Provider (ISP) and IndiHome will be used interchangeably based on the context discussed. Because, as an ISP, PT Telkom Indonesia sells its internet products under the IndiHome brand. ISP is a generic industry name, whereas IndiHome is a product brand. There is no difference in physical quality in terms of infrastructure (physical layer).
PT Telkom Indonesia currently has branch offices throughout Indonesia. In every area of Indonesia, these offices have special services for customers called the Office Plaza Telkom. Witel (Wilayah Telekomunikasi) Denpasar is one of
them.
The number of customers in Witel Denpasar as Witel class A also reaps the many disorders that arise, even reaching the stage of customer churn. Aside from disruptions, the customer indication to churn or revoke service is the least expected problem. The number of IndiHome customers who churned always increased from time to time. This demonstrates the low quality of products and services. As a result, it is possible that this phenomenon exhibits both direct and indirect cause and effect relationships. Indirect because the perceived quality of service by customers may degrade the image of the company and reduce customer confidence to the company [1]. Both are expected to have an impact on customer satisfaction and loyalty. The phenomenon of customer satisfaction has been extensively studied, but nothing is well established. Similarly, the cause and effect relationship between the variables used is still expanding.
Quality of service (SERVQUAL) is an important differentiator in a competitive business environment, and it is one of the drivers of service-based [2]. IndiHome service quality in this study is seen through the lens of network quality, customer service, and information quality, as well as the security of customer data. Customers are expected to have trust in IndiHome products as a result of the company's and IndiHome products high service quality. Customers can remain loyal to IndiHome products if they experience the expected level of satisfaction.
-
II. Literature study
-
a. Quality of Service
The researchers identified five service quality determinants in the following order of importance [3]:
-
1. Reliability; The ability to deliver on promises in a consistent and accurate manner.
-
2. Responsiveness; Willingness to assist customers and provide prompt service.
-
3. Guarantee; Employee knowledge and courtesy, as well as their ability to convey trust and confidence.
-
4. Empathy; providing personalised attention to customers.
-
5. Tangibles; The appearance of physical facilities, equipment, personnel, and communication.
-
b. Broadband Service Quality
Komang Agus Putra K: Antecedent of Customer Satisfaction …
p-ISSN: 1693 – 2951; e-ISSN: 2503-2372

Previous research has shown that overall service quality assessment in the telecommunications industry is derived from customer perceptions of a stable and strong network quality, ready to serve the customer support team, support the informative site (website), and high levels of security and privacy that customers trust [4]. One of the primary service drivers in the telecommunications industry is network quality. According to the preceding, SERVQUAL dimensions for broadband services include network quality, customer service, information quality, and security [5]. Network quality, customer service, information quality, and security are the SERVQUAL dimensions for broadband services [6].
Trust is defined as a condition in which one of the parties involved in the exchange process believes in the dependability and integrity of the other party [7]. Some essential components of trust are:
-
1) Trust is the accumulation of previous experiences and actions.
-
2) A trustworthy and reliable character.
-
3) Trust necessitates a willingness to put oneself at risk.
-
4) Trust entails feeling secure and confident in oneself and one's partner.
-
c. Customer Satisfaction
Customer satisfaction is the level of one's feelings after comparing one's performance or results with expectations; customer satisfaction is the result of the accumulation of consumers or customers in using products or services [8]. Customer satisfaction is a type of consumer behaviour. Consumer behaviour can be defined as the decision-making process and consumer activity involved in obtaining, evaluating, using, and discarding a product, including both services and goods. Customers who use the product will experience both positive and negative effects.
-
d. Customer Loyalty
Customer Loyalty refers to a customer who not only repurchases goods and services, but also has a commitment and a positive attitude towards service providers, such as by recommending others to buy [9].
Loyalty is a psychological condition (both attitudinal and behavioural) related to product attitudes; consumers will form beliefs, determine likes and dislikes, and decide whether or not to purchase a product [10]. Attitude loyalty (attitudinal) is a type of loyalty in which the customer is said to be loyal to the brand or company if the customer has a positive attitude and preference for it. Because the customer likes the company, product, service, or brand, he or she prefers to purchase from the company rather than competitors. This increases in terms of attitudinal loyalty. Customer loyalty is almost equivalent to increasing customer preferences for brands.
Behaviour (behavioural) loyalty is defined as actual customers who engage in repurchase activities, regardless of their attitude or preferences. Customers are said to be loyal to a company if they purchase from it and continue to do so. It is possible that a concession promotion on an airline with lower service standards has occurred. Customers who are not attitude loyal offer significantly lower tariffs than other companies. Attitude loyalty refers to a customer who has
positive feelings about the products and services they use and tries to persuade others to use them by recommending those [10]. Behavioural loyalty is defined as a customer's willingness to repurchase and subscribe to products or services. This is a type of consumer behaviour that involves making repeated purchases of specific products or services on a regular basis. Companies must have behavioural loyalty in order to make a profit.
Loyalty Attitudes can take the form of commitment or trust in the company that does not require any purchases [11]. Customers may have a positive attitude towards the company that provides the product or service, but they may have a more positive attitude towards other companies. Customers who are committed to their products and services not only demonstrate a positive attitude by purchasing again, patronising recommends products and services, but also demonstrate loyalty by not switching to another company. Consumer loyalty will occur if both attitudinal and behavioural loyalties occur.
The theoretical framework is the basis of the entire study so that it can be said to be a theoretical framework is a description of a study. Based on the theory that has been developed, it can be used to describe framework Antecedents of Customer Satisfaction and Influence is presented on Attitude Loyalty and Behavioural Loyalty [12]. The framework of thought can be seen as follows:

Figure 1: Thinking Framework H1-H10
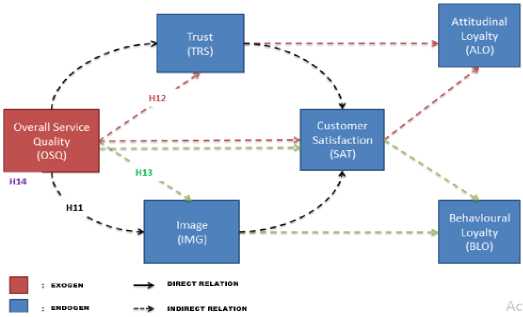
Figure 2: Thinking Framework H11-H14
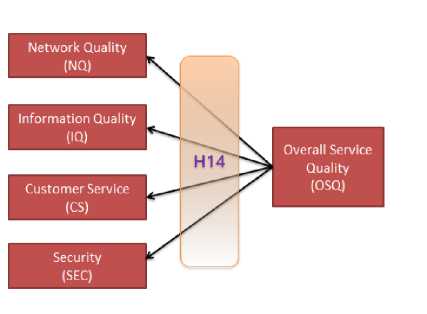
Figure 3: Thinking Framework H14
-
e. Hypothesis
-
1) The Effect of Service Quality on Trust
Customer trust is a critical success factor in the development and maintenance of any business [13]. Trust refers to customer perceptions of service providers, including the provider's ability, integrity, and virtue, and includes customer perception of the brand's ability to fulfil its promises. In the case of home internet services, trust can be assessed by investigating how customers perceive their service providers in terms of honesty, responsibility, professional behaviour, and level of understanding and care. Previous studies have suggested that customer satisfaction is a predictor of customer trust. The level of satisfaction with previous purchases has a direct impact on consumer confidence.
H1: Service quality influences trust positively and
significantly.
Quality of service is a consumer judgement that helps distinguish between predictable and suspect services. [13]. the impact of service quality on the company's image is determined by each customer's assessment; some believe the quality is excellent, while others believe it is adequate. Then, if it is related to the company's image, some respondents believe that quality service has a strong influence on the company's image through customer satisfaction, while others believe that quality service can directly influence the company's image.
H2: Service quality has a positive and significant impact on image.
-
2) Effect of Service Quality on Customer Satisfaction
Customers are more likely to switch service providers if they are dissatisfied with their current product or service [14]. Customer satisfaction has been shown to be an effective postpurchase evaluation of total service experience. Consumers will be satisfied if brands can keep their promises and meet their expectations. It also states that customer satisfaction in Turkish cellular telecommunications services is influenced by customer expectations and quality perceptions [15]. Therefore, the following has been hypothesized:
H3: Service quality has a positive and significant impact on customer satisfaction.
-
3) Effect of Trust on Customer Satisfaction
Trust refers to customer perceptions of service providers' capabilities, integrity, and benevolence, as well as customer perceptions of a brand's ability to fulfil its promises [16].
H4: Trust has a positive and significant impact on customer satisfaction.
-
4) Effect of Image on Customer Satisfaction
A positive organisational image has a direct impact on customer satisfaction and helps brands retain it [17].
H5: Image influences customer satisfaction positively and significantly.
Customer satisfaction has a significant effect on purchase intentions, which is greater than the effect of service quality [18]. Explain in the "service profit chain" model how customer satisfaction leads directly to customer loyalty. Furthermore, other researchers have discovered a strong correlation between customer satisfaction and service loyalty. Therefore, the following has been hypothesized: H6: Customer satisfaction influences attitude loyalty
positively and significantly.
H7: Customer satisfaction influences behaviour loyalty
positively and significantly.
-
5) Effect of attitude loyalty on behavioural loyalty
According to a study on cell phone services in China, attitude loyalty had a significant positive effect on behaviour loyalty [19]. As a result, the researchers propose that the ISP service quality dimension has both direct and indirect influence on customer loyalty. The direct effect is channelled through the customers' loyalty of attitude. By therefore, the following has been hypothesized:
H8: Loyalty attitude influences behaviour loyalty positively and significantly.
-
6) Effect of Trust on Attitude Loyalty
Trust encourages a highly valued exchange relationship, which promotes attitude. That trusted brand is purchased more frequently and has high attitude loyalty [20]. According to research, there is a positive relationship between trust and attitude loyalty. Thus, the relationship between trust and loyalty are hypothesized as:
H9: Trust influences attitude loyalty positively and
significantly.
-
7) Effect of Image on Behavioural Loyalty
When a consumer purchases a product, he or she is also purchasing the symbolic value contained in the product. People frequently purchase products for symbolic value rather than functional benefits. This symbolic value incorporates the manufacturer's identity or personality into a product or brand. Furthermore, consumers will perceive the symbolic value contained in this brand as brand image. A positive image of a product essentially assisted in simplifying consumer decisions when purchasing a product on a regular basis. With the help of positive imagery, consumers can make decisions to buy, subscribe to, and recommend the products mentioned to others.

H10: Image influences behaviour loyalty positively and significantly
-
8) Effect of Indirect Relations
Trust is the good of the company for its customers who focus on service quality, the company's intention, and its behaviour in providing services to customers. The image is the complete picture that consumers have of the company [21]. The identity, reputation, service level, and contact persons of the company are all image dimensions. Customer satisfaction is satisfaction that exceeds customer expectations. Service quality, product quality, promotion, and price of customer satisfaction all have an impact. Consumers' overall satisfaction can be measured using dimensions such as service quality, product quality, promotion, and price.
H11: Trust and image strengthen the effect of service quality on satisfaction customer.
Because the perceived value of online transactions mediates the influence of trust on loyalty, the influence of trust on loyalty is highly dependent on value. However, most researchers agree that trust has a direct and strong influence on loyalty. Customer loyalty is positively related to both trust and satisfaction. Empirical research into the role of trust in ecommerce concludes that trust influences purchase intentions, which in turn influences attitude loyalty [22]. As previously stated, we focus our research on loyalty attitude, which refers to the level of psychological and customer attachment attitude defence.
H12: Customer satisfaction reinforces the influence of
antecedents on attitude loyalty and Behavioural loyalty.
The image is defined as the accumulation of all thoughts, the association of ideas associated with that person with specific products, brands, companies, and people. Image is the overall impression formed in the minds of consumers from all sources. The subjective perception of association bundles that consumers have about the brand is used to form an image of the brand. That high service quality can result in high customer satisfaction and increased customer loyalty . Thus customer satisfaction is results from service quality.
H13: Attitude loyalty reinforces the effect of customer
satisfaction on behavioural loyalty.
A well-designed website can increase customer
engagement and provide useful information about the company's services. The quality of information is critical in developing a customer's overall positive attitude towards the company [23]. The quality of information and support website information, on the other hand, is a distinct dimension of ISP service quality.
H14: The most influential dimension among service quality dimensions is information quality.
-
III. methodology
The method used in this study is a quantitative research method (analysing numerical data) and a causative research method (investigating causal relationships). This study's population is a PT. Telkom Indonesia Witel Denpasar IndiHome customer who has previously visited Plasa Telkom Witel Denpasar and has been a subscriber to IndiHome for more than one month. The sample consisted of 258 IndiHome
customers from PT Telkom Indonesia Witel Denpasar. A questionnaire distributed online via Google Forms was used to collect primary data. For analysis, the Structural Equation Model using LISREL 8.8 software [24]. The testing in this study is divided into three stages: the validity and reliability test, the goodness of test fit test, and the test hypotheses.
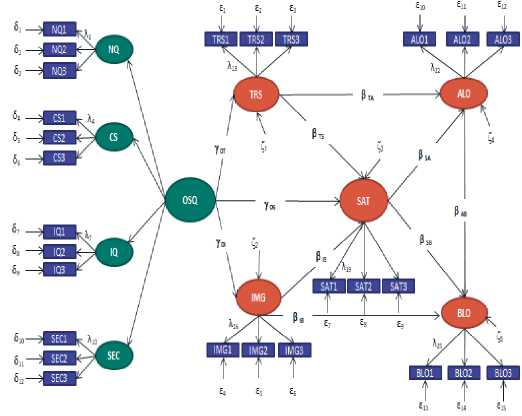
Figure 4: Overview of Research Structural Models
-
IV. results and discuss
-
a. Characteristics of Respondents
For primary data, this study relies on a questionnaire distributed to respondents. This research sample was drawn using a non-probability sampling technique with a purposive type sampling aimed at IndiHome customers PT. Telkom Indonesia Witel Denpasar who have already visited Plaza Telkom Witel Denpasar and subscribed for at least one month. Google Forms was used to distribute the questionnaire, which was completed online.
Respondent data was obtained through the distribution of questionnaires with 364 respondents and valid data that could be processed with only 258 respondents. 69% dominated by male gender as many as 179 respondents, 36% aged 26-35 years as many as 94 respondents, 51% had a bachelor degree as many as 133 people, 64% worked as private employees, namely 165 people, 37% have an income of 4-5 million, as many as 96 people, and 36% have used IndiHome for an average of 2-3 years, as many as 94 people.
Validity and Reliability Test
According to the Good of Fit Indices table and the explanation above, the research model performed poorly, with 1 GOF measure indicating a poor or poor fit. 1 GOF size indicates marginal fit, while 12 GOF sizes indicate Good or Good Fit [25].
In these results, the measurement index that a structural model can be said suitable if a minimum of 5 indexes in the Goodness of Fit measurement are stated to match in value criteria, so it can be concluded that all of the models in this research model are compatible Goodness of Fit (Good Fit).
TABLE I
TEST RESULTS VALIDITY AND RELIABILITY
|
Wiriabel |
Indikator |
Wilue |
Std. Loading factor; |
Error Winance |
Consnuct Rebabihn |
■H Variance Extracted |
Information Result |
|
NQ |
NQl |
5.33 |
0.59 |
0.03 |
0.89 |
0,72 |
Ialid & Reliable |
|
NQ2 |
5.21 |
0.86 |
0.26 |
ValidJeReliable | |||
|
NQ3 |
5.34 |
0.83 |
0.32 |
Valid Jc Reliable | |||
|
CS |
CSl |
11.32 |
0.9 |
0.02 |
0.95 |
0.70 |
ValidJeRehable |
|
CS2 |
15.83 |
0.83 |
0.02 |
Vahd Je Reliable | |||
|
CS3 |
10.63 |
0,77 |
0.3 |
Valid Jc Reliable | |||
|
IO |
IQl |
9.21 |
0.92 |
0.16 |
0.95 |
0.82 |
ValidJeRehable |
|
KP |
8.35 |
0.88 |
0.08 |
Valid Jc Rehable | |||
|
IQ3 |
19,29 |
0.91 |
0,17 |
Valid Jc Rehable | |||
|
SEC |
SECl |
11.98 |
0.86 |
0.07 |
0.96 |
0.87 |
Valid & Rehable |
|
SEC2 |
13.43 |
1 |
0.1 |
Valid Jc Reliable | |||
|
SEO |
12.4 |
0.93 |
0.14 |
Valid Jc Rehabte | |||
|
TRS |
TRSl |
19.23 |
0.95 |
0.12 |
0.96 |
0,77 |
Valid Jc Rehable |
|
TRS2 |
27,73 |
0.93 |
0,12 |
Valid Jc Rehable | |||
|
TRSS |
13,43 |
0.73 |
0,07 |
ValidARehable | |||
|
IMG |
IMGl |
9.29 |
0.87 |
0.25 |
0.94 |
0,73 |
Valid A Rehable |
|
IMG2 |
12.32 |
0.97 |
0,22 |
ValidARehable | |||
|
IMG3 |
9.83 |
0.76 |
0.3 |
Valid A Rehable | |||
|
IMG4 |
22.76 |
0.88 |
0.26 |
Valid A Rehable | |||
|
IMG5 |
10.27 |
0.77 |
0.12 |
Valid & Rahable | |||
|
SAT |
SATl |
11.48 |
0.87 |
0.08 |
0,97 |
0,85 |
Valid A Rehable |
|
SAT2 |
12,1 |
1 |
0 |
ValidARehable | |||
|
SATS |
12.36 |
0.9 |
0.18 |
ValidARehable | |||
|
ALO |
.ALOl |
31.33 |
0.95 |
0.1 |
0.96 |
0.89 |
Valid A Reliable |
|
AL02 |
31.02 |
0.93 |
0.13 |
Valid & Rababta | |||
|
ALO3 |
38.18 |
0.95 |
0.1 |
Valid A Rehable | |||
|
BLO |
BLOl |
24.39 |
0.92 |
0.16 |
0.91 |
0.77 |
ValidARehable |
|
BL02 |
35.19 |
0.93 |
0.14 |
Valid A Rehable | |||
|
BLOS |
23.52 |
0.78 |
0.39 |
Valid A Rehabte |
Goodness of Fit Test
TABLE II
GOODNESS OF FIT IN STRUCTURAL MODELS
|
Gooiiness Of Fit Indices |
Cut-Off Ialue |
Research Result |
Match Level |
|
Absolute Fil Indices | |||
|
/2 Significance Probability |
> 0 05 |
P= 1.00 |
Good Fit |
|
GFI |
≥0.90 |
0.73 |
Marginal Fit |
|
RMSEA |
<o.os |
0.0 |
Good Fit |
|
RMR |
<0.08 |
0.065 |
GoodFtt |
|
SRMR |
<0.08 |
0.066 |
GoodFit |
|
Incremental FU Indices | |||
|
NFI |
>0 90 |
0.99 |
Good Fir |
|
TLI(NNFI) |
>0.90 |
1.00 |
Good Fit |
|
CFIlRyil |
>0.90 |
1.00 |
Good Fir |
|
RFI |
>0.90 |
0.99 |
Good Fir |
|
IFI |
>0.90 |
1.00 |
Good Fir |
|
Parsimony Fit Indices | |||
|
AGFI |
>0.90 |
0.65 |
Pooi Fir |
|
PNFI |
>0.50 |
0.82 |
Good Fit |
|
PGFI |
>0.50 |
0.56 |
Good Fit |
-
b. Hypothesis Testing
The significance and strength of the relationship between the variables variable in accordance with the hypothesis that has been made were used to determine hypothesis testing in this study. The T-value on the results LISREL output indicates significance. In this study, with a 95% confidence level, the
hypothesis will be accepted if the T-value is greater than 1.96 or less than 1.96.
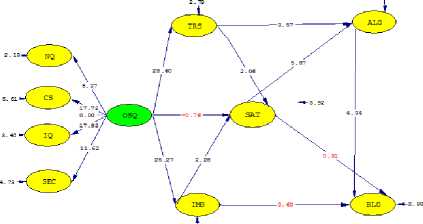
Figure 5: T-values in the Research Model
The T-value on each relationship between variables in the study, as shown in Figure 5, is obtained from the LISREL programme. If the number is black, it indicates that the T-value is greater than 1.96 or less than -1.96, indicating a significant relationship between variables. In contrast, if the red T-value indicates a non-significant relationship between variables.
TABLE III
T-VALUES AND REGRESSION COEFFICIENTS
|
Hypoihesis |
T Regression Coefficient Resulls |
T-Value |
Result |
|
Hl OSQ--TRS |
093 |
28.40 |
Hl Accepted |
|
H2 OSQ--IMG |
095 |
25.27 |
H2 Accepted |
|
H3 OSQ--SAT |
0.36 |
•0 76 |
H3 Rejected |
|
H-I TRS - — SAT |
0 58 |
2.06 |
H4 Accepted |
|
HS IMG--SAT |
0.70 |
2.28 |
H5 Accepted |
|
H6 SAT- —ALO |
0.62 |
5.87 |
H6 Accepted |
|
H7SAT--BLO |
008 |
0.31 |
H7 Rejected |
|
HS-ALO--BLO |
0.82 |
4 34 |
HS Accepted |
|
HO TRS - - ALO |
0.35 |
3.57 |
H9 Accepted |
|
HlO IMG —∙ BLO |
0.06 |
0,3l |
HlO Rejected |
|
HIT OSQ -TRS IMG-SAT |
0,83 |
10.77 |
Hl 1 Accepted |
|
Hl 2 OSQ - TRS SAT-ALO |
0 84 |
27.27 |
H12 Accepted |
|
H13: OSQ- IMG SAT— BLO |
0.81 |
22.56 |
H13 Accepted |
|
Hl-I IQ adalah dιmen≤ι paling kuat |
0.84 |
17.92 |
H14 Accepted |
-
c. Overall Business Implication
Based on the results of the discussion, conclusions can be drawn about the current state of the company PT. Telkom Indonesia, specifically IndiHome service quality in terms of infrastructure reliability and responsibility. From services to infrastructure reliability, the programme is currently in effect 3 on 3 (installation acceleration, interference handling acceleration, and increasing service level guarantee), then from the service side is implemented speeding up accessing service channels such as digital touch with implemented “MyIndihome”, easy access to services centralised at call
centre 147, and opening outlets in the form of Telkom group Grapari and also Telkom Plaza. IndiHome's service quality is expected to be well perceived by customers, which is expected to directly improve customer satisfaction.
Despite, in this study, the quality of IndiHome services must first be trusted and relied on by the customer, and it must have a positive image in the eyes of the customer; only then will it achieve customer satisfaction. The IndiHome image of PT. Telkom Indonesia is not directly related to behavioural loyalty in this study. In terms of the company's current state, PT. Telkom Indonesia is implementing the programme Customer Get Customer to influence the community, as has been done in collaboration with RT / RW, then conducted an introduction and at the same time as an IndiHome marketing agent with fostered business partners using CDC (Community Development Centre) funds. Many testimonials were delivered to IndiHome subscribers and prospective customers in the programme. IndiHome is a massive project that is being implemented in stages, beginning with programmes in the central region and progressing to programmes in regional areas and Witel (Wilayah Telekomunikasi), including Witel Denpasar. Improvement programmes to improve infrastructure reliability and service quality are expected to increase behaviour loyalty, with customers continuing to subscribe to IndiHome.
Customer satisfaction has no effect on behaviour loyalty, which may lead to an increase in churn levels from 2021 to 2022. Because of the numerous fibre optic and non-fiber optic interferences that appear, customers are dissatisfied. Overall, casement IndiHome customer satisfaction only affects the stage at which the customer places a positive value on IndiHome products and influences them to recommend them to others, not the point of purchase. Attitude loyalty can be defined as a commitment or trust in a company that does not require a purchase.
-
V. Conclusions
Based on the results of research that has been conducted by researchers to find out "Antecedents of Satisfaction Customers and their Influence on Attitude Loyalty and Behavioural Loyalty "can then be withdrawn conclusion as follows:
-
a. Service Quality has a positive and significant relationship to Trust. Service quality has a positive and significant relationship to the image. Service quality does not have a positive and significant direct relationship to satisfaction customer.
-
b. Trust has a positive and significant relationship to customer satisfaction. Image has a positive and significant relationship to customer satisfaction. Trust has a positive and significant relationship to attitude loyalty.
-
c. Customer satisfaction has a positive and significant relationship directly to attitude loyalty. Customer
satisfaction does not have a positive and significant direct relationship to loyalty behaviour.
-
d. Loyalty attitude has a positive and significant relationship to behavioural loyalty. The image does not have a positive and significant direct relationship to behavioural loyalty.
-
e. Trust and image have a total influence in mediating the effect of service quality on customer satisfaction. Customer
trust and satisfaction has a total influence in mediating the influence of service quality towards attitude loyalty.
-
f. Image and customer satisfaction have a total influence in mediating the influence of service quality towards and loyalty behaviour. The most influential dimension among the dimensions of service quality is information quality.
BIBLIOGRAPHY
-
[1] Giovanis, A., Zondiros, D (2014). The Antecedents of Customer
Loyalty for Broadband Services: The Role of Service Quality
-
[2] Zhao, Y. L., Anthony, C., Benedetto, D. (2013). Designing Service
Quality to Survive: Empirical Evidence From Chinese New Ventures. Journal of Business Research, 66(8), 1098-1107.
-
[3] Akbar, (2009). Impact of Service Quality, Trust, and Customer
Satisfaction on Customers Loyalty. ABAC Journal 29, 24-38.
-
[4] Anita Gusmiarti (2020). Penerapan Metode Structural Equation
Modelling Pada Analisis Tingkat Kepuasan Mahasiswa FMIPA UII, Program Studi Matematika, Universitas Islam Indonesia
-
[5] Djatmiko, T. (2018). Pengaruh Behavioral Intention terhadap Use Behavior pada Penggunaan Aplikasi Transportasi Online (Studi kasus pada pengguna Go-jek dan Grab di Kalangan Mahasiswa Telkom University) Telkom University, Bandung
-
[6] I Putu Astya Prayudha., Made Sudarma. Ida Bagus Alit Swamardika. (2021). Review Literatur Tentang Analisis Kepuasan Layanan dengan Pendekatan Servqual dan IPA. Majalah Ilmiah Teknologi Elektro, Vol. 20, No. 2, Juli - Desember 2021. Magister Teknik Elektro Universitas Udayana
-
[7] Charolina Devi Oktaviana., I Nyoman Pramaita., Made Sudarma (2021), Literatur Review Penerapan Teknologi Informasi dan Metode Pengukuran Pada Audit Kepuasan Pelanggan. Majalah Ilmiah Teknologi Elektro, Vol. 20, No. 2, Juli - Desember 2021. Magister Teknik Elektro Universitas Udayana
-
[8] El-Adly, M. I. (2020). Modelling The Relationship Between Perceived
Value, Customer Satisfaction, and Customer Loyalty. Journal of Retailing and Consumer Services, 50, 322-332.
-
[9] I.P.S Almantara., M.Sudarma, I.B. A Swamardika (2021). Literatur Review Penilaian Tingkat Kepuasan Layanan Produk/Jasa dengan Metode Service Quality Model. Majalah Ilmiah Teknologi Elektro, Vol. 20, No. 2, Juli - Desember 2021. Magister Teknik Elektro Universitas Udayana
-
[10] Chatzoglou, P., Chatzoudes, D., Vraimaki, E., & Leivaditou, E. (2014). Measuring Citizen Satisfaction Using the SERVQUAL Approach: The Case of the Hellenic Post. Procedia Economics and Finance 9, 349360.
-
[11] Heri Irawan., M.Thaib Hasan (2021). Pemodelan Menggunakan SEM untuk mengetahui Kepuasan dan Kepercayaan serta Loyalitas Pelanggan. Jurnal Teknologi Volume 13 No. 1 Januari 2021. Universitas Muhamadiyah Jakarta
-
[12] Fitriani Sutraya Lubis., Anissa Putri Rahhima (2019). Analisis Kepuasan Pelanggan dengan Metode Servqual dan Pendekatan Structural Equation Modelling (SEM) pada Perusahaan Jasa Pengiriman Barang di Wilayah Kota Pekanbaru. Jurnal Sains, Teknologi dan Industri, Vol. 16, No. 02, Desember 2019
-
[13] Hong, I. B., Cho, H. (2011). The impact of consumer trust on attitudinal loyalty and purchase intentions in B2C e-marketplaces: Intermediary trust vs. seller trust. International Journal of Information Management, 31, 469-479
-
[14] Farooq, M. S., (2018). Impact of Service Quality on Customer
Satisfaction in Malaysia Airlines. Journal of Air Transport Management, 67, 169-180
-
[15] Hendriana. (2017). Pengaruh Partisipasi Pelanggan dalam Membangun
Brand Loyalty Produk Indihome Melalui Social Media.Fakultas Ekonomi dan Bisnis, Universitas Telkom Bandung
-
[16] Thaichon, P., Lobo, A., Quach, T. N. (2014). The development of service quality dimensions for internet service providers: Retaining customers of different usage patterns. Journal of Retailing and Consumer Services, 21(6), 1047-1058.
-
[17] O. Ogiemwonyi, A. Harun, and A. Rahman,(2020) The Relationship between Service Quality Dimensions and Customer Satisfaction towards Hypermarket in Malaysia, Vol. 24, no. 05, pp. 2062–2071, 2020, doi: 10.37200/IJPR/V24I5/PR201904.
-
[18] Fitriani Sutraya Lubis., Anissa Putri Rahhima (2019). Analisis Kepuasan Pelanggan dengan Metode Servqual dan Pendekatan Structural Equation Modelling (SEM) pada Perusahaan Jasa
Pengiriman Barang di Wilayah Kota Pekanbaru. Jurnal Sains, Teknologi dan Industri, Vol. 16, No. 02, Desember 2019
-
[19] Hong, I. B., Cho, H. (2011). The impact of consumer trust on attitudinal loyalty and purchase intentions in B2C e-marketplaces: Intermediary trust vs. seller trust. International Journal of Information Management, 31, 469-479
-
[20] Y. D. Putra, I. N. S. Kumara, N. W. S. Aryani dan I. B. A. Swamardika, (2021). Literature Review Analisis Kinerja SDM Menggunakan Metode Behaviorally Anchored Rating Scale (BARS), Majalah Ilmiah Teknologi Elektro, vol. 20, pp. 103-112, 2021.
-
[21] Zehir, C., Narcıkara, E. (2016). E-Service Quality and E-Recovery Service Quality: Effects on Value Perceptions and Loyalty Intentions. Procedia - Social and Behavioral Sciences, 229, 427-443
-
[22] Al-Ansi, A (2019). Role of Halal-Friendly Destination Performances,
Value, Satisfaction, and Trust. Journal of Destination Marketing & Management
-
[23] Sastradipraja, C. K., dan Barokah, (2020). Rancang Bangun Sistem Informasi Kualitas Layanan Terhadap Kepuasan Pasien Menggunakan Metode Customer Satisfaction Index, Jurnal Ilmiah Flash, vol. 6, hal: 16-27, Des. 2020.
-
[24] Ghozali, I. (2008). Struktural Equation Modeling Teori Konsep dan Aplikasi dengan Program LISREL 9.10. Semarang
-
[25] S. Hamidani, V. Amalia dan J. Agustin, (2020) Sistem Pengukuran Kualitas Layanan Menggunakan Metode Serqual, Jurnal Ilmiah Binary STMIK Bina Nusantara Jaya, vol. 2, pp. 1-7, 2020.
-
[26] Arindita, A. R (2011). Pengaruh Kualitas Pelayanan Terhadap Citra Perusahaan Di Olimart PL Wina Wira Usaha. Jurnal UWM.
-
[27] Zakheus Putlely, Yoppy Andry Lesnussa (2021). Structural Equation Modeling (SEM) untuk Mengukur Pengaruh Pelayanan, Harga, dan Keselamatan terhadap Tingkat Kepuasan Pengguna Jasa Angkutan Umum Selama Pandemi Covid-19 di Kota Ambon. Indonesian Journal of Applied Statistics Volume 4 No. 1 May 2021
-
[28] Rihon Prihans Pamungkas., Wiwik Sulistyowati (2022) Analisis Kepuasan Pelanggan Gojek Di Pandaan Menggunakan Metode Structural Equation Modelling (SEM). Seminar Nasional Inovasi Teknologi UN PGRI Kediri, 23 Juli 2022
-
[29] Kasmawati., Abdiel Khaleil Akmal., (2022) Pengaruh Kualitas Pelayanan Terhadap Kepuasan Pelanggan Menggunakan Structural Equation Modeling Partial Least Square pada PT. XYZ. Jurnal Optimalisasi Vol. 8, No. 1, April 2022. Fakultas Teknik, Universitas Teuku Umar
-
[30] Yao, T., Qiu, Q., & Wei, Y. (2019). Retaining hotel employees as internal customers: Effect of organizational commitment on attitudinal and behavioral loyalty of employees. International Journal of
Hospitality Management, 76, 1-8
-
[31] D. Vanesa, F. Firman, H. A. Mesta, (2020). Analisis Peningkatan Kualitas Pelayanan Pasien Menggunakan Metode Servqual Dan Importance Performance Analysis (IPA), Jurnal Kajian Manajemen Dan Wirausaha, Vol. 2, No. 1, P. 28, 2020.

[HALAMAN INI SENGAJA DIKOSONGKAN]
ISSN 1693 – 2951
Komang Agus Putra K: Antecedent of Customer Satisfaction …
Discussion and feedback