QUALITY ASSESSMENT OF SF6 INSULATION AT WARU 150 KV GIS COMPARTMENT USING PARTIAL DISCHARGE ION MOBILITY SPECTROMETER
on
Quality Assessment of SF6 …
Yulistya Negara dkk.
QUALITY ASSESSMENT OF SF6 INSULATION AT WARU 150 KV GIS COMPARTMENT USING PARTIAL DISCHARGE ION MOBILITY SPECTROMETER
Yulistya Negara, Syariffuddin Mahmudsyah, Ade Arizal Kurniawan
Dept. of Electrical Engineering, Sepuluh Nopember Institute of Technology
Kampus ITS Sukolilo, Surabaya, 60111
E-mail: yulistya@ee.its.ac.id
Abstrak
Almost all of modern gas insulated switchgears (GIS) use sulphur hexafluoride (SF6) as insulation material. Therefore, GIS quality much or less depends on quality of its SF6. Failure however can arise within operation of SF6 GIS due to quality decline of SF6. Quality decline of SF6 in GIS can be recognized by existence of decomposition product of SF6, which may appear due to partial discharge, arc during switching, etc. Therefore quality control of SF6 insulation in GIS is necessary in order to prevent failure occurred due to SF6 quality decline. In this study, quality assessment of SF6 at Waru 150 kV SF6 GIS is done using equipment namely partial discharge ion mobility spectrometer. This equipment assesses quality of SF6 based on ions mobility. Concentration of decomposition product is then obtained from ion mobility of gas analyzed.
For all compartment tested of Waru 150 kV SF6 GIS, it was found that the largest concentration of decomposition product is between 1000-2000 ppmv. Generally, SF6 condition at Waru 150 kV SF6 GIS is normal based on CIGRE standard.
Keywords: GIS, SF6 Ion Mobility Spectromete
SF6 have dielectric strength about three times compared to air at the same pressure, therefore the application of SF6 as insulation material in high voltage equipment increase steadily.
Theoretically, high voltage equipments especially equipment with SF6 insulation include SF6 GIS are designed for on site flawless operation for about 30 years. Even SF6 high voltage equipment is claimed maintenance free, routine test is still necessary to maintain its reliability because along the operation of SF6 GIS, purity SF6 may decline due to decomposition product produced by partial discharge, arcing during switching operation, etc [1, 2]. Decline of SF6 quality may lead to GIS failure and finally breaks the system down.
In this study, assessment quality of SF6 insulation at Waru SF6 GIS, which have been operated about 17 years, is done in order to know quality of SF6 so that failure can be diminish. This assessment is done annually and the results are interpreted according to CIGRE standard.
Some basis of analyze of SF6 insulation quality are briefly described below.
Purity of SF6: This testing provides purity of SF6, which shows SF6 content per unit volume.
Content of Corrosive Material: Corrosive material is resulted from decomposition products of SF6 (SxOyFz). Another decomposition product of SF6 is also toxically and its dielectric strength much lower than pure SF6
Dew Point of SF6: This analyze is done by using a sensor dew point which shows the temperature in which SF6 gas freeze (frost point). Dew point is affected by contaminant at SF6 gas such as water vapor at SF6 gas [3].
Ion mobility spectrometer (IMS) is an instrument that is used to detect decomposition product of gas. It works based on ion mobility spectrometry. Some advantages of this equipment are high sensitivity, quick data process, portable, on-site detection and can used on-line continuously. However, it cannot detect what kind of gas is the decomposition of the gas.
Principle IMS: Basic used in this technology is measurement of gas ion mobility in an electric field. Mobility of ions is determined by ion velocity, which is measured in a drift cell under effect of electric field. The most important part of IMS method is its IMS-Cell. Process in IMS-Cell is simply depicted in Figure 1.
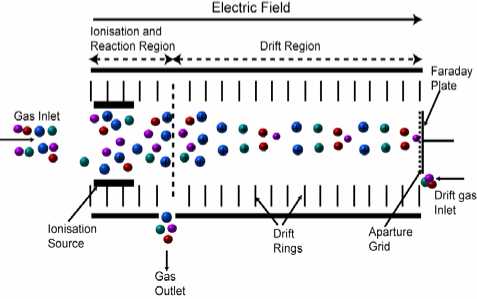
Figure 1. Ion Mobility Spectrometer Cell[5]
Ionization process due to its difference velocity, mass, and difference geometry structure occurs if gas is inserted into IMS-Cell. IMS can generate three kinds of ionization process. They are radioactive (radiation with β-63Ni or 3H light), photo ionization (ultraviolet with energy of 8.5, 9.6, 10.2, 10.6, and 11.7 eV), and partial discharge or corona discharge.
After ionization process, ions mobile with difference velocity depend on its mass and geometry structure. Then ions are separated through ion shutter and they are flown into drift region. Drift region has homogenous electric field of about 150 V/cm until 300 V/cm. Ratio between average drift velocity in certain field (vd) and electric field strength (E) is known as motion ability of ions in gas and noted as mobility. The ratio is shown in Equation 1. Time required passes drift region is called drift time (td). Drift time relates with mobility of each ion therefore ions will be still separate each other. Drift time of ions is known as ions collide a detector (faraday plate) and ions collision result in ion mobility
spectrums.
K =vd = ii E td ∙ E
(1)
Ion mobility spectrum informs condition of measured gas and compared with gas reference. Pure SF6 gas is used as calibrator of IMS and indicator existence of
decomposition [4-6]. Typical result of spectrum analysis of SF6 is shown in Figure 2.
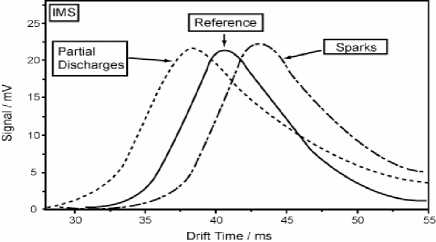
Figure 2. Ion Mobility Spectrometer Cell
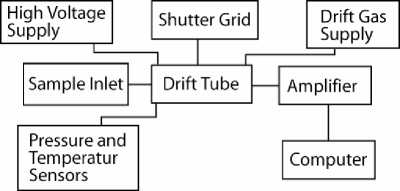
Figure 3. Hardware of Ion Mobility Spectrometer[5]
Components of IMS: Below component of IMS will be briefly described. The component can be fall into two main components: hardware and software.
Hardware: The components of IMS can be schematically seen on Figure 3 and can be described following;
-
a. Drift tube/ IMS-cell
Main part of IMS is Drift tube explained before.
-
b. High voltage supply
Power source and electric field generator in drift tube. Voltage required is about 90-265 V
-
c. Sample inlet
Tested gas is inserted through this inlet. During gas injection, gas should not be contaminated and gas leakage should be avoided.
-
d. Pressure and Temperature censors
Censor to detect pressure and temperature of tested gas
-
e. Shutter grid/ ion shutter
Shutter grid separates ions which are resulted from ionized gas and can be close/open in 10 μs to 1 ms. If it is opened, ions flow into drift region but ions can be flowed outer if it is closed.
-
f. Drift gas supply
As a line to introduce gas used in drift region. The gas flows from faraday plate to ionization region to assure that only ions flow into drift region not free particles.
-
g. Amplifier
Amplifies signal obtained from faraday plate. Energy collision of ions on faraday plate is small. It must be amplified so that software or computer can seize it.
-
h. Computer
Obtained data such as drift velocity, temperature, and pressure will be processed by computer. Current (nA or pA) obtained from faraday plate will be converted to voltage then to digital signal. The data are then analyzed by IMS software. Ion mobility spectrometer must be protected from outer electric field to avoid disturbance on its results.
Software: Software of IMS analyzes the obtained data. Spectrums of tested gas are compared to gas reference. Shifted Peak of tested gas spectrum is obtained if decomposition product of SF6 exists. The software can show value of dew point, quantity of
decomposition product, temperature, pressure of compartment and pressure inside of IMS.
Interpretation on tested gas is given according to CIGRE 23.10, which is
1
2
3
4
Purity
Purity standard used is ≥ 97%
Dew point at 1 atm
≤ -310C = content of water vapor ≤ 350 ppmv for
operating voltage ≤ 170 kV.
≤ -220C = content of water vapor ≤ 840 ppmv for operating voltage > 170 kV.
≤ -310C = content of water vapor ≤ 610 ppmv.
Peak shift
0 ms – 1.5 ms = <500 ppmv.
1.5 ms – 3 ms = 500 – 1000 ppmv.
3 ms – 6 ms = 1000 – 2000 ppmv
> 6 ms = 2000 ppmv.
Content of corrosive material/ Decomposition < 500 ppmv = Normal (purity OK).
500 – 1000 ppmv = Normal (purity OK).
1000 – 2000 ppmv = Low contamination. > 2000 ppmv = High contamination.
All ionization processes in this testing use partial discharge method because with this process number of ion becomes larger and more complex. This method also may show a condition in compartment if partial discharge occurred. Four parts in one compartment were tested. These parts were circuit breaker, disconnector bus (A and B), and disconnector line. These parts were chosen because these parts are often moved mechanically and arc may occur during switching of circuit breaker.
At first gas reference according to IEC 376 standard was injected to IMS for calibration purpose. Spectrum mobility of gas reference is shown in Figure 4 and its characteristics are:
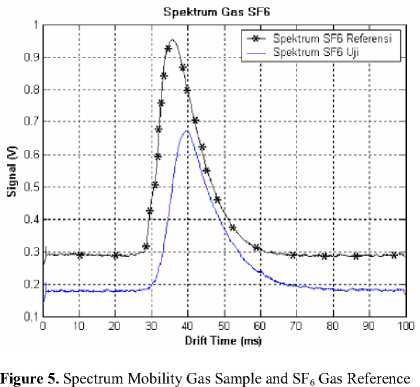
Testing done at Waru 150 kV SF6 GIS gave many results in form of ion gas spectrums and then compared with spectrum of gas reference. Other results were purity and dew point of SF6 gas. In this study analysis quality of SF6 is stressed on value of peak shift because it relates to decomposition product of SF6. Typical test result of gas sample on line disconnector of transformator 1 is shown in Figure 5.
As clearly seen from the figure that drift time of test gas is about 39.4 ms.Therefore obtained peak shift is:
Peak shift = drift time test gas – drift time gas reference
= 39.4 – 35.8 = 3.6 ms
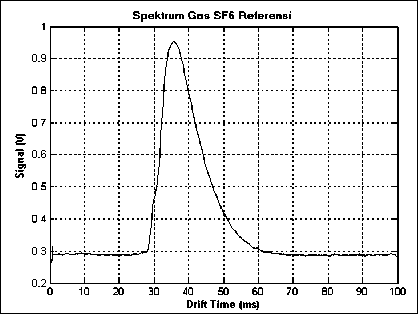
Figure 4. Spectrum Mobility SF6 Gas Reference
According to CIGRE 23.10, peak shift of 3.6 ms shows that content of decomposition product is between 1000 – 2000 ppmv, which mean that condition of SF6 gas is low contaminated (low contamination). All test results of all compartments are summarized in Table 3 at the end of this paper It clearly seen from the table that 37 or 38.14 % (from 97 tested compartments) of compartment show declining of SF6 quality according to concentration of decomposition product. The quality decline from ‘OK’ (< 500 ppmv) to ‘OK’ (500-1000 ppmv) or from ‘OK’ to ‘LC’ (Low Contamination).
From Table 3, it shows that Buduran A disconnector has the largest peak shift of about 5.6 ms. This value still less than 6 ms which also means low contamination. However, further investigation must be done in order to know type of decomposition gas to prevent failure of this compartment. Generally
condition of all compartment can be said “healthy” because concentration of gas decomposition below 2000 ppmV. *
In order to know the relation of transformator loading and peak shift, correlation between peak shift change and load of Transformator was also determined. Average load each bay at Waru 150 kV SF6 GIS from year 2006 to year 2008 are shown on Table 2 and peak shift change and percentage load are shown on Table 3. It was found that value of correlation between average load and peak shift change is about 0.75. Its mean that peak shift change correlates with percentage average load. The peak shift has linear relationship with load of GIS.
Table 2. Load Data GIS Waru 150 kV
|
Bay |
Nom. Curren t(A) |
Year |
Av. Load (%) | |||||
|
2006 |
2007 |
2008 | ||||||
|
(a) |
(b) |
(a) |
(b) |
(a) |
(b) | |||
|
Trafo 1 |
322 |
177 |
54,87 |
171 |
53,05 |
175 |
54,35 |
54,09 |
|
Trafo 2 |
322 |
155 |
48,14 |
171 |
53,05 |
203 |
62,89 |
54,69 |
|
Trafo 3 |
1.732 |
1.102 |
63,63 |
1.107 |
63,92 |
814 |
46,98 |
58,18 |
|
Trafo 4 |
1.732 |
724 |
41,79 |
804 |
46,43 |
1.089 |
62,86 |
50,36 |
|
Trafo 5 |
1.443 |
1.115 |
77,25 |
1.198 |
82,99 |
1.138 |
78,83 |
79,69 |
|
Trafo 6 |
1.443 |
1.020 |
70,71 |
397 |
27,52 |
825 |
57,17 |
51,80 |
|
Trafo 7 |
866 |
551 |
63,61 |
638 |
73,66 |
795 |
91,80 |
76,36 |
|
Buduran 1 |
740 |
264 |
35,73 |
273 |
36,94 |
304 |
41,05 |
37,91 |
|
Buduran 2 |
740 |
323 |
43,58 |
299 |
40,43 |
445 |
60,14 |
48,05 |
|
D. Grnde1 |
740 |
310 |
41,89 |
319 |
43,07 |
344 |
46,45 |
43,81 |
|
D. Grnde2 |
740 |
310 |
41,89 |
319 |
43,07 |
345 |
46,62 |
43,86 |
|
Gresik 1 |
1480 |
387 |
26,13 |
388 |
26,21 |
374 |
25,25 |
25,86 |
|
Gresik 2 |
1480 |
383 |
25,90 |
385 |
26,01 |
374 |
25,25 |
25,72 |
|
Ispatindo1 |
740 |
268 |
36,27 |
245 |
33,13 |
283 |
38,18 |
35,86 |
|
Ispatindo2 |
740 |
256 |
34,64 |
261 |
35,33 |
280 |
37,84 |
35,93 |
|
K. Pilang1 |
1480 |
392 |
26,47 |
421 |
28,43 |
463 |
31,25 |
28,72 |
|
K. Pilang2 |
1480 |
392 |
26,47 |
420 |
28,38 |
443 |
29,90 |
28,25 |
|
Rungkut 1 |
1480 |
831 |
56,17 |
875 |
59,09 |
841 |
56,84 |
57,37 |
|
Rungkut 2 |
1480 |
832 |
56,20 |
873 |
58,95 |
856 |
57,85 |
57,67 |
|
Sawahan1 |
1480 |
469 |
31,68 |
507 |
34,28 |
579 |
39,10 |
35,02 |
|
Sawahan2 |
1480 |
455 |
30,75 |
507 |
34,28 |
579 |
39,10 |
34,71 |
Remark : (a) Load current (Ampere)(b) Load percentage (%) Load Data up to April 2008.
In order to maintain insulation quality of SF6 insulation at Waru 150 KV GIS compartment, assessment quality of SF6 using partial discharge ion mobility spectrometer is done. The results can be summarized as follows.
-
1. Correlation between load percentage and peak shift change is about 0.75, which mean that peak shift change correlate linearly with load percentage.
Table 3. Data of Peakshift change and Percentage of Load per Bay at Waru GIS
|
Bay |
(a) |
(b) |
Bay |
(a) |
(b) |
|
Trafo 1 |
2,325 |
54,09 |
Gresik 1 |
0,325 |
25,86 |
|
Trafo 2 |
2,525 |
54,69 |
Gresik 2 |
0,45 |
25,72 |
|
Trafo 3 |
3,925 |
58,18 |
Ispatindo |
0,6 |
35,86 |
|
Trafo 4 |
0,325 |
50,36 |
Ispatindo |
0,35 |
35,93 |
|
Trafo 5 |
3,175 |
79,69 |
Karang Pilang 1 |
0,35 |
28,72 |
|
Trafo 6 |
3,025 |
51,80 |
Karang Pilang 2 |
0,675 |
28,25 |
|
Trafo 7 |
2,275 |
76,36 |
Rungkut 1 |
2,225 |
57,37 |
|
Buduran 1 |
1 |
37,91 |
Rungkut |
2 |
57,67 |
|
Buduran 2 |
0,375 |
48,05 |
Sawahan |
1,125 |
33,86 |
|
Darmo Grande 1 |
1,3 |
43,81 |
Sawahan 2 |
1,575 |
34,71 |
|
Darmo Grande 2 |
0,575 |
43,86 |
Spare 1 |
0,35 |
- |
|
Kopel Bus |
0,74 |
- |
Spare 2 |
0,575 |
- |
Remark: (a) Average Peakshift Change each Compartment (ms) (b) Percentage Average Load (%)
-
2. Peak shift minimum detected is 0.0 ms similar to gas reference and peak shift maximum was 5.6 ms, which mean gas had concentration decomposition product between 1000 – 2000 ppmv.
-
3. About 38% of compartment of Waru 150 kV SF6 GIS show quality decline. However, in general quality of SF6 quality is still good or OK, because concentration of decomposition product is below 2000 ppmv.
Further investigation is necessary to recognize type of gas decomposition product to understand from which the decomposition product is generated, e.g. using FTIR (Fourier Transform Infra Red). So that suitable handling can be perform.
The authors would like to thank PT. PLN (Persero) P3B Region Jawa Timur dan Bali UPT Surabaya for allow us in the measurement, providing some data and engagement discussions
-
[1] Maller, V.N., Naidu M.S., Advanced in High Voltage Insulation and Arc Interruption in SF6 and Vacuum, Pergamon Press, 1981.
-
[2] W. Ding et al., “Analysis of PD-generated SF6 Decomposition Gases Adsorbed on Carbon Nanotubes”, IEEE Transactions on Dielectrics and Electrical Insulation Vol. 13, No. 6, Desember 2006.
-
[3] Vaisala, Dewpoint Measurement in SF6 Gas-Insulated Switchgear, www.vaisala.com.
-
[4] …, Ion Mobility Spectrometry untuk Evaluasi Kondisi Isolasi Gas di GIS dan Gas Circuit Breaker, G.A.S. Gesellschaft für Analytische Sensorsysteme GmbH.
-
[5] Baumbach, J.I., P. Pilzecker, “Assesment of SF6 Quality in Gas Insulated Compartments of High
Voltage Equipment using Partial Discharge Ion Mobility Spectrometers”, International Journal for Ion Mobility Spectrometry, 2005.
-
[6] Baumbach, J.I., Process Analysis using Ion Mobility Spectrometry, 2005
Table 3. Testing Result of SF6 Gas at Compartment Waru GIS
|
Kompartemen |
Testing on year 2005 |
Testing on year 2008 | ||||||||||
|
Purity (%) |
Dew Point (oC) |
Drift Time (ms) |
Peak shift (ms) |
Concentration of Decomposition Product (ppmv) |
Re mar ks. |
Purity (%) |
Dew Point (oC) |
Drift Time (ms) |
Peak shift (ms) |
Concentration of Decomposition Product (ppmv) |
Rema rks. | |
|
TRAFO 1 PMT |
99,9 |
-18 |
32,9 |
2,9 |
500-1000 |
OK |
99,9 |
-30 |
37,5 |
1,7 |
500-1000 |
OK |
|
PMS A |
99,9 |
-17 |
35,4 |
0,4 |
<500 |
OK |
99,9 |
-18 |
38,2 |
2,4 |
500-1000 |
OK |
|
PMS LINE |
100,0 |
-15 |
35,8 |
0,0 |
<500 |
OK |
100,0 |
-20 |
39,4 |
3,6 |
1000-2000 |
LC |
|
PMS B |
99,9 |
-30 |
36,1 |
0,3 |
<500 |
OK |
99,9 |
-21 |
38,6 |
2,8 |
500-1000 |
OK |
|
TRAFO 2 PMT |
99,9 |
-11,0 |
36,1 |
0,3 |
<500 |
OK |
99,9 |
-30 |
38,6 |
2,8 |
500-1000 |
OK |
|
PMS A |
99,8 |
-15 |
38,7 |
2,9 |
500-1000 |
OK |
99,8 |
-19 |
39,6 |
3,8 |
1000-2000 |
LC |
|
PMS LINE |
99,8 |
-17 |
35,5 |
0,3 |
<500 |
OK |
99,8 |
-19 |
39,3 |
3,5 |
1000-2000 |
LC |
|
PMS B |
99,9 |
-29,0 |
35,5 |
0,3 |
<500 |
OK |
99,9 |
-26 |
39,6 |
3,8 |
1000-2000 |
LC |
|
TRAFO 3 PMT |
99,9 |
-21,0 |
37,5 |
1,7 |
500-1000 |
OK |
99,9 |
-21 |
40,7 |
4,9 |
1000-2000 |
LC |
|
PMS A |
100 |
-17,0 |
35,3 |
0,5 |
<500 |
OK |
100,0 |
-21 |
40,2 |
4,4 |
1000-2000 |
LC |
|
PMS LINE |
100 |
-16,0 |
35,4 |
0,4 |
<500 |
OK |
100,0 |
-21 |
40,7 |
4,9 |
1000-2000 |
LC |
|
PMS B |
100 |
-27,0 |
36,0 |
0,2 |
<500 |
OK |
100,0 |
-24 |
40,1 |
4,3 |
1000-2000 |
LC |
|
TRAFO 4 PMT |
100,0 |
-18 |
33,2 |
2,6 |
500-1000 |
OK |
100,0 |
-30 |
38,8 |
3,0 |
500-1000 |
OK |
|
PMS A |
100,0 |
-17 |
38,8 |
3,0 |
500-1000 |
OK |
100,0 |
-21 |
38,2 |
2,4 |
500-1000 |
OK |
|
PMS LINE |
100,0 |
-15 |
38,2 |
2,4 |
500-1000 |
OK |
99,9 |
-19 |
38,3 |
2,5 |
500-1000 |
OK |
|
PMS B |
100,0 |
-28 |
38,2 |
2,4 |
500-1000 |
OK |
100 |
-30 |
38,4 |
2,6 |
500-1000 |
OK |
|
TRAFO 5 PMT |
99,9 |
-20 |
33,8 |
2,0 |
500-1000 |
OK |
99,9 |
-33 |
39,2 |
3,4 |
1000-2000 |
LC |
|
PMS A |
99,9 |
-20 |
34,7 |
1,1 |
<500 |
OK |
99,9 |
-24 |
40,1 |
4,3 |
1000-2000 |
LC |
|
PMS LINE |
99,9 |
-18 |
35,6 |
0,2 |
<500 |
OK |
99,9 |
-20 |
40,4 |
4,6 |
1000-2000 |
LC |
|
PMS B |
100,0 |
-27 |
36,2 |
0,4 |
<500 |
OK |
100,0 |
-26 |
39,9 |
4,1 |
1000-2000 |
LC |
|
TRAFO 6 PMT |
99,8 |
-28,0 |
33,4 |
2,4 |
500-1000 |
OK |
99,8 |
-27 |
36,1 |
0,3 |
<500 |
OK |
|
PMS A |
100,0 |
-17,0 |
36,7 |
0,9 |
<500 |
OK |
100,0 |
-19 |
38,6 |
2,8 |
500-1000 |
OK |
|
PMS LINE |
100,0 |
-16 |
35,3 |
0,5 |
<500 |
OK |
100,0 |
-17 |
40,3 |
4,5 |
1000-2000 |
LC |
|
PMS B |
99,9 |
-28,0 |
35,5 |
0,3 |
<500 |
OK |
99,9 |
-24 |
40,2 |
4,4 |
1000-2000 |
LC |
|
TRAFO 7 PMT |
99,9 |
-12,0 |
33,1 |
2,7 |
500-1000 |
OK |
99,9 |
-33 |
39,9 |
4,1 |
1000-2000 |
LC |
|
PMS A |
99,9 |
-20,0 |
38,6 |
2,8 |
500-1000 |
OK |
99,9 |
-27 |
38,5 |
2,7 |
500-1000 |
OK |
|
PMS LINE |
99,8 |
-17 |
36,5 |
0,7 |
<500 |
OK |
99,8 |
-20 |
40,4 |
4,6 |
1000-2000 |
LC |
|
PMS B |
100,0 |
-29 |
36,2 |
0,4 |
<500 |
OK |
99,9 |
-23 |
39,9 |
4,1 |
1000-2000 |
LC |
|
BUDURAN 1 PMT |
99,8 |
-22 |
35,8 |
0,0 |
<500 |
OK |
99,8 |
-32 |
37,6 |
1,8 |
500-1000 |
OK |
|
PMS A |
99,9 |
-19 |
41,4 |
5,6 |
1000-2000 |
LC |
99,8 |
-22 |
39,3 |
3,5 |
1000-2000 |
LC |
|
PMS LINE |
99,8 |
-19,0 |
40,0 |
4,2 |
1000-2000 |
LC |
99,8 |
-21 |
39,9 |
4,1 |
1000-2000 |
LC |
|
PMS B |
100,0 |
-29 |
39,6 |
3,8 |
1000-2000 |
LC |
100 |
-29 |
39,6 |
3,8 |
1000-2000 |
LC |
|
BUDURAN 2 PMT |
99,8 |
-25,0 |
32,2 |
3,6 |
1000-2000 |
LC |
99,8 |
-32 |
39,2 |
3,4 |
1000-2000 |
LC |
|
PMS A |
99,8 |
-20,0 |
40,3 |
4,5 |
1000-2000 |
LC |
99,8 |
-21 |
40,7 |
4,9 |
1000-2000 |
LC |
|
PMS LINE |
99,8 |
-18,0 |
40,0 |
4,2 |
1000-2000 |
LC |
99,8 |
-19 |
39,3 |
3,5 |
1000-2000 |
LC |
|
PMS B |
99,8 |
-28,0 |
39,5 |
3,7 |
1000-2000 |
LC |
99,7 |
-29 |
39,7 |
3,9 |
1000-2000 |
LC |
|
DARMO GRD 1 PMT |
99,8 |
-31,0 |
33,3 |
2,5 |
500-1000 |
OK |
99,7 |
-34 |
40,2 |
4,4 |
1000-2000 |
LC |
|
PMS A |
99,7 |
-20,0 |
39,8 |
4,0 |
1000-2000 |
LC |
99,7 |
-21 |
40,2 |
4,4 |
1000-2000 |
LC |
|
PMS LINE |
99,7 |
-18,0 |
38,8 |
3,0 |
500-1000 |
OK |
99,7 |
-19 |
40,5 |
4,7 |
1000-2000 |
LC |
|
PMS B |
99,7 |
-30,0 |
38,5 |
2,7 |
500-1000 |
OK |
99,7 |
-21 |
39,7 |
3,9 |
1000-2000 |
LC |
|
DARMO GRD 2 PMT |
99,8 |
-30,0 |
32,7 |
3,1 |
1000-2000 |
LC |
99,8 |
-31 |
39,9 |
4,1 |
1000-2000 |
LC |
|
PMS A |
99,8 |
-19,0 |
40,5 |
4,7 |
1000-2000 |
LC |
99,8 |
-20 |
39,9 |
4,1 |
1000-2000 |
LC |
|
PMS LINE |
99,8 |
-18 |
39,8 |
4,0 |
1000-2000 |
LC |
99,8 |
-21 |
40,0 |
4,2 |
1000-2000 |
LC |
|
PMS B |
99,8 |
-12 |
34,0 |
1,8 |
500-1000 |
OK |
99,5 |
-20 |
38,1 |
2,3 |
500-1000 |
OK |
|
GRESIK 1 PMT |
99,9 |
-25 |
37,4 |
1,6 |
500-1000 |
OK |
99,9 |
-32 |
38,0 |
2,2 |
500-1000 |
OK |
|
Kompartemen |
Testing on year 2005 |
Testing on year 2008 | ||||||||||
|
Purity (%) |
Dew Point (oC) |
Drift Time (ms) |
Peak shift (ms) |
Concentration of Decomposition Product (ppmv) |
Re mar ks. |
Purity (%) |
Dew Point (oC) |
Drift Time (ms) |
Peak shift (ms) |
Concentration of Decomposition Product (ppmv) |
Rema rks. | |
|
PMS A |
100,0 |
-20 |
39,4 |
3,6 |
1000-2000 |
LC |
99,7 |
-20 |
39,0 |
3,2 |
1000-2000 |
LC |
|
PMS LINE |
99,7 |
-19,0 |
38,9 |
3,1 |
1000-2000 |
LC |
99,7 |
-19 |
39,1 |
3,3 |
1000-2000 |
LC |
|
PMS B |
99,8 |
-28 |
37,9 |
2,1 |
500-1000 |
OK |
99,8 |
-29 |
37,8 |
2,0 |
500-1000 |
OK |
|
GRESIK 2 PMT |
99,8 |
-21,0 |
38,9 |
3,1 |
1000-2000 |
LC |
99,8 |
-32 |
39,0 |
3,2 |
1000-2000 |
LC |
|
PMS A |
100,0 |
-20,0 |
40,5 |
4,7 |
1000-2000 |
LC |
99,6 |
-20 |
39,1 |
3,3 |
1000-2000 |
LC |
|
PMS LINE |
99,7 |
-19 |
38,9 |
3,1 |
1000-2000 |
LC |
99,7 |
-20 |
38,9 |
3,1 |
1000-2000 |
LC |
|
PMS B |
99,9 |
-28 |
38,5 |
2,7 |
500-1000 |
OK |
99,6 |
-28 |
38,2 |
2,4 |
500-1000 |
OK |
|
ISPATINDO 1 PMT |
100 |
-30 |
32,9 |
2,9 |
500-1000 |
OK |
100 |
-35 |
38,9 |
3,1 |
1000-2000 |
LC |
|
PMS A |
100 |
-19 |
39,6 |
3,8 |
1000-2000 |
LC |
100 |
-24 |
39,0 |
3,2 |
1000-2000 |
LC |
|
PMS LINE |
100 |
-19 |
40,0 |
4,2 |
1000-2000 |
LC |
100 |
-21 |
39,4 |
3,6 |
1000-2000 |
LC |
|
PMS B |
100 |
-28 |
40,0 |
4,2 |
1000-2000 |
LC |
100 |
-24 |
39,0 |
3,2 |
1000-2000 |
LC |
|
ISPATINDO 2 PMT |
100,0 |
-30 |
32,9 |
2,9 |
500-1000 |
OK |
100 |
-35 |
38,6 |
2,8 |
500-1000 |
OK |
|
PMS A |
100,0 |
-19 |
40,8 |
5,0 |
1000-2000 |
LC |
100 |
-25 |
40,6 |
4,8 |
1000-2000 |
LC |
|
PMS LINE |
99,9 |
-18 |
38,5 |
2,7 |
500-1000 |
OK |
99,9 |
-21 |
39,2 |
3,4 |
1000-2000 |
LC |
|
PMS B |
99,8 |
-28,0 |
39,3 |
3,5 |
1000-2000 |
LC |
99,8 |
-27 |
38,9 |
3,1 |
1000-2000 |
LC |
|
K.PILANG 1 PMT |
99,7 |
-28,0 |
32,7 |
3,1 |
1000-2000 |
LC |
99,7 |
-21 |
32,7 |
3,1 |
1000-2000 |
LC |
|
PMS A |
99,5 |
-20 |
40,9 |
5,1 |
1000-2000 |
LC |
99,5 |
-20 |
40,0 |
4,2 |
1000-2000 |
LC |
|
PMS LINE |
100,0 |
-20 |
38,1 |
2,3 |
500-1000 |
OK |
99,5 |
-19 |
38,4 |
2,6 |
500-1000 |
OK |
|
PMS B |
99,7 |
-29 |
38,2 |
2,4 |
500-1000 |
OK |
99,6 |
-29 |
38,0 |
2,2 |
500-1000 |
OK |
|
K.PILANG 2 PMT |
99,9 |
-25 |
32,4 |
3,4 |
1000-2000 |
LC |
99,8 |
-30 |
39,1 |
3,3 |
1000-2000 |
LC |
|
PMS A |
99,8 |
-20 |
40,6 |
4,8 |
1000-2000 |
LC |
99,7 |
-21 |
39,9 |
4,1 |
1000-2000 |
LC |
|
PMS LINE |
99,8 |
-18 |
39,2 |
3,4 |
1000-2000 |
LC |
99,8 |
-19 |
40,1 |
4,3 |
1000-2000 |
LC |
|
PMS B |
99,8 |
-26 |
39,0 |
3,2 |
1000-2000 |
LC |
99,8 |
-23 |
40,0 |
4,2 |
1000-2000 |
LC |
|
RUNGKUT 1 PMT |
99,8 |
-25 |
36,8 |
1,0 |
<500 |
OK |
99,7 |
-35 |
38,8 |
3,0 |
500-1000 |
OK |
|
PMS A |
99,8 |
-17 |
34,6 |
1,2 |
<500 |
OK |
99,7 |
-20 |
40,2 |
4,4 |
1000-2000 |
LC |
|
PMS LINE |
99,9 |
-15 |
37,6 |
1,8 |
500-1000 |
OK |
99,7 |
-21 |
39,9 |
4,1 |
1000-2000 |
LC |
|
PMS B |
100,0 |
-29 |
33,9 |
1,9 |
500-1000 |
OK |
99,8 |
-30 |
39,1 |
3,3 |
1000-2000 |
LC |
|
RUNGKUT 2 PMT |
99,8 |
-25 |
36,8 |
1,0 |
<500 |
OK |
99,8 |
-35 |
38,6 |
2,8 |
500-1000 |
OK |
|
PMS A |
99,8 |
-18 |
35,4 |
0,4 |
<500 |
OK |
99,8 |
-22 |
40,2 |
4,4 |
1000-2000 |
LC |
|
PMS LINE |
99,8 |
-17 |
38,8 |
3,0 |
500-1000 |
OK |
99,8 |
-21 |
39,2 |
3,4 |
1000-2000 |
LC |
|
PMS B |
99,8 |
-29 |
34,3 |
1,5 |
<500 |
OK |
99,8 |
-29 |
39,1 |
3,3 |
1000-2000 |
LC |
|
SAWAHAN 1 PMT |
99,8 |
-22 |
32,9 |
2,9 |
500-1000 |
OK |
99,5 |
-30 |
38,3 |
2,5 |
500-1000 |
OK |
|
PMS A |
99,7 |
-19 |
40,1 |
4,3 |
1000-2000 |
LC |
99,7 |
-19 |
39,9 |
4,1 |
1000-2000 |
LC |
|
PMS LINE |
99,9 |
-20 |
38,9 |
3,1 |
1000-2000 |
LC |
99,9 |
-19 |
40,3 |
4,5 |
1000-2000 |
LC |
|
PMS B |
99,6 |
-30 |
38,3 |
2,5 |
500-1000 |
OK |
99,6 |
-29 |
40,8 |
5,0 |
1000-2000 |
LC |
|
SAWAHAN 2 PMT |
99,8 |
-21 |
33,4 |
2,4 |
500-1000 |
OK |
99,8 |
-25 |
37 |
1,2 |
<500 |
OK |
|
PMS A |
99,7 |
-19 |
40,0 |
4,2 |
1000-2000 |
LC |
99,7 |
-22 |
40,8 |
5,0 |
1000-2000 |
LC |
|
PMS LINE |
99,8 |
-17 |
38,6 |
2,8 |
500-1000 |
OK |
99,8 |
-22 |
41 |
5,2 |
1000-2000 |
LC |
|
PMS B |
99,8 |
-30 |
39,2 |
3,4 |
1000-2000 |
LC |
99,8 |
-30 |
41,1 |
5,3 |
1000-2000 |
LC |
|
SPARE 1 PMT |
99,7 |
-27 |
38,9 |
3,1 |
1000-2000 |
LC |
99,7 |
-24 |
39,1 |
3,3 |
1000-2000 |
LC |
|
PMS A |
99,6 |
-19 |
40,0 |
4,2 |
1000-2000 |
LC |
99,6 |
-21 |
39,7 |
3,9 |
1000-2000 |
LC |
|
PMS LINE |
99,6 |
-18 |
39,0 |
3,2 |
1000-2000 |
LC |
99,6 |
-19 |
39,7 |
3,9 |
1000-2000 |
LC |
|
PMS B |
99,7 |
-26 |
39,1 |
3,3 |
1000-2000 |
LC |
99,7 |
-19 |
39,3 |
3,5 |
1000-2000 |
LC |
|
SPARE 2 PMT |
98,9 |
-33 |
37,4 |
1,6 |
500-1000 |
OK |
99,7 |
-33 |
38,5 |
2,7 |
500-1000 |
OK |
|
PMS A |
100,0 |
-21 |
40,1 |
4,3 |
1000-2000 |
LC |
99,5 |
-23 |
39,4 |
3,6 |
1000-2000 |
LC |
|
PMS LINE |
99,8 |
-24 |
40,5 |
4,7 |
1000-2000 |
LC |
99,8 |
-18 |
40,1 |
4,3 |
1000-2000 |
LC |
|
PMS B |
99,6 |
-30 |
40,0 |
4,2 |
1000-2000 |
LC |
99,5 |
-21 |
39,9 |
4,1 |
1000-2000 |
LC |
|
KOPEL BUS PMT |
99,9 |
-19 |
32,6 |
3,2 |
1000-2000 |
LC |
99,9 |
-32 |
40 |
4,2 |
1000-2000 |
LC |
|
PMS A |
99,6 |
-17 |
39,8 |
4,0 |
1000-2000 |
LC |
99,6 |
-19 |
40,1 |
4,3 |
1000-2000 |
LC |
|
PMS B |
99,8 |
-17 |
40,5 |
4,7 |
1000-2000 |
LC |
99,8 |
-21 |
40,1 |
4,3 |
1000-2000 |
LC |
|
BUS BAR A |
99,7 |
-33 |
39,2 |
3,4 |
1000-2000 |
LC |
99,7 |
-31 |
40,3 |
4,5 |
1000-2000 |
LC |
|
BUS BAR B |
99,6 |
-32 |
39,2 |
3,4 |
1000-2000 |
LC |
99,6 |
-21 |
40,1 |
4,3 |
1000-2000 |
LC |
Teknologi Elektro
97
Vol. 7 No. 2 Juni – Desember 2008
Discussion and feedback