User Experience Analysis Of 'Ayooklik.Com' Online Store Using Use Questionnaire In Determining Product Segmentation
on
Majalah Ilmiah Teknologi Elektro, Vol. 19, No. 1, Januari - Juni 2020
DOI: https://doi.org/10.24843/MITE.2020.v19i01.P03 19
User Experience Analysis Of "Ayooklik.Com" Online Store
Using Use Questionnaire In Determining Product Segmentation
Philipus Novenando Mamang Weking1 , Made Sudarma2 , Komang Oka Saputra3
Submission: 29-10-2019, Accepted: 26-11-2019
Abstract— Over time, the market function of the conventional has now developed into an updated market namely Online Store. The Online Store Business is currently supported by a marketing strategy called Product Segmentation. In the implementation of the marketing strategy, sometimes it is not in a position to satisfy all their customers at any time because not all requirements of every customer can be fulfilled by the Online Store company. To answer this problem, a solution that can be offered to solve the problem is to carry out the usability analysis process of the Ayooklik.com online store system in determining Product Segmentation. The results showed that Ayooklik.com customers were satisfied because the Ayooklik.com system was easy to learn based on percentage of SE = 39.2% and SR = 57% and really useful for customer based on percentage of SE = 23.6% and SR = 34%. Product Segmentation is determined by the goods’s price which it’s percentage of SE reaches 57.7% and SR reaches 90%.
Intisari— Seiring berjalannya waktu, fungsi market dari konvensional kini telah berkembang menjadi market yang terbaharui yaitu Online Store. Bisnis Online Store saat ini telah didukung oleh strategi pemasaran yang dinamakan Product Segmentation, Dalam pelaksanaan strategi pemasaran tersebut, terkadang tidak berada dalam posisi untuk memuaskan semua pelanggan mereka setiap saat karena tidak semua persyaratan dari setiap customer dapat dipenuhi oleh perusahaan Online Store. Untuk menjawab permasalahan tersebut, solusi yang dapat ditawarkan untuk menyelesaikan masalah tersebut adalah dengan melakukan proses analisis usability terhadap sistem online store Ayooklik.com dalam menentukan Product Segmentation. Hasil penelitian menunjukkan bahwa pelanggan Ayooklik.com puas karena sistem Ayooklik.com mudah dipelajari dengan persentase SE = 39,2% dan SR = 57% dan sangat berguna bagi customer dengan persentase SE = 23,6% dan SR = 34%. Product Segmentation ditentukan oleh harga barang yang persentase SE-nya mencapai 57,7% dan SR mencapai 90%.
Kata Kunci— Customer, Online Store, Product Segmentation, USE Questionnaire, User Experience.
Human needs are mostly met by buying and selling activities called Market. Market is a form of transaction
Philipus Novenando Mamang Weking: User Experience Analysis of…
carried out by the seller and buyer at a certain place under certain conditions. The world of IT (Information Technology) and its development is a necessity that must be possessed by every individual or organization to achieve maximum goals [1]. IT has a close relationship with market development so that in the process, market functions develop into a new form called the Online Store. Online Store is a trading process between sellers and buyers through the internet. The payment process is also done online so that the seller and buyer do not need to meet directly.
The development of online stores in the trading world has helped many business companies, especially the company "Ayooklik.com" by selling a variety of the latest and most recent products online to get a large income. In the course of online store business, companies are sometimes not in a position to satisfy all customers because not all customer desires can be fulfilled. To deal with this, the company adapted a target marketing system called product segmentation where the system divides online stores into several segments. The target to be achieved is to satisfy the customer [2].
The implementation of product segmentation strategy in the online store business "Ayooklik.com" is felt to be not optimal because there is no evidence of user experience data from customers on the use of the online store system "Ayooklik.com". To help with this application, we need an analysis of usability and user experience using the USE Questionnaire. This analysis is intended to find out whether the user experience of using the "Ayooklik.com" online store system has an effect on product segmentation.
-
A. Online Store
Online Store is one part of the trading business process using electronic technology that can reach all aspects [3]. Online Store can connect with each other, both individuals and companies in buying and selling transactions electronically. Online Store in its operation is divided into three types, namely B2C, B2B, and C2C. B2C is an online store that carries out product sales transactions to customers [4] [5]. B2B is a type of online store that only involves intercompany product services with the aim of increasing revenue and building good cooperation between companies. C2C is a type of online store that involves fellow customers.
-
B. Usability Analysis
Usability Analysis is a way of analyse variables in usability to determine the quality of a system's feasibility [6] [7].
p-ISSN:1693– 2951; e-ISSN: 2503-2372

Measurement of the feasibility of usability can be done by conducting direct tests which involving customers [8]. Testing the feasibility of an application system can also be done by assessing and analysing the user interface system in the application [9].
-
C. User Experience
One of determining a feasibility value in a usability analysis is to measure the feasibility from the point of view of the customer / user experience in using the application. One way to obtain user experience data from customers is to compile a questionnaire based on parameters and related variables [10]. The questions compiled in the questionnaire contain the role of the customer how the customer understands the use of the application system [11]. The association of user experience with satisfaction variables with the assumption that if the results of analysis of customer satisfaction value is greater, then the system assessed will get a large value of eligibility [12]. In addition to the application system, the role of user experience can be used to find out which products often sell along with the customer's experience using products purchased from online stores [13]. The difference between usability analysis and user experience is from angle point of it’s function. Usability analysis is used for analyze the function and feature of the online store through a customer who use the system. While user experience is a way to know how satisfied a customer through the experience that customer felt when using an online store.
-
D. Market Segmentation
Companies need to use appropriate marketing strategies to promote and sell products specifically aimed at increasing market value. One such strategy is market segmentation. The main reason why this market segmentation is used is to make it easier to meet the needs of smaller customer groups, especially if they have many characteristics in common [14].
-
A. Data Collection Method
In this study, the data used were questionnaire data from respondents of 55 samples distributed to customers who use the Ayooklik.com online store system. The type of questionnaire in this study was divided into two. The first questionnaire contained about the user experience of the customer regarding the use of the Ayooklik.com online store system. The second questionnaire contained about Product Segmentation where questions were directed to customers of products purchased through Ayooklik.com.
Reference questions on the first questionnaire using the USE Questionnaire. USE Questionnaire is one of the international questionnaire methods used to measure the level of satisfaction of an application system. The form of questions from the USE Questionnaire can be seen in Figure 1.
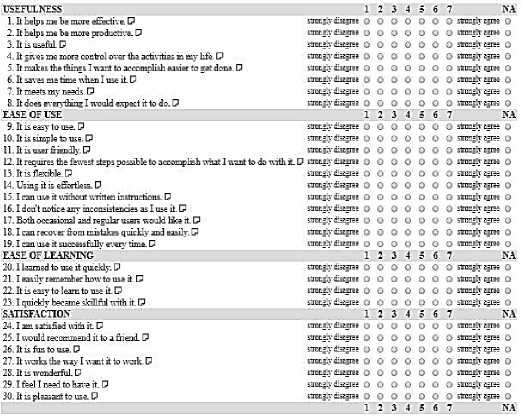
Figure 1. USE Questionnaire (Source: https://garyperlman.com/quest/quest.cgi?form=USE)
In total there are 30 questions outlined in the USE Questionnaire in Figure 1 which is divided into 4 variables, the first three variables namely Usefulness, Ease of Use and Ease of Learning function as independent variables. While the Satisfaction variable has a function as a dependent variable. On the USE Questionnaire there are 7 rating scales that will be filled by the customer.
The second questionnaire is about Product Segmentation which has reference questions from the internet that are related to the segmentation of products sold at the Ayooklik.com online store with a total of 14 questions divided into 4 variables which are Requirement, Quality, and Price are independent variables, while Satisfaction is the dependent variable.
-
B. Research Flow
This research has a process flow to carry out the stages of research. The flow of research is written in the form of design written in Figure 2.
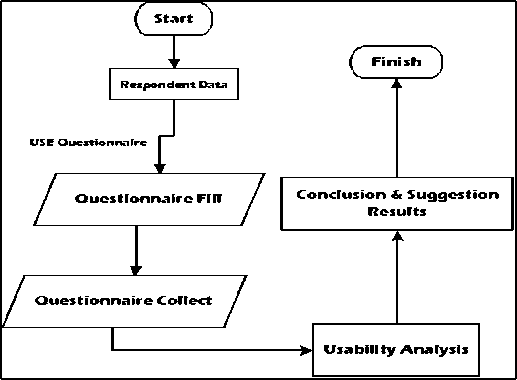
Figure 2. Research Flow
DOI: https://doi.org/10.24843/MITE.2020.v19i01.P03
The process starts by collecting respondent data using USE Questionnaire. The next process is asking respondents to fill out the questionnaire that has been distributed.
Qualified Precentage % =
Observation Score Expected Score
x 100% (1)
The percentage for usability analysis can be determined by using equation (1). The questionnaire was collected after the questionnaire was successfully completed. The questionnaire data will be analyzed and processed the results of the questionnaire so that it will get results which will then be associated with hypothesis verification which showed in Figure 3.
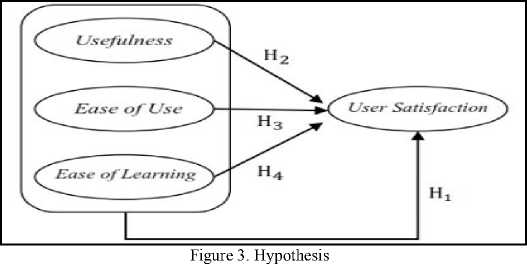
The hypothesis of this research as shown in Figure 3 explained as follows:
-
1. H1: There is a significant influence between the independent variables, namely the usefulness variable, the ease of use variable, and the ease of learning variable on the dependent variable, namely the satisfaction variable which is carried out simultaneously.
-
2. H2: There is a significant influence between the usefulness variable on the dependent variable, namely the satisfaction variable.
-
3. H3: There is a significant effect between the ease of use variable on the dependent variable, namely the satisfaction variable.
-
4. H4: There is a significant effect between the ease of learning variable on the dependent variable, namely the satisfaction variable.
This stage will discuss the analysis results of the questionnaire that has been distributed to respondents. In this study, the number of respondents intended was 55 samples. The questionnaire distributed was divided into two. The first questionnaire is for user experience and the second questionnaire is for product segmentation.
-
A. Percentage of Qualified System
The analysis begins to calculate the percentage of the feasibility of the Ayooklik.com online store system listed on the first questionnaire. The total score obtained from the questionnaire was 8878 and the expected score was 11550.
Based on the formula in equation (3), the percentage obtained was 77% where Ayooklik.com was declared "Qualified" for use.
-
B. F Test and t Test
Next analysis step is by testing the F test and t test on both questionnaires. This test is conducted to determine whether there is an influence of the independent variables on the dependent variable. F test was carried out to determine the effect simultaneously and t test was carried out to determine the effect partially.
TABLE I
First Questionnaire F Test
_______⅛no≡_______
|
Model |
Sumof Squares |
!it |
Mean Square |
F |
Sig. |
|
1 Regression Residual Total |
2134.565 944.416 3078.982 |
3 51 54 |
711.522 18.518 |
38.423 |
.000b |
a. Dependentvariable: TOTAL_4
b. Predictors: (Constant), TOTAL_3, TOTAL_1, TOTAL_2
TABLE II
Second Questionnaire F Test
______________________________ANOVAi___________
|
Model |
Sumof Squares |
!it |
Mean Square |
F |
Sig. |
|
1 Regression Residual Total |
149.903 89.806 239.709 |
3 51 54 |
49 968 1.761 |
28.376 |
.000“ |
a. Dependentvariable: Tota l_4
b. Predictors: (Constant), Total_3,Total_1, Total_2
In the F Test on Table I and Table II, the influence of the independent variable with the dependent variable can be seen in two ways, namely the significance value and the value F. The independent variable is said to have a simultaneous effect if the Sig. <0.05 and calculated F value> F table value (2.79). Sig. Value in the first and second questionnaires are both 0,000 where the value is smaller than the standard Sig. The calculated F value from the first questionnaire (38,423) and the second questionnaire (28,376) is greater than the F table's value. From these results it can be concluded that the independent variables on both questionnaires have a significant effect on the dependent variable simultaneously.
TABLE III
First Questionnaire t Test
Philipus Novenando Mamang Weking: User Experience Analysis of…
p-ISSN:1693– 2951; e-ISSN: 2503-2372

|
Variable |
t Table Value |
t Value |
Sig. |
|
TOTAL_1 (Usefulness) |
2,008 |
2,507 |
0,015 |
|
TOTAL_2 (Ease of Use) |
0,496 |
0,622 | |
|
TOTAL_3 (Ease of Learning) |
3,394 |
0,001 |
TABLE IV
Second Questionnaire t Test
|
Variable |
t Table Value |
t Value |
Sig. |
|
Total_1 (Needs) |
2,008 |
1,181 |
0,243 |
|
Total_2 (Quality) |
0,049 |
0,961 | |
|
Total_3 (Price) |
7,598 |
0,000 |
Partial influence testing with t test is done by each independent variable on the dependent variable. Significantly, the first questionnaire in Table III shows the TOTAL_1 (Usefulness) and TOTAL_3 (Ease of Learning) variables had an influence on TOTAL_4 (Satisfaction) because they had a significance value below 0.05, while the TOTAL_2 variable (Ease of Use) has no effect on TOTAL_4 (Satisfaction) because the significance value is above 0.05. The results of the second questionnaire in Table IV shows that only the Total_3 (Price) variable has an influence on the Total_4 (Satisfaction) variable. Conversely, the variables Total_1 (Needs) and Total_2 (Quality) partially do not affect the variable Total_4 (Satisfaction) because the significance value is above 0.05.
-
C. Percentage of Influence Between Variables
Percentage calculations are performed to find out how much the contribution of influence held by the independent variable to the dependent variable. The percentage can be determined and tested by means of simultaneous (Coefficient of Determination) and partial (Effective Donations and Relative Donations.
-
1) Coefficient of Determination (R-Square)
The coefficient of determination or R-Square is a way to calculate the percentage of influence between variables simultaneously. The main requirement to use this method is that the significance value must be less than 0.05 and the calculated F value must be greater than the F value of the table.
TABLE V
First Questionnaire R-Square
means of the value of R-Square x 100%. The first questionnaire had an R-Square percentage of 69.3% and the second questionnaire had a percentage of 62.5%. These results indicate that simultaneously, the magnitude of the influence of independent variables on the dependent variable in the first questionnaire was 69.3%. On the other hand, the second questionnaire had 62.5% influence of the independent variables on the dependent variable simultaneously.
-
2) Effective Donations (SE) and Relative Donations (SR)
Effective Donations and Relative Donations is a way to calculate the percentage of influence of independent and bound variables partially. Effective Contributions are aimed at knowing which independent variables most dominate the dependent variable, and Relative Contributions are intended to determine the contribution of the influence of independent variables with dependent variables separately. The requirement to calculate the SE and SR values is to have the results of correlation and regression data from the two questionnaires as shown in Table VII and Table VIII.
TABLE VII
First Questionnaire Correlations Value
Correlations
|
TOTAL_1 |
TOTAL_2 |
TOTAL_3 |
TOTAL_4 | |
|
T0TAL-1 Pearson Correlation Sig. (2-tailed) N |
1 55 |
.795” .000 55 |
.699” .000 55 |
.735” .000 55 |
|
TOTAL_2 Pearson Correlation Sig. (2-tailed) N |
.795” .000 55 |
1 55 |
.846” .000 55 |
.760" .000 55 |
|
T0TAL_3 Pearson Correlation Sig. (2-tailed) N |
.699” .000 55 |
.Θ46" .000 55 |
1 5 5 |
.792” .000 55 |
|
T0TAL_4 Pearson Correlation Sig. (2-tailed) N |
.735” .000 55 |
.760" .000 55 |
.792” .000 55 |
1 55 |
Correlation is significant at the 0.01 level (2-tailed).
Model Summary0
|
Model |
R |
R Square |
Adjusted R Square |
Std. Error of the Estimate |
|
1 |
833a |
.693 |
.675 |
4 303 |
a. Predictors: (Constant), TOTAL_3. TOTAL_1, TOTAL_2
b. DependentVariable:TOTAL_4
TABLE VI
Second Questionnaire R-Square
Model Summary
|
Model |
R |
R Square |
Adjusted R Square |
Std Errorofthe Estimate |
|
1 |
791' |
.625 |
.603 |
1.327 |
a. Predictors: (Constant), Total_3. Total_1. Total_2
The value of R-Square from Tabel V and Table VI if calculated manually can be obtained from the square of the value of R. The percentage of R-Square can be obtained by
TABLE VIII
Second Questionnaire Correlations Value
Coiieldtions
|
Total_1 |
Total_2 |
Total_3 |
Total_4 | |
|
Total 1 Pearson Correlation |
1 |
.497” |
.363” |
.389” |
|
Sig. (2-tailed) |
.000 |
.006 |
.003 | |
|
N |
55 |
55 |
55 |
55 |
|
Total_2 Pearson Correlation |
.497” |
1 |
.438" |
.387” |
|
Slg. (2-tailed) |
.000 |
.001 |
.003 | |
|
N |
55 |
55 |
55 |
55 |
|
Total 3 Pearson Correlation |
.363” |
438" |
1 |
.783” |
|
Sig. (2-tailed) |
.006 |
.001 |
.000 | |
|
N |
55 |
55 |
55 |
55 |
|
Total_4 Pearson Correlation |
.389” |
.387“ |
.783” |
1 |
|
Slg. (2-tailed) |
.003 |
.003 |
.000 | |
|
N |
55 |
55 |
55 |
55 |
Correlation is Significantatthe 0.01 level (2-tailed).
In the process of SE and SR values, the correlation results on each variable are expected to have valid values. Search for percentage of influence based on SE can be obtained by using the formula in Equation 1.
DOI: https://doi.org/10.24843/MITE.2020.v19i01.P03
SE (X) = Betax X rxy x 100% (2)
Where:
SE (X) = Effective Donations
Betax = Regression Coefficients Value
rxy = Correlation Coefficients Value
Search for SR values can be done after the results of the SE values have been obtained. The SR value can be obtained using the formula in Equation 2.
Effective Donations (SE)%
SH(X)% = -------------------- (3)
^Square
Where:
SB(X)% : Relative Donations (%)
Effective Donations (SE) % : Effective Donations (%)
^Square : R-Square Value (%)
Based on the formula in equation (2), the results of the SE for the first questionnaire can be seen in Table IX. The results for the second questionnaire are obtained in Table X.
of the second questionnaire showed that the variable Total_3 (Price) had the most dominant influence at 57.7%. The percentage of SE of each independent variable when added together the results will be the same as the percentage of the R-Square value.
TABLE XI
First Questionnaire SR Results
|
Variable |
Effective Donations (SE) % |
R-Square Value (%) |
SR Value Results (%) |
|
TOTAL_1 (Usefulness) |
23,6% |
69,3% |
34% |
|
TOTAL_2 (Ease of Use |
6,5% |
9% | |
|
TOTAL_3 (Ease of Learning) |
39,2% |
57% |
TABEL XII
Second Questionnaire SR Results
|
Variable |
Effective Donations (SE) % |
R-Square Value (%) |
SR Value Results (%) |
|
Total_1 (Needs) |
4,6% |
62,5% |
7% |
|
Total_2 (Quality) |
2,0% |
3% | |
|
Total_3 (Price) |
57,7% |
90% |
TABLE VX
First Questionnaire SE Results
|
Variable |
Regression Coefficients Value |
Regression Coefficients Value |
SE (%) |
|
TOTAL_1 (Usefulness) |
0,322 |
0,735 |
23,6% |
|
TOTAL_2 (Ease of Use) |
0,085 |
0,760 |
6,5% |
|
TOTAL_3 (Ease of Learning) |
0,495 |
0,792 |
39,2% |
TABEL X
Second Questionnaire SE Results
|
Variable |
Regression Coefficients Value |
Correlation Coefficients Value |
SE (%) |
|
Total_1 (Needs) |
0,119 |
0,389 |
4,6% |
|
Total_2 (Quality) |
0,005 |
0,387 |
2,0% |
|
Total_3 (Price) |
0,737 |
0,783 |
57,7% |
The results in Table IX and Table X show the percentage of influence of each independent variable on the dependent variable based on equation (3). In the first questionnaire, the TOTAL_3 variable (Ease of Learning) had the most dominant influence on Satisfaction in the amount of 39.7%. The results Philipus Novenando Mamang Weking: User Experience Analysis of…
p-ISSN:1693– 2951; e-ISSN: 2503-2372

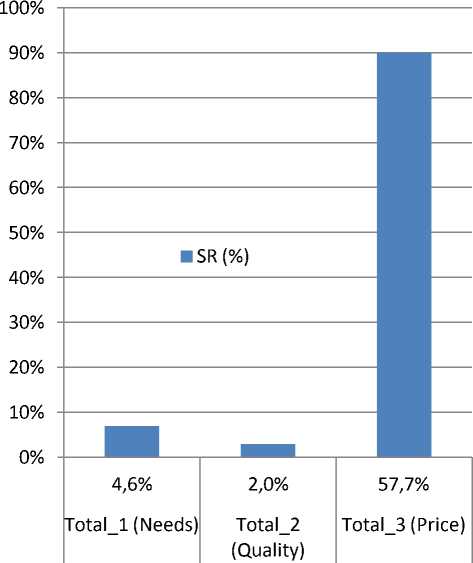
Figure 5. Second Questionnaire’s Graphics Results of SE & SR Values
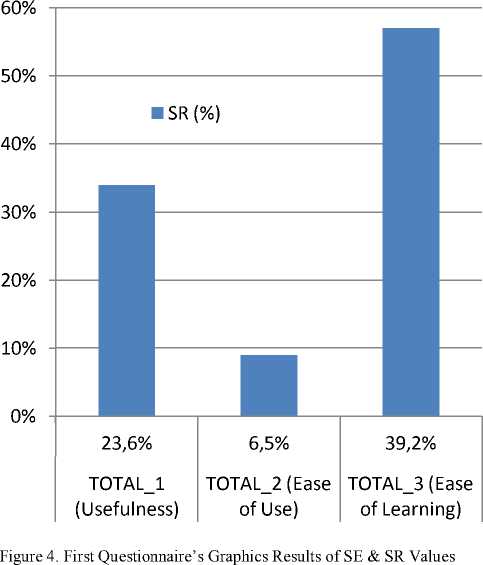
Based on the formula in Equation 2, the results in Table XI and Table XII show how much influence the contribution of each independent variable has on the dependent variable. The percentage when added together will equal 100%. The first questionnaire showed that the TOTAL_3 variable (Ease of Learning) had the greatest influence contribution at 57% as shown in Figure 4. Whereas the second questionnaire showed that the variable Total_3 (Price) had the biggest influence contribution, namely 90% as shown in Figure 5.
-
D. Hypothesis Testing
Based on the calculation results of the tabulated data, the next step is testing the hypothesis based on the results of the questionnaire as outlined in Figure 3. In the first questionnaire, the test is described as follows:
-
1. Hypothesis Testing (H1): Proving the truth of the H1 hypothesis is done by testing the independent variables and the dependent variables simultaneously. The calculation results in Table I show that the significance value is below 0.05 and the calculated F value is greater than the F table value. These results show that the hypothesis H1 namely the variable Usefulness, Ease of Use, and Ease of Learning affect the satisfaction variable, accepted.
-
2. Hypothesis Testing (H2): Proving the truth of the H2 hypothesis is done by testing the independent variable (usefulness) and the dependent variable (satisfaction) partially. The calculation results in Table III show that the significance value is below 0.05 and the t value is greater than the t table value. These results show that the H2 hypothesis that the Usefulness variable influences the satisfaction variable, is accepted.
-
3. Hypothesis Testing (H3): Proving the truth of H3 is done by testing the independent variable (ease of use) and the dependent variable (satisfaction) partially. The calculation results in Table III show that the significance value is above 0.05 and the t value is smaller than the t table value. These results show that the H3 hypothesis that the Ease of Use variable affects the satisfaction variable, is rejected.
-
4. Hypothesis Testing (H4): Proving the truth of H4 is done by testing the independent variable (ease of learning) and the dependent variable (satisfaction) partially. The calculation results in Table III show that the significance value is below 0.05 and the t value is greater than the t table value. These results show that the H4 hypothesis that the Ease of Learning variable influences the satisfaction variable, accepted.
Furthermore hypothesis testing is applied to the second questionnaire. Based on the results of calculations that have been done, the results of hypothesis testing are described as follows:
-
1. Hypothesis Testing (H1): Proving the truth of the H1 hypothesis is done by testing the independent variables and the dependent variables simultaneously. The calculation results in Table II show that the significance value is below 0.05 and the calculated F value is greater than the F table value. These results show that the hypothesis H1 namely the variable Needs, Quality, and Price affect the variable Satisfaction, accepted.
-
2. Hypothesis Testing (H2): Proving the truth of the H2 hypothesis is done by testing the independent variable (Need) and the dependent variable (Satisfaction) partially. The calculation results in Table IV show that the significance value is above 0.05 and the t value is smaller than the t table value. These results show that the hypothesis H2 is the variable needs affect the satisfaction variable, rejected.
-
3. Hypothesis Testing (H3): Proof of H3 correctness is done by partially testing the independent variable (Quality) and the dependent variable (Price). The calculation results in Table IV show that the significance value is above 0.05 and the t value is smaller than the t table value. These results show that the hypothesis H3, which is the Quality variable, influences the Satisfaction variable, which is rejected.
-
4. Hypothesis Testing (H4): Proving the truth of H4 is done by testing the independent variable (Price) and the dependent variable (Satisfaction) partially. The calculation results in Table IV show that the significance value is below 0.05 and the t value is greater than the t table value. These results show that the hypothesis H4 is the Price variable influences the Satisfaction variable, accepted.
Based on the results of calculations and percentages that have been carried out simultaneously and partially on both questionnaires, the conclusions that can be drawn from this study are:
DOI: https://doi.org/10.24843/MITE.2020.v19i01.P03
-
1. The percentage of the feasibility of the Ayooklik.com online store system gained 77%. These results state that the Ayooklik.com system is "Qualified" to use.
-
2. The results of the user experience based on an assessment of respondents indicated that the percentage of the highest value of the SE and SR is owned by the variable Usefulness (SE = 23.6% and SR = 34%) and Ease of Learning (SE = 39.2% and SR = 57%). These results indicate that the customer is satisfied with the online store Ayooklik.com because it is easy to learn and very useful for the customer.
-
3. In the second questionnaire, the Price variable is the one which determines a Product Segmentation where the percentage of SE reaches 57.7% and SR reaches 90%. These results indicate that in determining product segmentation, the price of goods becomes a major factor in customer satisfaction.
In addition to the conclusions, there are suggestions for this research, namely the need for more detailed calculation methods and number of respondents was further increased to improve data accuracy.
References
-
[1] H. A. Mumtahana, S. Nita, and A.W. Tito “Pemanfaatan Web Online Store untuk Meningkatkan Strategi Pemasaran”, Jurnal Ilmu Komputer dan Informatika, Vol. 3 No. 1, p. 6-15, 2017.
-
[2] M. A. Camilleri, “Market Segmentation, Targeting and Positioning”, Travel Marketing, Tourism Economics and the Airline Product, Chapter 4, p. 69-83, Springer, Cham: Switzerland. 2018.
-
[3] Sudarma, Made. "Computer Users Perceptions of Indonesian Online Bussines Webpage Based on Human Computer Interface." (2016).
-
[4] D. L. Fithri, A. P. Utomo, and F. Nugraha, “PEMANFAATAN ONLINE STORE POPULER UNTUK OPTIMALISASI PEMASARAN PRODUK PADA KUB BORDIR KURNIA KUDUS”, Jurnal SIMETRIS, Vol. 8 No. 2, p. 819-824. 2017.
-
[5] H. S. Marhamah, and A. Irawan, “SISTEM ONLINE STORE B2C PADA PT. HARAPAN SENTOSA NUSANTARA JAKARTA PUSAT”, Studia Informatika: Jurnal Sistem Informasi, Vol. 9 No. 2, p. 159-167. 2018.
-
[6] B. Aulia M., Saputra S.Kom.,M.T., M. Chandra M.Eng., and A. Pinandito S.T., M.MT, “ANALISIS USABILITY PADA WEBSITE UNIVERSITAS BRAWIJAYA DENGAN HEURISTIC EVALUATION”, Jurnal Teknologi Informasi dan Ilmu Komputer (JTIIK), Vol. 3 No. 3, p. 188-193. 2016.
-
[7] Pradhana, I Gusti Ngurah, I.A.D Giriantari, & Made Sudarma. " Analisis dan Perancangan Sistem Pengelola Data Menuju Implementasi Data Warehouse Untuk Mendukung Administrasi E-Procurement." Majalah Ilmiah Teknologi Elektro [Online], 17.2 (2018): 245-250. Web. 20 Nov. 2019.
-
[8] N. I. Zulkifli., and A. H. Sutomo, " Usability Testing Sistem Informasi Pendonor Darah (Studi Kasus di Unit Pelayanan Transfusi Darah RSUP Dr. Sardjito Yogyakarta)", Journal of Information Systems for Public Health, Vol. 1, No. 1, p. 10-15. 2016.
-
[9] R. Firmansyah, " USABILITY TESTING DENGAN USE QUESTIONNAIRE PADA APLIKASI SIPOLIN PROVINSI JAWA BARAT ", International Conference on Big Data and Cloud Computing, JURNAL SWABUMI, Vol. 6, No. 1, p. 1-7. 2016.
-
[10] T DARMA, I. Gede Wira; UTAMI, Komang Sri; SUDARMA, Made. User Experience Analysis on SSO Portal. International Journal of Engineering and Emerging Technology, 2019, 3.2: 92-96.
-
[11] N. Konduri, etc., " User experience analysis of e-TB Manager, a nationwide electronic tuberculosis recording and reporting system in Ukraine" ERJ Open Research, p. 1-11. 2017.
-
[12] F. Chen, etc., "Virtual Reality for Digital User Experience and Interactive Learning Based on User Satisfaction: A Pilot Study", International Conference on Computational Science and Computational Intelligence ", IEEE, p. 374-377. 2016.
-
[13] F. Muhammad, etc., "Analisis User Experience Untuk Tingkat Keterpilihan Smartphone Android", Kumpulan Jurnal Ilmu Komputer (KLIK), Vol. 04, No. 01, p. 82-91. 2016.
-
[14] S. Daryanti, and K. U. Simanjuntak, "SEGMENTATION OF MOBILE INTERNET USERS IN THE INDONESIAN CONTEXT: INSIGHTS FOR MOBILE INTERNET PRODUCT DEVELOPMENT MANAGEMENT", The South East Asian Journal of Management, Vol. 10, No. 1, p. 95-107. 2016.
Philipus Novenando Mamang Weking: User Experience Analysis of…
p
-ISSN:1693– 2951; e-ISSN: 2503-2372

{ Halaman ini sengaja diksongkan}
ISSN 1693– 2951P Philipus Novenando Mamang Weking: User Experience Analysis of
Discussion and feedback