SOFT AND SOFTER HANDOVER PERFORMANCE OF CDMA
on
Soft and Softer Handover …
Linawati dkk
SOFT AND SOFTER HANDOVER PERFORMANCE OF CDMA
Linawati1, Ngurah Indra Erawan2, Eka Yayuk Fransiska Simak3
Electrical Engineering Department, Udayana University linawati@unud.ac.id1), indra@unud.ac.id2), fransiska_simak@yahoo.com3)
Abstract
One of telecommunication providers in Indonesia applies CDMA2000 1x technology. The technology has many advantages such as larger channel capacity of BTS (Base Transceiver Station). On the other hand, the capacity depends on user’s density. Therefore to guarantee voice connection when user or mobile station (MS) is always moving from one cell to others, handover technique is needed. However the technique can be failed for many reasons. Therefore impact of call attempt on softer and soft handover performance is investigated. Hence the paper examined soft – softer handover performance of CDMA in BTS (Base Transceiver Station), BSC, and Sectors in both sub-urban and rural areas in Denpasar, Bali with area code of 0361.
The research has been done in rural and suburban area with call area code ‘0361’. The analyses included regression and simple linear correlation applications. The results showed that number of call attempts affected the failure of soft and softer handover technique dominantly. Generally, average level of success both handover in both rural and suburban area were about 99% which are above KPI (Key Performance Indicator) reference at 98.50%. However in rural area, other factors such as blocking called attempt and error called number have caused the softer handover failure.
Keywords: Softer Handover, Soft Handover, Call Attempt, Handover Performance
CDMA technology has offered efficient frequency usage. The main difference between CDMA and other technologies is that on the radio path that it does not use either FDMA or TDMA [1]. Furthermore, CDMA provides many other features, such as soft and softer handover or handoff. To perform those tasks, a MS (Mobile Station) might use more than one BS (Base Station) operating at the same carrier frequency, at the same time with the different codes. Multiple BSs receive a signal from the MS simultaneously and the MS combines signals received from different BSs. The MS does not need to switch over from one BS to another at a certain time instant as is done with the hard handover in FDMA/TDMA networks. Therefore hard, soft, and softer handover in mobile communication have an important role to provide good quality of service (QoS) to users.
Many factors cause the handover failure, such as increases of call attempt and capacity of BTS/sector. Hence the paper investigates soft – softer handover performance of CDMA in some BTS (Base Transceiver Station), BSC, and Sectors in both suburban and rural areas in Denpasar, Bali with area code of 0361. Sub-urban area that are investigated, i.e. Yantel in Teuku Umar, Teuku Umar, Renon, Kaliasem, Ubung, Jimbaran, Kuta, Seminyak, and Legian. BTS in Pelaga, Petang, Payangan, and Tampak Siring are evaluated as rural area representation. The investigations focus on correlation of the handover failure level between
sectors, BTSs, and BSCs that are based on softer and soft handover data from January 2009 until April 2009. The aim is to describe performance of CDMA services in sub-urban and rural areas.
Handover is one feature of a cellular system that guarantee continuous communication for mobile users or Mobile System (MS). It guarantees smooth frequency changes of MS when it moves from one cell to other cell. The changes occur very fast from 200 ms to 300 ms. Handover is needed when received signal strength Eb/No of MS is less than a threshold value. Handover can be classified based on field strength and carrier to interference (C/I) factors. Threshold values are -100 dBm in noisy system and -95 dBm in interference system. Threshold value of C/I for handover is 18 dBm.
According to Toni Janevski [2], there are hard handover and soft handover. Soft handover can be classified into soft handover, softer handover, and soft-softer handover. Hard handover, as seen in figure 1 is the fastest and simplest mechanism. MS is disconnected with originating BTS then connected to new BTS. It is happened when MSC or the frequency CDMA channels are changes. As a result the mechanism is called “break before make”. Therefore packet loss is possibly occurred.
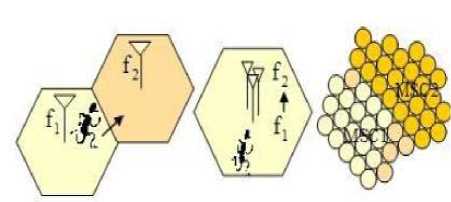
Figure 1. Hard Handover Mechanism [2]
On the other hand, soft-handover is the effective way to increase CDMA capacity and performance. Soft handover occurs as soon as MS moves to other BTS which has the same frequency channel. The communication with originating BTS is not broken when MS arrives in new BTS. Hence BTS or cells can serve MS in handover phase. The mechanism can be called make – before – break switching function. Originating cell will be disconnected as soon as MS is fully served by new cell. Soft handover, shown in figures 2 and 3, only needs small power in its implementation between BTS, BSC, MSC using IMR (inter MSC Router). Softer handover mechanism is the same as soft handover mechanism except it applies from sector to sector in one BTS. Figure 4 shows softer handover mechanism.
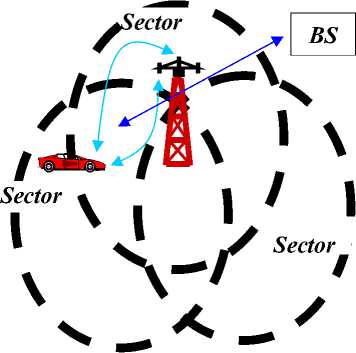
Figure 4. Softer Handover Sector to Sector [3]
If hard handover mechanism does not perform fast, connection quality of service (QoS) will decrease below threshold. This will cause disconnect communication. Average success of hard handover can be calculated as [4]:
Avr _ Succ = —Frq _ Ho— x100% Call _ Attempt
(1)
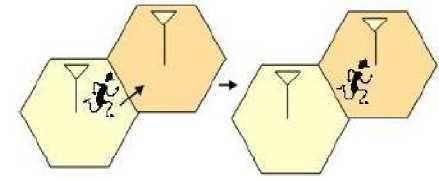
Figure 2. Soft Handover BTS to BTS
Where Avr_Succ is an average success of handover, Frq_Ho is Handover frequency, and Call_attempt is number of call attempt. On the one hand, failure of hard handover can be obtained as:
Handover fail = call_attempt
– freq_Ho ..…….. (2)
Where Handover fail is average of handover failure. Furthermore, average of soft handover success can be written as:

Figure 3. Soft Handover BSC
(Add Ho + Drp Ho) Avr_Succ = —---=-----—--—x100%..... (3)
Call _ Attemp + Drp _ Att
Where Drp_Att is number of dropped attempted by BTS, Add_Ho is number of additional handover, and Drp_Ho is number of dropped handover. However, number of soft handover failure can be seen as:
Handover fail = call_attempt – add_Ho …....(4)
Handover failure in CDMA is the main factor of dropped calls. The failure is caused by following factors, such as increase of call attempt, high interferences, signal propagation, unidentified destination BTS, overcapacity of destination channel, ping pong effect between originating cell and destination cell, and multipath fading effect.
The effect of soft and softer handoffs on CDMA system capacity was evaluated for unsectorized and sectorized hexagonal cells according to an average bit energy-to-interference power spectral density, which corresponds to a biterror rate (BER) of 10-3 [5]. The effect of imperfect sectorization on sectorization efficiency was also considered. The application of soft and softer handoffs improves not only the forward-link capacity, but also the signal-to-interference ratio (SIR) for mobile near the cell and sector boundaries. Both improved the efficiency to 0.97. In addition, the Double Adjustment Soft-Handoff (DASH) scheme is proposed in [6] to support seamless service regardless of the shortage of resource and maximize the resource efficiency when real-time streaming services are served in CDMA-based ITSs (Intelligent Transportation Systems). The performances of the DASH scheme were evaluated with respect to the blocking probability, the handoff failure probability, and the carried traffic. In order to reduce handover delay caused by handover failure, radio resource was reserved for handover users not only at target cell, but also at prepared cells [7]. A new resource reservation scheme for handover users to achieve fast handover failure recovery and efficient radio resource utilization was proposed. Furthermore, the effect of soft handover margin and characteristic parameters of the radio propagation environment on the soft handover performance was investigated in [8]. They have shown that handover performance depends upon characteristic parameters-path loss exponent, standard deviation, correlation coefficient of the shadow fading, window size and soft handover margin. In [9], balancing the forward link and reverse link, adjusting the parameters such as the distance and direction between mobile station and base station, the relationship between the soft handover add threshold of marcocell system and the load factor of microcell system was analyzed quantitatively, and their corresponding performances were simulated in both time domain and frequency domain. The results were shown: the variance of distance is more sensitive to the soft handover performance than the variance of direction does. Finally, a wideband CDMA testbed for the purpose of verifying an International Mobile Telecommunications-2000 (IMT-2000) system was developed [10]. The testbed had capabilities of soft handover (SHO) with an algorithm based on the received SIR. An urban area and a suburban area were chosen for field experiments.
Performance analysis of CDMA handover has been done for all sectors, BTS, and BSC in service area of Denpasar, Bali, Indonesia with area code 0361. Data which has been collected as samples, are
sectors data; BTS and BSC handover data with high number of users such as BTS of Kaliasem (BTS_ID 00, BSC_ID 05), BTS of Ubung (BTS_ID 01, BSC ID 5), BTS of Teuku Umar, BTS of Yantel Teuku Umar and STO of Renon (BTS_ID 00, 01, 02, BSC_ID 06), BTS of Legian, Kuta, Jimbaran, and Seminyak (BTS_ID 00, 01, 03, 04 dan BSC_ID 7); and BTS with low number of users such as BTS of Tampak Siring, Petang and Payangan (BTS_ID 00, 03, 10, BSC_ID 02).
Additionally, following data are needed in investigating the performance:
-
- Number of BTS in the service area with code area 0361;
-
- Characteristic and capacity each BTS;
-
- Position and mapping all BTS;
-
- Handover characteristic of BTS;
-
- Number of call attempted, number of drop call attempted, number of soft handover and soft handover, number of softer and soft handover drop of all BTS;
-
- User occupancy data of BTS.
Subsequently, the investigation has been accomplished through calculation of BTS capacity; its occupancy during busy period; and soft and softer handover failure data for four months, from January 2009 to April 2009. Then impact of call attempt number to the failure of soft and softer handover is examined. Finally, the performance is compared to KPI (key performance indicator) of the success is 98.5% and the failure is 2%. (National standard produced by Telecommunication Company).
Total CDMA BTS with area code 0361 in Bali is 21 BTS in Badung Regency, 27 BTS in Denpasar city, 18 BTS in Gianyar Regency, and 10 BTS in Tabanan Regency. Location of BTS is classified into three areas, i.e. rural area, sub-urban area, and urban area. The location is defined as a rural area if the location is in the village and distance between BTS is more than 5 km. If the distance between BTS is less than or around 2.5 km, then the location is called suburban area. Each BTS has three sectors, i.e. alpha, betha, and gamma (α, β, and ), which each sector has 126 traffic channels. Figure 5 presents locations of BTS with its sectors.
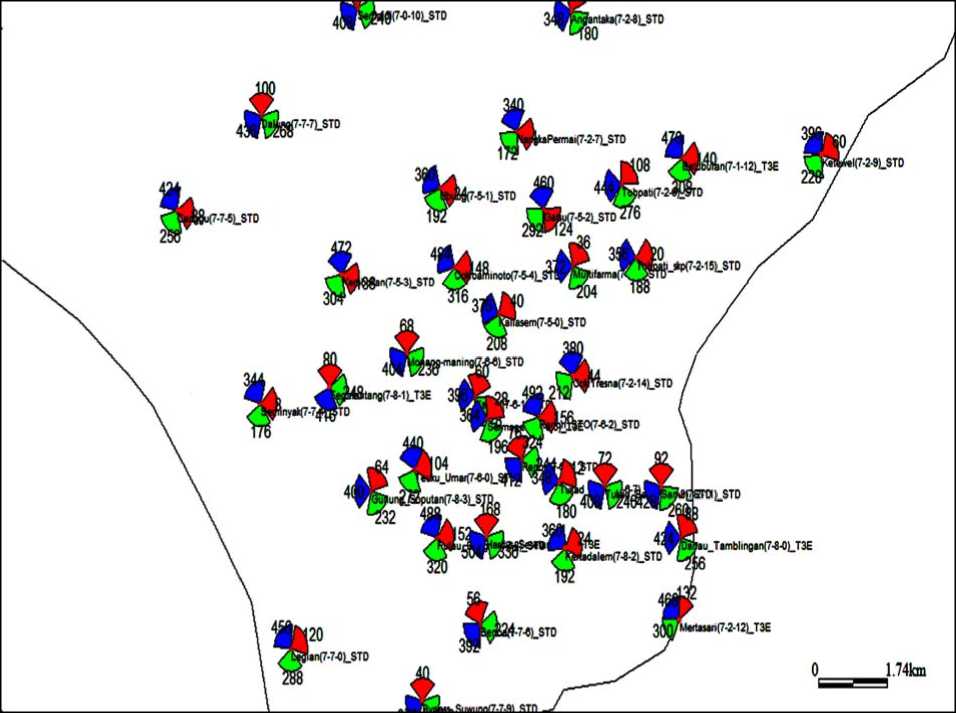
Figure 5. Map of BTS with 0361 area code
The results show that BTS occupancy in suburban area is above 80% during busy hour. It is above loading normal of 75%. Busy hour is defined from 11.00 am to 12.00 am. However BTS occupancy in rural area is below 15%. It is extremely below loading normal value of 75%. On the other hand, one BTS has capability to serve 276 users or 92 users per sector with maximum 324 transmission channels. Assume that traffic model is Erlang B with GoS of 2%, then sector capacity is 80.24 Erlang. As a result total capacity of BTS is 240.74 erlang.
Average success level of softer handover in rural area is 99.62%. The level is greater than KPI level of 98.5%. Hence the performance of the handover in rural area is good, as shown in figure 6. Linear regression has been applied to examine a relationship between call attempt and softer handover performance.

Figure 6. Success Level of Softer Handoff in Rural Area
The results show that there is linear relationship between number of call attempt and softer handover failure. Value of 30.7% proves that the percentage of number of call attempt is siginificantly effected the failure.
The remainder of 69.3% shows that the failure is effected by other factors, for example wrong called number.
Success level of softer handover in suburban area is 99.46% and it is larger than KPI level. Figure 7 displays success level of softer handover in sub-urban area. Linear regression analysis results value of 57.8% which proves important relationship between number of call attempt with softer handover failure level. The remainder of 42.2% shows that the failure is effected by other factors, for example wrong called number.

Figure 7. Success Level of Softer Handoff in Sub-urban Area
Success level of soft handover performance of BTS in suburban area is 99.35% that is greater than KPI level, as seen in figure 8. Moreover linear regression calculation has proved that 28.3% of the failure is effected by number of call attempt. The remainder is effected by other factors.
—BTS 00 —∙—BTS 01 BTS 02 BTS 03 —■—BTS 04
Figure 8. Success Level of Soft Handover of BTS in Suburban Area
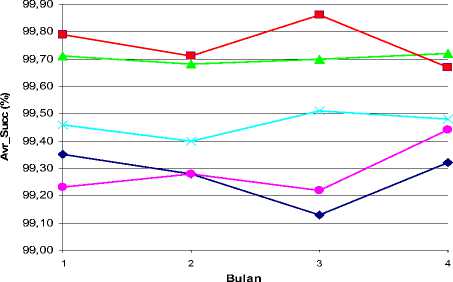
Conversely, success level of soft handover performance of BTS in rural area is 98.73% that is greater than KPI level, as seen in figure 9. Moreover linear regression calculation has proved that 84% of the failure is effected by number of call attempt. The remainder is effected by other factors.

Figure 9. Success Level of Soft Handover Performance of BTS in Rural Area
Success level of soft handover performance of BSC in suburban area is 98.98% that is greater than KPI level, as seen in figure 10. Moreover linear regression calculation has proved that 58.40% of the failure is effected by number of call attempt. The remainder is effected by other factors.
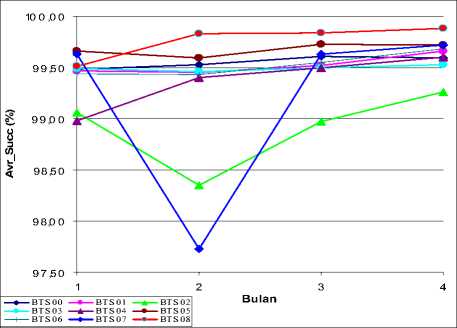
Figure 10. Success Level of Soft Handover of BSC in Suburban Area
Success level of soft handover performance of BSC in rural area is 98.63% that is greater than KPI level, as seen in figure 11. Moreover linear regression calculation has proved that 49.70% of the failure is effected by number of call attempt. The remainder is effected by other factors.
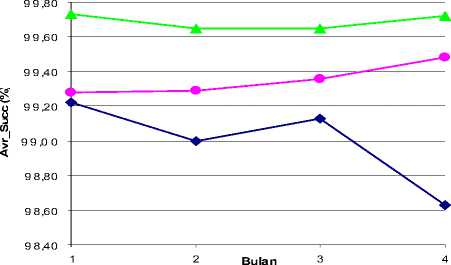
∈BTS 00 —∙—BTS 03 —A BTS 10
Figure 11. Success Level of Soft Handover of BSC in Rural Area
Finally, soft and softer handover performance analysis on both suburban and rural areas results that success values are greater than KPI level. However the value has not reached 100% due to other aspects. The aspects are for examples user’s errors, bad frame, error of PN table, etc.
The results showed that number of call attempts were the main factor of soft handover and softer handover failures. In general average level of success both handover in rural and suburban area were about 99% which were above national KPI (Key Performance Indicator) reference at 98.50%. However, the results showed that especially in rural area, other factors such as blocking called attempt and error called number have caused the softer handover failure.
-
[6] . Young-uk Chung and Dong-Ho Cho, “Enhanced Soft-Handoff Scheme for Real-Time Streaming Services in Intelligent Transportation Systems Based on CDMA”, IEEE Transactions on Intelligent Transportation Systems, Vol.7, No.2, June 2006, pp. 147 – 155.
-
[7] . Mingju Li, Xiaoming She, Lan Chen, Otsuka, H.,” A novel resource reservation scheme for fast and successful handover”, Personal, Indoor and Mobile Radio Communications, IEEE 20th International Symposium on, 2009, page(s): 556 – 560.
-
[8] . Singh, N.P. Singh, B., “Effects of Soft Handover Margin under various Radio propagation parameters in CDMA Cellular Networks”, Wireless Communication and Sensor Networks, WCSN '07. Third International Conference on, 2007, page 1.
-
[9] . Zhiqiang Zhu, Guangyin Xu, Jian Lian, Junqiang Guo, “Performance Analysis of Soft Handover based on FFT in CDMA System”, Computational Intelligence and Software Engineering, CiSE. International Conference on, 2009, page 1.
-
[10] . Yamaguchi, A. Takeuchi, Y. Watanabe, F. Yokai, T., “Soft handover performance of a wideband CDMA testbed system for IMT-2000”, Vehicular Technology Conference Proceedings, VTC 2000-Spring Tokyo, IEEE 51st, 2000, Vol. 1, page 128.
-
[1] . Anttalainen, Tarmo., “Introduction to
Telecommunications Network Engineering”, ARTECH HOUSE, INC., 2nd edition, 2003.
-
[2] . Janevski, Toni., “Traffic Analysis and Design of Wireless IP Networks Norwood”, Artech House, Inc., 2003.
-
[3] . Stephanus Andy, A.A., “System Design for CDMA part I”, PT Telkom Training Center, Bandung, 2004.
-
[4] . PT. Telkom, 2003.
-
[5] . Chin-ChunLee and Raymond Steele, “Effect of Soft and Softer Handoffs on CDMA System Capacity”, IEEE Transactions on Vehicular Technology, Vol.47, No.3, August 1998, pp. 830 – 841.
Teknologi Elektro
1 1 6
Vol. 9 No.2 Juli - Desember 2010
Discussion and feedback