RSSI Measurement Analysis of Zigbee-Based Wireless Sensor Networks in Various Topologies for Solar Panel Monitoring
on
Majalah Ilmiah Teknologi Elektro, Vol.22, No.2, Juli-Desember 2023
DOI: https://doi.org/10.24843/MITE.2023.v22i02.P14 255
RSSI Measurement Analysis of Zigbee-Based Wireless Sensor Networks in Various Topologies for Solar Panel
Monitoring
Dodi Setiabudi1, Daris Irfan Atmaja2, Dedy Wahyu Herdiyanto3, Gamma Aditya Rahardi4
[Submission: 24-07-2023, Accepted: 20-09-2023]
Abstract— Solar panels require performance monitoring when energy shortages occur in the area. Monitoring solar panels requires a detection device to detect solar panels, including the ACS712 current sensor for monitoring the output current of the solar panel, a DC voltage sensor for monitoring battery performance, and a DHT11 temperature sensor for monitoring the temperature of the solar panel storage battery. The WSN technology that can work is ZigBee communication. This ZigBee communication research uses various topology methods, including star, tree, and mesh topologies. Solar panel monitoring tests are carried out indoors and outdoors. The ZigBee communication device used is the XBee S2C device, which operates at a frequency of 2.4 GHz. From a comparison of various topologies, the mesh topology is a topology with good performance because it has the characteristic of choosing a router with the fastest path to reach the coordinator. It is proven by monitoring solar panels with an optimal distance of 80 m, which is carried out from outdoors with an RSSI value of -84 dBm, a throughput of 0.55 kbps, and a delay of 2.77 ms, producing power for 150 minutes with an average current of 0.14 A, voltage of 9.86 V, and temperature of 31.48°C. The number of disturbances and weather conditions greatly affect signal propagation, which can hamper the data transmission process. Throughput fluctuates due to uncertain weather conditions, and delay fluctuates due to a lot of interference from other radio signals.
Keywords— WSN (Wireless Sensor Nirkabel); RSSI (Received Signal Strength Indicator); ZigBee; Solar Panel; Thinger.IO.
Intisari— Panel surya membutuhkan pemantauan kinerja ketika terjadi kesulitan energi di daerah tersebut. Pemantauan panel surya dibutuhkan alat pendeteksi untuk mendeteksi panel surya diantaranya sensor arus ACS712 untuk pemantauan hasilarus keluaran panel surya, sensor tegangan DC untuk pemantauan kinerja baterai, dan sensor suhu DHT11 untuk pemantauan suhu baterai penyimpanan panel surya. Teknologi WSN yang dapat bekerja adalah komunikasi ZigBee. Penelitian komunikasi ZigBee ini menggunakan metode berbagai topologi antara lain topologi star, tree, dan mesh. Pengujian
pemantauan panel surya dilakukan dari dalam dan luar ruangan. Komunikasi ZigBee yang digunakan adalah perangkat XBee S2C yang beroperasi pada frekuensi 2,4 GHz dari perbandingan berbagai topologi, topologi mesh merupakan topologi dengan kinerja yang baik karena memiliki karakteristik memilih router dengan jalur tercepat untuk mencapai coordinator. Terbukti dengan pemantauan panel surya dengan jarak optimal 80 m, yang dilakukan dari luar ruangan dengan nilai RSSI -84 dBm, throughput 0,55 kbps, dan delay 2,77 ms, menghasilkan daya selama 150 menit dengan arus rata-rata 0,14 A, tegangan 9,86 V, dan suhu 31,48°C. Banyaknya gangguan dan kondisi cuaca sangat mempengaruhi perambatan sinyal sehingga dapat menghambat proses transmisi data. Throughput yang naik-turun terjadi karena kondisi cuaca yang tidak pasti, dan delay yang naik-turun disebabkan oleh banyaknya interferensi dari sinyal radio lainnya.
-
I. INTRODUCTION
One of the developments in industrial technology in the field of information and communication is the Wireless Sensor Network (WSN). WSN consists of several sensors placed in certain places to collect data [2]. WSN is a wireless network consisting of several nodes that are self-configured and used to monitor environmental conditions, such as temperature, sound, vibration, pressure, and movement, by forwarding data to the main network [7]. There are several WSNs that have topologies and protocols; each topology and protocol has its own advantages and disadvantages. JSN can be implemented in various fields, namely agriculture, health, animal husbandry, education, and others [4].
WSN (Wireless Sensor Network) technology is an indispensable communication method for the Internet of Things. Each sensor has different communication needs such as frequency, power consumption, and complexity [8]. The wireless sensor on each sensor node performs the sensing of an object using the IEEE 802.15.4 standard, operating at a frequency of 2.4 GHz. One implementation of the IEEE 802.15.4 wireless standard is the ZigBee communication protocol [6].
ZigBee protocol is characterized by low power consumption, simple network implementation, and reliable data transmission. ZigBee supports multihop communication, so it is ideal for wireless sensor network needs with wide coverage [7]. The ZigBee protocol can support the implementation of wireless sensor network because it can provide longer battery life.
One of the implementations of wireless sensor network is solar panel monitoring. Solar panels are solar power generation systems that function to convert solar light energy
p-ISSN:1693 – 2951; e-ISSN: 2503-2372

into electrical energy. The amount of power generated from this process is determined by the intensity of sunlight, temperature, and the spectrum of sunlight [5].
Previous research conducted by [7] succeeded in developing an RSSI measurement system for wireless sensor network using sensor nodes and coordinator nodes with point-to-point, star, and mesh topologies. Comparing various topologies with sending 100 data packets with a 1-second sending interval. Then, in the previous research conducted by [11], he succeeded in developing a Zigbee technology system in a wide network area with low cost and low power consumption. The methods used are the star, tree, and mesh topology methods.
This study implements ZigBee technology as a communication protocol using 2 sensor nodes, 1 coordinator node, and 2 routers using various topologies, namely, star, tree, and mesh. This study measures distances with RSSI (Received Signal Strength Indicator), throughput, and delay parameters as well as solar panel power measurements using various topology methods to implement solar panel performance monitoring using the thingerIO web as a real-time monitoring medium.
The research results obtained provide a good performance of the ZigBee protocol when compared to star, tree, and mesh topologies, which will be implemented indoors and outdoors. This research has been developed from [7] research, measurement experiments were carried out by developing a network topology that had not been developed before, namely a tree topology. This research has been developed from [11] research, experimental implementation of testing from the outdoors, and a wider network area distance of up to 130 m. Then the results of ZigBee network quality performance on various topologies are mesh topologies. Because the mesh topology is a topology with good performance compared to the star and tree topologies, where the farther the sensor nodes are, the weaker the signal strength received by the coordinator nodes. In testing from indoors, the maximum distance is 27 m, resulting in an RSSI of -91 dBm, an average throughput of 1.42 kbps, and a delay of 1.44 ms, while when testing from outdoors, the maximum distance is 130 m, resulting in an RSSI of -90 dBm, an average throughput of 0.91 kbps, and a delay of 1.77 ms. RSSI quality conditions are greatly influenced by external effects, including weather conditions and other radio wave network interference.
-
A. Wireless Sensor Network (WSN)
A wireless sensor network is a sensor network system connected by a collection of sensors that can perform sensing, processing, and communication. WSNs connected to each other will form a network whose function is to monitor an object [16]. Wireless sensor network can also be made into a system to measure temperature, humidity, pressure, flow velocity, liquid level, and so on and send them to network coordinator node for reprocessing [1]. Can be seen Figure 1 the Wireless Sensor Network Architecture [18].
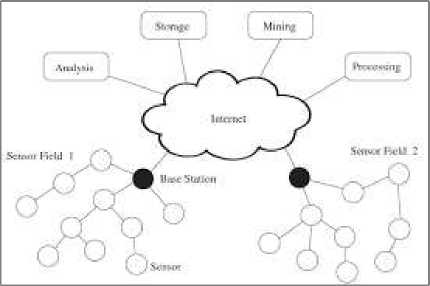
Figure 1: Wireless Sensor Network Architecture
-
B. ZigBee
ZigBee is a set of protocols to support high-level communications that refers to the IEEE 802.15.4 standard for low data rates in short-range industrial wireless networks [15]. The characteristics of ZigBee are very suitable for the implementation of short-range Wireless Sensor Network (WSN) systems operating in the 868 MHz, 915 MHz and 2.4 GHz frequency bands. Maximum data is 250 Kbps [9]. Can be seen Figure 2 the phsical form XBee S2C.
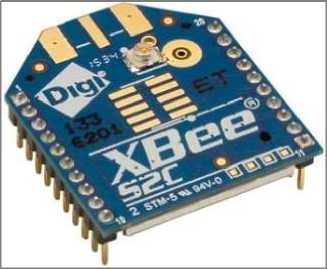
Figure 2: Physical Form the XBee S2C
ZigBee has protocol characteristics at the network layer and application layer determined by the ZigBee specification. The APL layer has three sub-layers, namely application support, application objects, and ZigBee device objects. The application support sublayer connects the network layer with the application layer, while the application object forms an environment to accommodate application objects [17].
Zigbee has the characteristics of a low-rate, low-cost, low-energy-consumption protocol for wireless sensor networks. The amount of sensor data for indoor and outdoor control command services requires low energy consumption [20].
The specifications of this Xbee S2C Module work on the IEEE 802.15.4 standard protocol with a frequency of 2.4 GHz. This wireless module on the data sheet works at a maximum DC voltage of 3.3 V and a current of 50 mA. Receiver Sensitivity (RS) -92 dBm with maximum range coverage in indoor conditions of 80 meters and outdoor conditions of 130 meters [12].
-
C. Solar Panel
A solar cell is a device that converts sunlight energy into electrical energy. Electrical energy produced from solar panels is stored in batteries using the photovoltaic effect process.
Therefore, they are also called photovoltaic cells [19]. Solar panels are very useful where the energy produced is quite large depending on how much power it can generate from the panel and is usually influenced by the sun and the ambient temperature [3]. Solar panels are placed or located outdoors, a good location for solar panels is in a house or other building so that they can get maximum sunlight, but in this study the solar panels were placed by adjusting the position of the test location [13].
-
A. System Block Diagram
The design of the tool in this study is explained with a block diagram in Figure 2. The overall design of the tool is explained using several devices that are adapted to the research conducted by the author. The sensors used are the ACS712 current sensor for monitoring the current generated by solar panels, a DC voltage sensor for monitoring battery storage output, and a DHT11 temperature sensor for monitoring solar panel storage battery temperature.
The sensors are connected directly to the Arduino, which is a microcontroller. Sent data from the solar panel is in the form of sensor data, which is sent to Arduino via jumper pins, and then the sensor data is sent to the XBee S2C device, which is emitted via a radio signal with a frequency of 2.4 GHz. Before the data is sent in the form of packet bits, this program will make the data transferred into data bits, which will be received by XBee S2C device as the coordinating node. Later, the data bits will be broken down automatically so that they can be read by the Arduino, and the data can be read by the XCTU to measure RSSI, throughput, and delay for data retrieval using star, tree, and mesh topology methods. XCTU is software used to configure and test XBee S2C devices. XBee address assignment can configure XBee to be a node coordinator or a node sensor (NS). The XCTU software supports XBee Series and XBee-PRO settings by setting the XBee configuration, so the ZigBee module on the 802.15.4 protocol is ready to be used to transmit data for various topologies with a baud rate of 9600 bps [12]. Then, for monitoring it is serialized via NodeMCU, which will later be sent to the thingerIO.
Then the research flowchart for the design of the entire solar panel monitoring system is shown in figure 4. this figure describes the several stages of overall data collection by determining the performance of solar panels.
The overall research flowchart begins with the initialization of the input sensor. The sensor reads environmental conditions in the form of current, voltage, and temperature. The sensor data is sent to XBee S2C as a coordinating node via XBee S2C as a sensor node, whether it is suitable or not to be forwarded and read back. If yes, it will be forwarded to be uploaded to the thinger. io web, but before uploading, it is confirmed whether NodeMCU is connected to the internet or
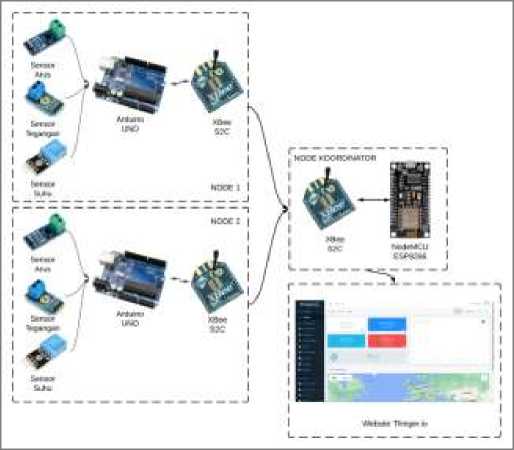
figure 3: system block diagram
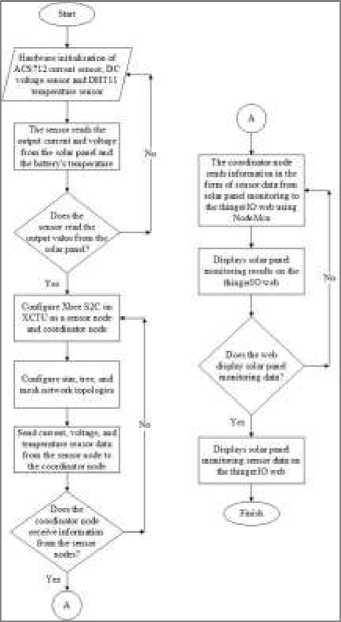
Figure 4: Overall Research Flowchart
not. If not, a network switch will be made. Then the data is sent and distributed to the thingerIO web, which forms a monitoring graph on the thingerIO web automatically.
Dodi Setiabudi: RSSI Measurement Analysis of…
p-ISSN:1693 – 2951; e-ISSN: 2503-2372

-
B. Star Topology Design
Star topology is the most basic topology, where each node is guaranteed to have a direct communication path with the coordinator [14]. The design of the star topology connects the coordinator nodes and sensor nodes. The sensor nodes used are 2 nodes that are connected to the coordinator node but are not connected to other sensor nodes, can be seen in Figure 5.
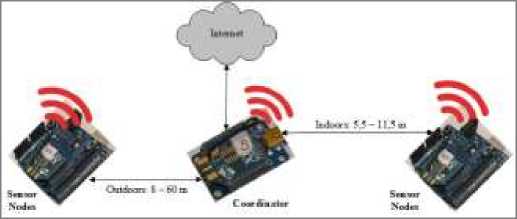
Figure 5: Star Topology Design
The design of the star topology from indoors is taken up to 11 m on NS1 and 11.5 m on NS2, while when measuring from outdoors, the design space is taken up to 55 m on NS1 and 60 m on NS2. The measurement of these conditions can then be measured by the values of rssi, delay, and throughput.
-
C. Tree Topology Design
Tree topology is the most complex topology compared to star topology. Each node still maintains one communication path from the router or gateway to the coordinator, but it is still within that same path [14]. The design of the tree topology connects the coordinator nodes, routers, and sensor nodes 1 sensor node is used that is connected to the router, and 2 routers are connected to the coordinator node, but the routers are not connected to each other, as can be seen in Figure 6.
The design of the tree topology from indoors is taken up to 6.5 m on R1, 9 m on R2, and 18 m on NS, while when measuring from outdoors, the design space is taken up to 40 m on R1, 35 m on R2, and 120 m on NS.

Figure 6: Tree Topology Design
-
D. Mesh Topology Design
Mesh topology is a topology with communication lines that can communicate with other nodes. In a mesh network, nodes maintain a communication path back to the router or gateway, so that if one of the router nodes goes down, the router will automatically pass data through a different path or look for a good transmission path [14]. The design of the mesh topology connects the coordinator nodes, routers, and sensor nodes; the sensor nodes used are 1 node that is connected to the router, and it uses 2 routers that are connected to the coordinator node; where these routers can be connected to each other can be seen in Figure 6.
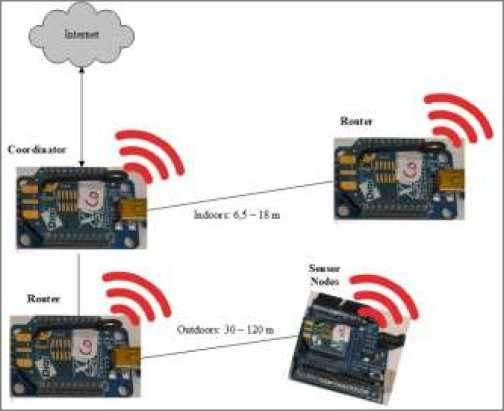
Figure 7: Mesh Topology Design
The design of the mesh topology from indoors is taken up to 10 m on R1, 9 m on R2, and 27 m on NS, while outdoor measurements are taken up to 60 m on R1, 60 m on R2, and 130 m on NS.
-
E. Sensor Node Design
Design of the sensor nodes in this study is used to determine the device that will be used as a node that is used as a sender, which will later function as a sender of monitoring data from solar panels to a receiver that will be used as a coordinator and is at a certain distance determined by the researcher. Sensor node design in Figure 8.
The microcontroller used is Arduino Uno as the brain of this research, where the sensors installed include a DC voltage sensor, an ACS712 current sensor, and a DHT11 temperature sensor, which is placed on the solar panel so that later it can directly monitor the condition of the solar panel.
-
F. Coordinator Node Design
The design of the coordinator node in this study is used as a data receiver to upload sensor values that have been sent by the sender, and then the data is read by the recipient in the form of sensor data values, which will be forwarded into a serial, which will later be uploaded by NodeMCU. When the data is ready to be displayed on the thingerIO web, you will see several monitoring indicators, including current, voltage, and temperature generated by solar panels, along with the design of the coordinator node in Figure 9.
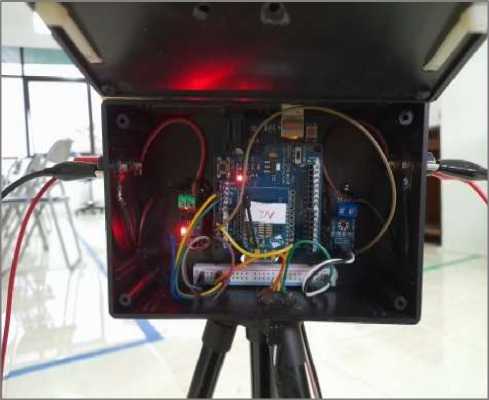
Figure 8: Sensor Node Design
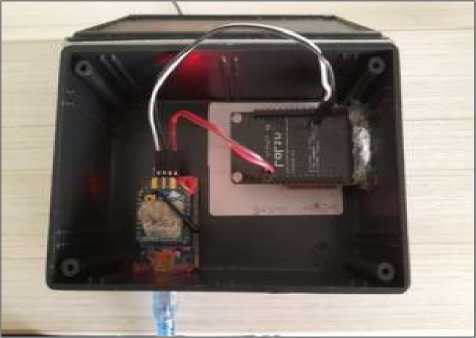
Figure 9: Coordinator Node Design
-
G. RSSI (Received Signal Strength Indicator)
RSSI is a parameter that shows how strong the signal received by a signal receiver is at a certain point [7]. RSSI is defined as the ratio of the signal strength received at a certain point compared to the signal strength at a reference point with units of negative decibel-milliwatts (-dBm). So that mathematically receiving signal strength can be expressed through the following equation,
RSSI =A — 10nΛogd (1)
[10] Information:
n : Path loss exponential value
d : Distance (m)
A : Reference value when the signal strength value is at a distance of 1 m (dBm)
Dodi Setiabudi: RSSI Measurement Analysis of…
The test results are carried out using the RSSI measurement parameters to determine the performance of ZigBee communication from indoors and outdoors, and then the results of testing various topologies will be sent to the coordinator node in the form of a solar panel power value sent by the sensor node so that several distance tests can be compared using the receiving signal strength parameter, throughput, and delay.
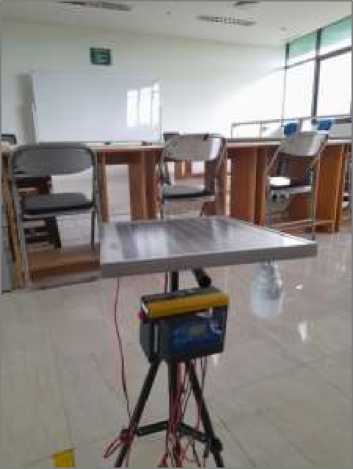
Figure 10: Testing Monitoring Solar Panel
-
A. Test Results Star Topology
The results of the star topology test are generated at sensor nodes 1 and 2 and sent to the coordinator node, which can be seen in the XCTU software to obtain RSSI, throughput, and delay values. It can be seen a star topology testing figure from indoors in Figure 11.
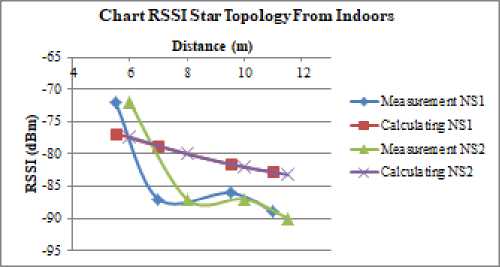
Figure 11: Chart RSSI Star Topology From Indoors
The star topology receiving signal strength test from indoors was obtained four times with a maximum distance of p-ISSN:1693 – 2951; e-ISSN: 2503-2372
up to 11.5 m. Variations in distance obtained on NS1 are 5.5 m, 7 m, 9.5 m, and 11 m, while on NS2 they are 6 m, 8 m, 10 m, and 11.5 m. It can be seen from the receiving signal strength of the comparison graph of the two sensor nodes that the farther the measurement distance, the weaker the receiving signal strength value. With a distance value of 5.5 m and a range of -72 dBm, the value continues to decrease to a distance of 11.5 m with a range of -90 decibel milliwatts (dBm), resulting in an average percent error of 7.13%.
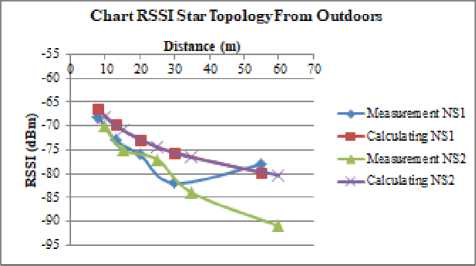
Figure 12: Chart RSSI Star Topology From Outdoors
The star topology of receiving signal strength test from outdoors obtained five tests with a maximum distance of up to 60 m between sensor node 1 and sensor node 2 to the coordinator node. The distances obtained on NS1 are 8 m, 13 m, 20 m, 30 m, and 55 m, while on NS2 they are 10 m, 15 m, 25 m, 35 m, and 60 m. The comparison graph of the receiving signal strength of the two sensor nodes with the results of measurements and calculations shows that the farther the measurement distance, the weaker of receiving signal strength value, with a distance value of 8 m and a range of -68 dBm continuing to decrease to a distance of 60 m with a range of -91 decibel milliwatts (dBm), which results in an average percent error of 5.76 %, can be seen in Figure 11.
After getting the receiving signal strength test value, the measured delay results are obtained during the test. Packet delay of 64 bytes/s, which can be seen in Figure 13 and 14.
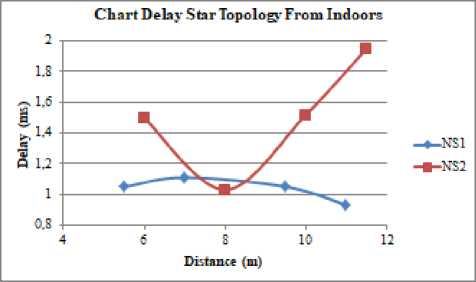
Figure 13: Chart Delay Star Topology From Indoors
The results of the indoor star topology delay test show that NS1 is smaller than NS2 because its distance from the coordinator node is closer. The comparison graph of the delay of the two nodes is very different because the NS2 test point is in a busy network traffic condition. The results of the delay measurement received by the coordinating node will be
slightly longer, with a distance of 5.5 m and a delay of 1.05 ms, continuing to decrease to a distance of 11.5 m and a delay of 1.92 ms.
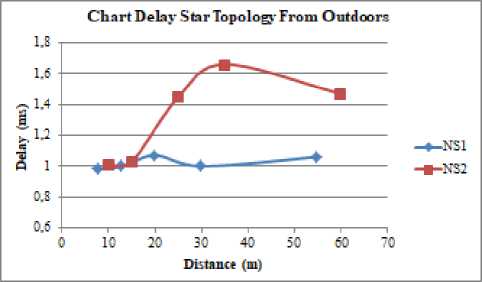
Figure 14: Chart Delay Star Topology From Outdoors
The results of the star topology delay test from indoors can be analyzed to show that during the 4th test it produces a greater NS2 delay than the other tests, namely 1.66 ms. This is because the NS2 measurement conditions of the 4th test occur due to unwanted signal noise in the form of frequency from another radio. The comparison graph of the delay of the two sensor nodes is very different because the NS2 test point is in a busy network traffic condition. The results of the delay measurement received by the coordinating node will be slightly longer with a distance of 8 m and a delay of 0.98 ms, continuing to decrease to a distance of 60 m with a 1.47 ms delay.
After getting the RSSI and delay test values, the throughput results are obtained with a packet throughput of 64 bytes/s, which can be seen in Figure 15 and 16.
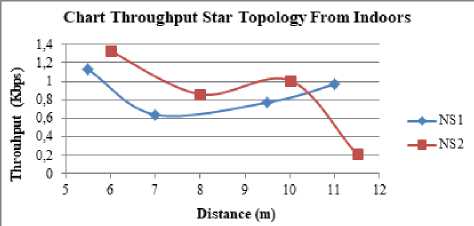
Figure 15: Chart Throughput Star Topology From Indoors
Throughput test results from indoors can be analyzed to show that NS1 is smaller or slower than NS2 in each test due to busy network traffic between NS1 and the coordinator node. The comparison graph of the throughput of the two sensor nodes is slightly different due to very cloudy weather. With conditions from a distance of 5.5 m, a throughput of 1.13 kbps continues to decrease until a distance of 11.5 m obtains a throughput of 0.21 kbps.
The results of throughput testing from outdoors can be analyzed to show that the NS1 value is smaller or slower compared to NS2 in each test due to the busy network traffic at surrounding locations caused by interference from other radio signals. Under these conditions, a distance of 8 m obtained a throughput of 1.2 kbps, which continued to decrease until a distance of 60 m obtained a throughput of
DOI: https://doi.org/10.24843/MITE.2023.v22i02.P14
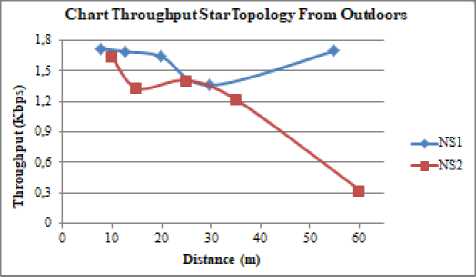
Figure 16: Chart Throughput Star Topology From Outdoors
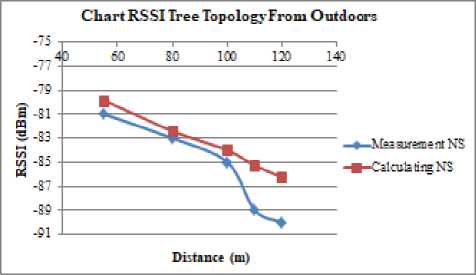
Figure 18: Chart RSSI Tree Topology From Outdoors
0.33 kbps. In this tests for distances of up to 11.5 m can be sent with conditions from indoors, which are placed on the rooftop of the IsDB Laboratory building, Faculty of Engineering, University of Jember, while conditions from outdoors with a distance of up to 60 m are placed in the ceremonial field area of the University of Jember. Distance testing aims to compare the noise conditions that occur on the edges of the field and weather conditions.
-
B. Test Results Tree Topology
The results of the tree topology test are generated on the NS and distributed to the coordinating nodes, which can be seen in the XCTU software to get the RSSI (Received Signal Strength Indicator), throughput, and delay values. The tree topology testing figure from indoors can be seen in Figure 17.
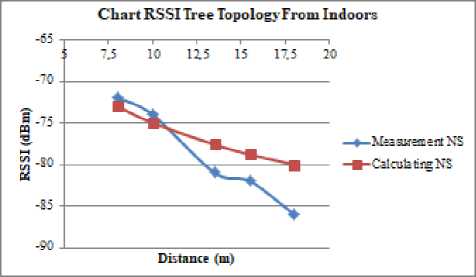
Figure 17: Chart RSSI Tree Topology From Indoors
Testing the receiving signal strength at topology tree from indoors obtained 5 tests with a maximum distance of up to 18 m between the NS and the coordinating node. Variations in the distance obtained on the NS are 8 m, 10 m, 13.5 m, 15.5 m, and 18 m. It can be seen from the graph that the farther the measurement distance, the weaker the RSSI value. With a distance value of 6.5 m and a range of -79 dBm, the value continues to decrease to a distance of 18 m with a range of -86 dBm, resulting in an average percent error of 5.33%.
Testing the RSSI topology tree from outdoors obtained 5 tests with a maximum distance of up to 120 m between sensor node 1 and sensor node 2 to the coordinator node. Variations of the distance obtained on the NS are 55 m, 80 m, 100 m, 110 m, and 120 m. This can be analyzed with the insight of the RSSI comparison chart between NS measurements and calculations. It can be seen that the comparison of the two is very different when at a great distance, which can be seen from the graph that the farther the measurement distance, the weaker the RSSI value. With a distance value of 55 m and a range of -81 dBm, the value continues to decrease to a distance of 120 m with a range of -90 dBm, resulting in an average percent error of 2.81%, can be seen in Figure 19.
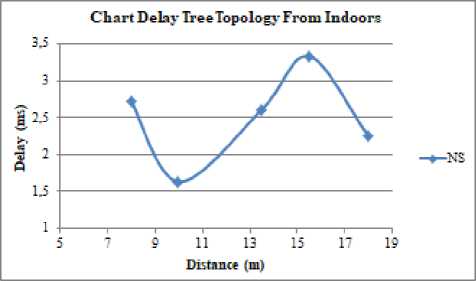
Figure 19: Chart Delay Tree Topology From Indoors
The results of the delay testing of the tree topology test from indoors can be analyzed to show that during the last test with a distance of 18 m, there was a very large delay. This was due to interference during the last test. Very high interference occurred. The NS delay comparison graph occurs up and down; this is due to high interference from other radio signals with different conditions, with a distance value of 6.5 m and a delay of 1.47 ms, continuing to decrease to a distance of 18 m with a delay of 2.25 ms, can be seen in Figure 19.
Dodi Setiabudi: RSSI Measurement Analysis of…
p-ISSN:1693 – 2951; e-ISSN: 2503-2372
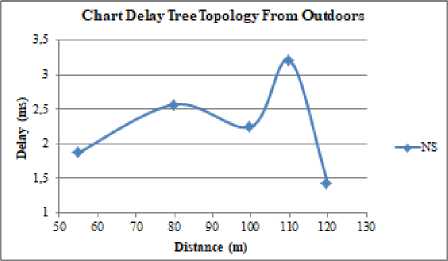
Figure 20: Chart Delay Tree Topology From Outdoors
The results of the delay testing of the tree topology test from outdoors can be analyzed to show that during the last test with a distance of 120 m, there was a very small delay from previous tests due to very low signal interference. The NS delay comparison graph fluctuates due to interference from other radio signals, which are very influential with different conditions at each time, starting from a distance of 55 m with delay of 1.6 ms up to a distance of 120 m with a delay of 1.42 ms, can be seen in Figure 20.
After getting the RSSI test value, the measured delay results are obtained during the test. Delivery packet delay of 64 bytes/s, which can be seen in Figure 21 and 22.
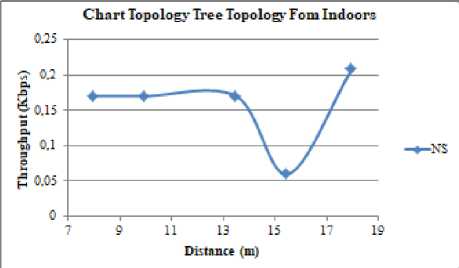
Figure 21: Chart Topology Tree Topology Fom Indoors
The results of throughput testing from indoors can be analyzed. In the last test, it was at a very long data transfer rate with a distance of 18 m, resulting in a throughput of 0.21 kbps. The NS throughput comparison graph on the tree topology from indoors shows that the conditions obtained are getting lower, this is because at a distance of 15.5 m with a throughput of 0.06 kbps, the environmental network traffic is greater and is caused by weather conditions.
The results of outdoor throughput testing can be analyzed in that the last test was at a fast data transfer rate with a distance of 120 m, resulting in a throughput of 0.64 kbps. The NS throughput comparison graph at a distance of 120 m shows an increasing speed; this is because the network traffic conditions in that environment are lower, which is due to radio signal interference, can be seen in Figure 20. Tests for distances of up to 18 m can be sent with conditions from indoors, which are placed on the rooftop of the IsDB building, Laboratory of the Faculty of Engineering, University of Jember, while conditions from outdoors with a distance of up to 120 m are placed in the ceremonial field area of the University of Jember.
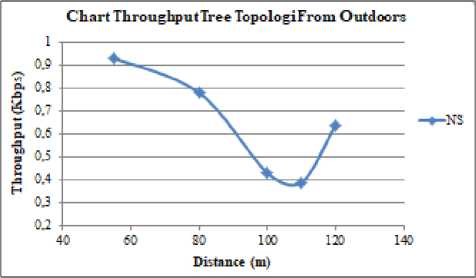
Figure 22: Chart Throughput Tree Topologi From Outdoors
-
C. Test Results Mesh Topology
The results of the mesh topology test are generated on the NS and distributed to the coordinating nodes, which can be seen in the XCTU software to get the RSSI (Received signal strength Indication), throughput, and delay values. The mesh topology testing figure from indoors can be seen in Figure 23.
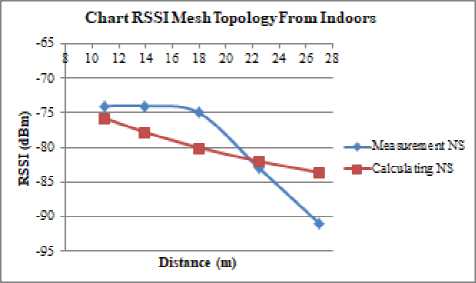
Figure 23: Chart RSSI Mesh Topology From Indoors
RSSI testing of the mesh topology from indoors obtained 5 tests with a maximum distance of up to 27 m to the coordinating node. The distances obtained on the NS are 11 m, 14 m, 18 m, 22.5 m, and 27 m. It can be seen that the RSSI comparison chart between NS measurements and calculations is not too different because the farther the measurement distance, the weaker the RSSI value. with a distance of 6.5 m with a range of -79 dBm continues to decrease to a distance of 18 m with a range of -86 dBm, resulting in an average percent error of 4.71%.
Receiving signal strength testing of the mesh topology from outdoors was obtained five times, with a maximum distance of up to 130 m between the NS and the coordinating node. The NS distances obtained are 80 m, 100 m, 110 m, 125 m, and 130 m. The average NS percent error with a comparison between measurements and calculations using a mesh topology from outdoors is 2.77%. The results of the measurement and calculation graphs can be seen in Figure 24.
The receiving signal strength comparison chart between the NS measurements and calculations is very different, which can be seen from the graph that the farther the measurement distance, the weaker the receiving signal strength value, with a distance of 80 m and a range of -84 dBm continuing to decrease to a distance of 130 m and a range of -90 dBm
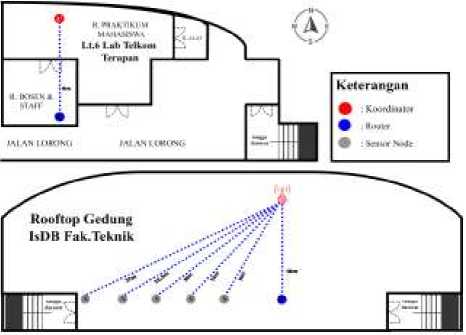
Figure 25. Testing Mesh Topology From Indoors
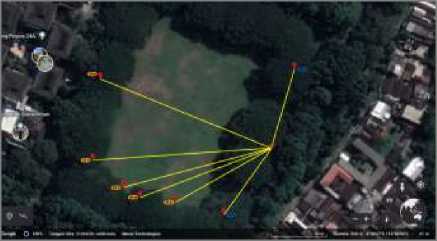
Figure 26. Testing Mesh Topology From Outdoors
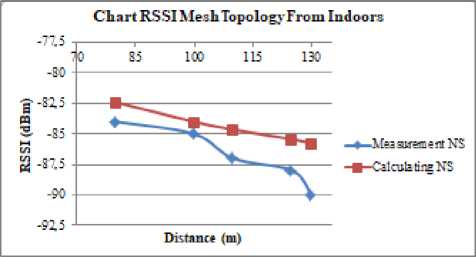
Figure 24: Chart RSSI Mesh Topology From Indoors
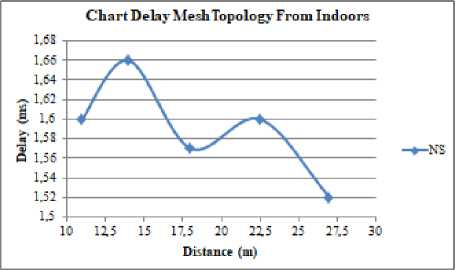
Figure 27: Chart Delay Mesh Topology From Indoors
Figure 25 and 26 are a testing mesh topology from indoors and outdoors for distances of up to 18 m can be sent with conditions from indoors, which are placed on the rooftop of the IsDB building, Laboratory of the Faculty of Engineering, University of Jember, while conditions from outdoors with a distance of up to 130 m are placed in the ceremonial field area of the University of Jember. Testing is carried out by measuring network parameters to test the quality of the ZigBee communication network between coordinator nodes, routers, and sensor nodes (NS).
The results of the tests that have been carried out can be analyzed to show that the NS delay fluctuates due to the mesh topology; if the signal is received too long, the other routers will back up by choosing a faster transmission path with a distance of 11 m and a delay. 1.6 ms continues to decrease to a distance of 27 m with a delay of 1.52 ms, can be seen in Figure 27.
Chart Delay MeshTopologj'From Outdoors
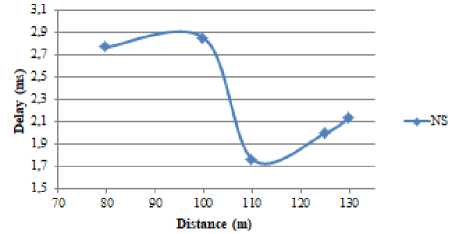
Figure 28: Chart Delay Mesh Topology From Outdoors
The results of the mesh topology delay test from outdoors can be analyzed in fact, it produces fluctuating delays that produce a fluctuating NS comparison graph. This is due to the high level of interference of radio wave signals that vary with distances from 80 m with a delay of 2.77 ms up to 130 m with a delay of 2.14 ms, can be seen in Figure 28.
The throughput test from indoors that has been carried out can be analyzed to show that in the last test with a distance of 27 m, it produced a throughput of 0.21 kbps at a very long data transfer rate. This is due to the large amount of radio signal interference from the surrounding environment and caused by weather conditions. You can see the test graph in Figure 29.
The results of the throughput test from outdoors can be analyzed and the NS throughput comparison chart shows that the throughput results obtained fluctuate due to interference from other radio signals. With conditions from a distance of 80 m, a throughput of 0.55 kbps continues to decrease until a
Dodi Setiabudi: RSSI Measurement Analysis of…
p-ISSN:1693 – 2951; e-ISSN: 2503-2372

distance of 130 m obtains a throughput of 0.58 kbps, can be seen in Figure 30.
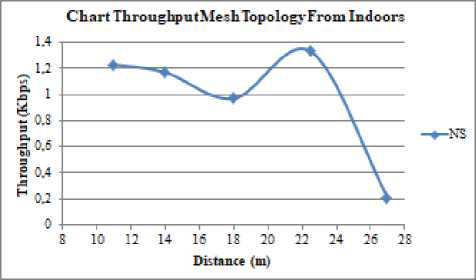
Figure 29: Chart Throughput Mesh Topology From Indoors
[5]
[6]
[7]
[8]
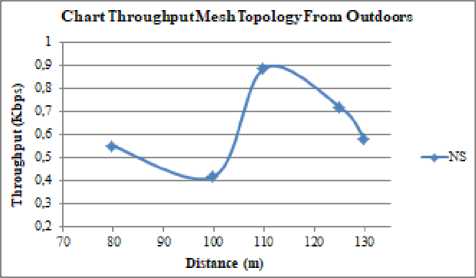
Figure 30: Chart Throughput Mesh Topology From Outdoors
[9]
[10]
[11]
[12]
[13]
[14]
-
V. CONCLUSION
The results of monitoring the performance of solar panels with ZigBee communication prove that the mesh topology is a method with good performance for WSN (Wireless Sensor Network) with a maximum distance of 130 m, resulting in an RSSI of -90 dBm, a delay of 2.14 ms, and a throughput of 0.58 Kbps. Evidenced by monitoring solar panels at an optimal distance of 80 m from outdoors with an RSSI of -80 dBm and a delay of 1.26 ms, they produced power for 150 minutes with an average current of 0.14 A, a voltage of 9.86 V, and a temperature of 31.48°C. Suggestions for further research include using packet payloads that change in each condition so that ZigBee performance can be known. Then added an AI (Artificial Intelligence) system to search for optimal node points according to conditions. This can also be developed by adding jumps between routers so that differences in receiving signal strength performance can be identified in mesh topologies.
[15]
[16]
[17]
[18]
[19]
[20]
Engineering, Computer and Information Technology (ICEECIT), 232240, 2022.
-
D. W. Herdiyanto, G. A. Rahardi, E. Fiqrilinia, A. R. Chaidir, D. Setiabudi and A. M. Nanda Imron, “Prototype of Building Monitoring System Using Vibration Sensor Based on Wireless Sensor Network,” International Conference on Electrical Engineering, Computer and Information Technology (ICEECIT), 215-221, 2022.
Fachri. M. R, Sara. I. D, & Away. Y, “Arduino-Based Solar Panel Parameter Monitoring in Real Time,” Jurnal Rekayasa Elektrika, 11(4), 123, 2015.
Hartawan. I. N. B, & Desnanjaya. I. G. M. N, “Performance Analysis of the Zigbee Protocol Indoors and Outdoors as Data Communication Media in Wireless Sensor Networks,” Jurnal RESISTOR (Computer Systems Engineering), 65–72, 2018.
H. Fitriawan, Roviq Cholifatul Rohman, Herlinawati. S. P, ”RSSI Measurement of ZigBee-Based Wireless Sensor Networks on Various Topologies,” Jurnal Rekayasa Elektrika, 13(36), 152–160, 2020.
Lee. J. L, Tyan. Y. Y, Wen. M. H, & Wu. Y. W, “Applying a ZigBee wireless sensor and control network for bridge safety monitoring,” Advances in Mechanical Engineering, 10(7), 1–8, 2018.
Rachman. F. Z, “Implementation of Wireless Sensor Networks Using Zigbee in Baby Incubator Tube Monitoring,” National Journal of Electrical Engineering, 5(2), 207, 2016.
Sella. A, Ariansyah. M. A, Setiawan. O, & Ocsirendi. S, “Proceedings of The National Seminar Receive Signal Strength Indicator (RSSI) In Swarm,” Proceedings of the National Seminar on Applied Technology Innovation’22, 2022, pp. 226-231.
Shrestha. S, & Shakya. S, “Technical Analysis of ZigBee Wireless Communication,” Journal of Trends in Computer Science and Smart Technology, 2(4), 197–203, 2021.
Dwikiarta. I. M. S, Sastra. N. P, & Wiharta. D. M, “Wireless Sensor Network Performance for Smart Building Models,” Electro Technology Scientific Magazine (MITE), 20(2), 211, 2021.
Sutikno. T, Alfahri. J, & Purnama. H. S, “Monitoring Voltage and Current on Solar Panels Using IoT,” Electro Technology Scientific Magazine (MITE), 22(1), 153, 2023.
Amalina. E. N, Setijadi. E, & Suwadi, “Comparison of WSN (Wireless Sensor Network) Topologies for Bridge Monitoring Systems,” Prosiding Csgteis, 22(1), 153. 2013.
Astiti. N. M. E. P, Diafari. I. G. A. K., & Er. I, “Analysis of the Influence of the Number of Devices on the Performance of the Zigbee Standard on WSN for Smart Building Applications,” 2(3), 79–85. 2015.
Chen. T. S, Chang. C. Y, Chen. Y. S, Of. N. N, Of. N. N, At. O. R. K., Of. N. N, & Rachman. T, “Wireless Sensor Networking Wireless Multimedia Sensor Networks,” Journal of Internet Technology 6(1), 2005.
Dargie. W & Poellabauer. C, Fundamentals of Wireless Sensor Networks: Theory and Practice. United Kingdom: A John Wiley and Sons, Ltd., Publication, 2011.
Haque. K. F, Abdelgawad. A., & Yelamarthi. K, “Comprehensive Performance Analysis of Zigbee Communication: An Experimental Approach with XBee S2C Module,” 22(9), 2022.
Kurniawan. G. W, Agung. I. G. A. P. R, & Rahardjo. P, “Design and Build a Solar Panel Monitoring System Based on the Internet of Things,” Electro Technology Scientific Magazine (MITE), 22(1), 133, 2023.
Lu. F, “The ZigBee Based Wireless Sensor and Actor Network in Intelligent Space Oriented to Home Service Robot,” Int’l J. of Communications, Network and System Sciences, 05(05), 280–285, 2012.
REFRENCE
-
[1] Akhriana. A, Irsal. I, Hidayat. M. I, & Inkasari. I, “Analysis of Data Delivery on Wireless Sensor Networks Using XBEE and Wemos Modules,” Scientific Journal of Electrical Engineering, 7(1), 33–39, 2020.
-
[2] Alhamri. R. Z, Dianta. A. F, & Cinderatama. T. A, “Performance of ZigBee Technology in Wireless Sensor Networks for Freshwater Fish Pond Dewatering Systems,” INOVTEK Polbeng - Seri Informatika, 4(2), 132, 2019.
-
[3] D. Setiabudi, D. W. Herdiyanto, A. Kurniawan, W. Muldayani, A. R. Chaidir and G. A. Rahardi, “Design Of Wireless Sensor Network (WSN) System Using Point To Point And Waiting Protocol Methods For Solar Panel Monitoring,” International Conference on Electrical
ISSN 1693 – 2951 Dodi Setiabudi: RSSI Measurement Analysis of…
Discussion and feedback