LED lights of various colors for comprehending the photoelectric effects phenomena
on
Majalah Ilmiah Teknologi Elektro, Vol.22, No.2, Juli-Desember 2023
DOI: https://doi.org/10.24843/MITE.2023.v22i02.P12 243
LED lights of various colors for comprehending the photoelectric effects phenomena
Soni Prayogi 1*, Fitria Silviana 2
[Submission: 22-06-2023, Accepted: 31-08-2023]
Abstract— In this project, a tool that can explain phenomena involving the photoelectric effect at laboratory scales is being developed. The purpose of this tool is to help users understand that the photoelectric effect, which causes electrons to move from a source of a negative voltage to a source of positive voltage, is not affected by light intensity but rather by a light source's frequency and wavelength. A photodiode is employed in the creation of this device as a light sensor, and when exposed to light, it moves electrons from the cathode to the anode, causing an electric current to flow. The voltage is delivered to the cathode, which is where the electrons leave, to calculate the stopping voltage. A graph showing the connection between the ADC value and the sensor output voltage is produced from the ongoing data gathering. Our results show that each color spectrum has a distinct voltage supplied to the photodiode leg (cathode). Additionally, the output voltage measured for each distinct wavelength was decreased the lower the photodiode's light intensity was.
Keyword— Arduino Uno; LED; light source; Photoelectric effect
-
I. INTRODUCTION
Naturally, when a metal when exposed to light will release electrons [1], which will produce an electric current when connected to a closed circuit [2]. If the light is a wave as predicted by classical physics [3], then the higher the intensity of the light given, the greater the current detected [4]. However, the experimental results show that even though the light intensity is maximum, the electrons do not emerge from the metal plate [5]. But when given light with a shorter wavelength (higher frequency [6], towards the purple color of the light spectrum) than before [7], suddenly electrons escape from the metal plate so that an electric current is detected [8], even though the intensity given is smaller than the previous intensity [9]. This means that the energy required by the metal plate to remove electrons depends on the wavelength [10].
The photoelectric effect, or the electromagnetic radiation-induced emission of electrons from a metal surface [11], is one of the quantum mechanical phenomena that may be empirically proven in beginning physics classes [12]. The wavelength of
the incoming radiation determines its emission, not its strength [13]. When light strikes a surface [14], the photoelectric effect will occur in two different ways externally [15], when electrons in a metal (or semiconductors) are emitted into a vacuum [16], and internally [17], when photoelectrons are created within the semiconductor and stimulated for the purpose of making the substance more conductible [18].
In this article, we present a practical method for demonstrating the photoelectric effect with LED light sources. One of the more accessible instructional tools among the two is the external photoelectric effect. This usually includes a light source, voltmeter, microammeter, phototube, and a variable voltage power supply to produce some light with a little bandwidth. LEDs (light-emitting diodes) are used as light sources in several of these gadgets. However, obtaining teaching materials on the internal photoelectric effect can be quite challenging, even though most contemporary photosensor technologies (photodiodes, CCDs, solar cells, etc.) are built using this phenomenon.
-
II. LITERATURE REVIEW
When linked to a power source, a semiconductor device known as an LED operates like a light bulb and emits light [15]. The energy released during the emission of light is discrete and is known as a photon. It can come from any of the following sources:
E = hf (1)
The energy of each photon generated by an LED is determined by this equation, which also considers the frequency. The LED starts to emit light when the voltage reaches its minimum threshold, and the current is allowed to flow through it. The following formula expresses the relationship between energy and the minimum threshold voltage:
E = eVo (2)
where e is an electron's charge, which has the value of 1.6022 x 10⁻¹⁹ C. Equation (1) and equation (2) are as the LED is turned on, equivalent and provide a linear relationship between frequency and voltage. You can demonstrate this correlation by:
hf = eVo (3)
Equation (4) shows that the y- and x-axes are linear when seen as a straight line with the equation y = mx + c, which is obtained by rearranging equation (3). This may be demonstrated by plotting a graph with the frequency of an LED on the x-axis and the minimum threshold voltage on the y-axis.
Vo = hf/e (4)
The relationship between these two axes in a graph of minimal threshold voltage vs frequency yields a straight-line
Soni Prayogi: LED lights of various colors for comprehending…
p-ISSN:1693 – 2951; e-ISSN: 2503-2372

9 772503 2371 BO
slope, and the size of Planck's constant can be determined by multiplying this slope by the charge of an electron.
The photocathode is illuminated with monochromatic light of a wavelength in the traditional photoelectric effect experiment, and the voltage needed to squelch its most energizing electron emissions is measured [15]. The famous Einstein equation results from the conservation of energy principle and the assumption that light is quantized:
eVs = hv-Wo (5)
where e is the electronic charge, Vs is the stopping voltage, h is Planck's constant, v is the frequency of the light, and Wo is the minimum energy needed to release the electron from the photocathode.
As the monochromatic light source for the experiment, each LED is used. The stopping voltage (Vs) is then changed until the photocurrent just barely reaches zero, and this stopping voltage value is noted for each wavelength (LEDs). Even though the LEDs are not truly monochromatic light sources, they are more than sufficient for this experiment's precision. Since their spectral width often has a wavelength of less than 20 nm, this approximation is appropriate. Therefore, less than 5% of the peak's wavelength (or frequency) spread is present.
-
III. METHOD
The tool's design employs four pins and five 5 mm red, yellow, blue, and purple LEDs as its light sources. While the photodiode light sensor employed in the creation of this instrument serves as a converter of light quantity into electrical quantity so that the output voltage, which is the sensor's output, can be read on the voltmeter. The photodiode's output voltage serves as the amplifier circuit's input in this particular circuit, which employs an Op-Amp. Because the current produced by
the amplifier circuit is so modest, it also serves as a current amplifier. Figure 1 shows the design for a photoelectric effect
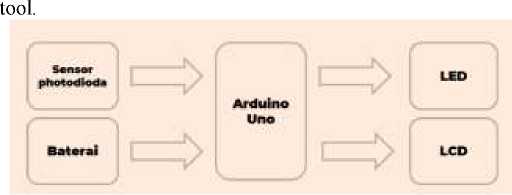
Figure 1. Design for the manufacture of an electric photo effect device
As a result, the system we developed may be divided into two distinct functional parts: (a) an LED used as a light source; and (b) an LED used as a light detector. Figure 2 depicts the different components of the apparatus schematically. The system may be connected to the LED being used as a light source using two shielded connections (Figure 3(a)).
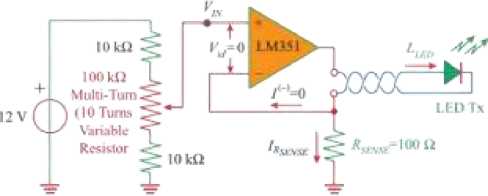
Figure 2. The circuit for driving an LED that is acting as a light source.
This LED may be switched out each time to alter the incident wavelength [19], compared to the receivers that were fixed LEDs (Figure 3(b)). Transconductance amplifier is used in our tool to regulate the LED that acts as the light source [20]. This is done in accordance with the circuit depicted in Figure 2.
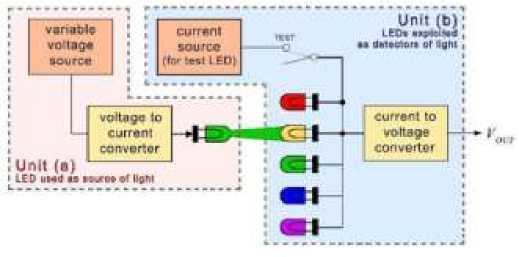
Figure 3 The achieved system schematically. The device has two distinct functional components: (a) an LED that serves as a light source, and (b) LEDs that are employed as light detectors.
In this circuit, a multi-turn variable resistor generates a changeable VIN voltage. With such a floating load, the operational amplifier's non-inverting input terminal (we used an LM351) receives the VIN voltage and converts it to current [21]. A voltage applied from across the RSENSE resistor (RSENSE in our circuit is 100 Ω) drives the inverting input terminal. The load current determines this feedback voltage (ILED). In other words, RSENSE is a current-sensing resistor that produces a voltage proportional to the current flowing through the LED [22]. Keep in mind that the two inputs of an operational amplifier have the same potential and that no current will flow through them [23]. We have a circuit that, when the input voltage (VIN) is set between 0.1 V and 1.1 V using a multi-turn (10 tours) variable resistor, can drive the LED with a variable current between 1 mA and 11 mA.
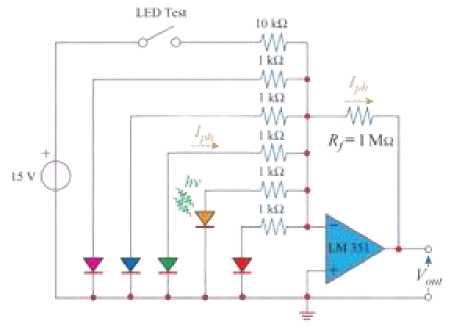
Figure 4. The circuit that transforms light into an output voltage. LEDs are employed as light detectors in this circuit.
Component (b), used for the detection of light, is implemented using the circuit depicted in Figure 4. A converter for current to voltage is depicted in the basic schematic. There are five LEDs, all different sizes and colors. It is essential to check the LED's color before using it as the receiver [24]. For this, a switch labeled "LED Test" and a few resistances are included in the circuit. By activating the LED test switch with a resistor, the LED is connected to the power supply and turned
Majalah Ilmiah Teknologi Elektro, Vol.22, No.2, Juli-Desember 2023 DOI: https://doi.org/10.24843/MITE.2023.v22i02.P12 on [25]. The emitted LED photocurrent in our circuit is measured by a current-to-voltage converter (inverter amplifier) constructed with an LM351 op amp [26]. The output voltage (VOUT) of the LM351 is determined by the photocurrent produced by the lighted LED.
-
IV. RESULTS AND DISCUSSION
Figure 5 shows our equipment from the outside. The front panel's top section houses an LED that serves as a light receiver and a button known as the "LED test" (at right), which is used to check the LEDs' colors because they first seem to be transparent [27]. Above the LEDs was a black portion that enables connection with a forward-looking light source facing the receiver. Two bushes at the bottom of the front panel may be used to connect an LED utilized as a light source, and a multi-turn potentiometer enables the user to change the current flowing in the LED emitter [28]. The receiving LED's signal may be captured using a BNC at the top of the front panel.
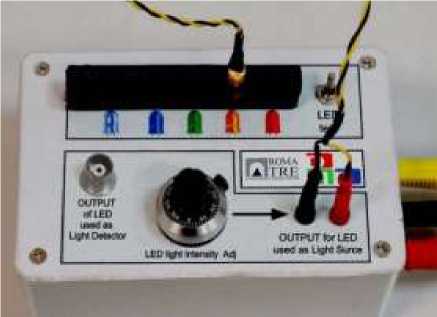
Figure 5. A technique that was developed to confirm the internal photoelectric effect
Only when the energy of the light photons exceeds the energy gap of the semiconductor material used to make the LED (hv > Eg) does the photocurrent in LED receivers become visible. In other words, if the LED being used as a light source somehow has a wavelength that is less than the wavelengths that the LED receiver would 'emit,'[29]. In our educational opportunity, for instance, pairing an amber LED with a red or amber LED enables us to check for photoemission [30]. Furthermore, the yellow LED can be coupled with the ultraviolet, blue, and green LEDs to see if photoemission happens independent of the yellow LED's brightness [31]. On the other hand, Figure 6 shows that blue LEDs may be used to create a photoelectric effect but not ultraviolet LEDs. It's crucial to remember that threshold events can happen no matter how intense the light beam is [32]. For instance, no photocurrent emerges when we illuminate a green LED with a yellow LED, no matter how strong the yellow light is [33]. Only when the incoming radiation's wavelength is less than the wavelength associated with the LED's receiving color can photocurrent occur.
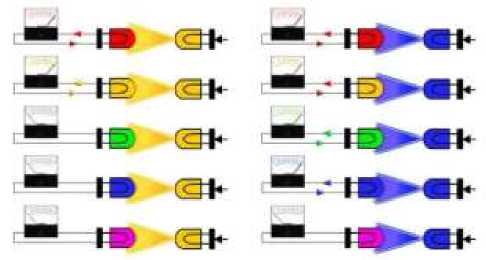
Figure 6. The transmission of light from one "hued" LED to another "colored" receiver
The amount of current flowing through an LED directly affects how much light it emits. This made it easy to demonstrate that such a single electron gains kinetic energy regardless of the magnitude of an incident light wave [33]. By employing LEDs of the same color as the light source and the detector, we can verify that the relationship between the generated photocurrent and the input light intensity is proportionate [34]. More photons enter the receiving LED as the intensity of the incoming light rises [35]. As a result, there are more electrons that can go from the conduction band to the valence band.
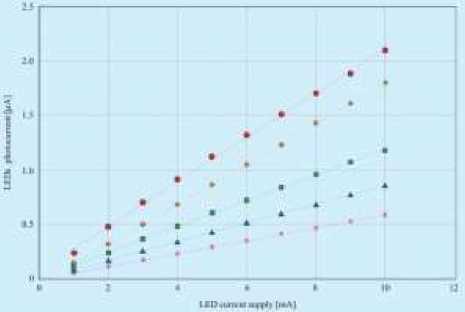
Figure 7. The direct correlation between photocurrent generation and light intensity (LED polarization current). The various curves match the colors of the connected LEDs
Figure 7 shows the photocurrent produced on the target LED with the current flowing within the system's component that employs this LED as just a light source. The various colors of the curves match the various colors of the LEDs they are used with. The amount of light (LED polarization current), as well as the generated photocurrent, are directly proportional.
Actually, blue LEDs can be used as photodiodes, but their detection capabilities may be limited in some cases. This is due to several factors to consider: Sensitivity: Blue LEDs are designed to generate light, not to detect light. They are usually less sensitive to incident light than photodiodes specially designed for light detection. Optimum Wavelength: Blue LEDs will have highest sensitivity at the wavelengths corresponding to blue, which range from about 450 nm to 495 nm. In comparison, a photodiode designed for blue light detection will have a higher response at that wavelength. Detection Efficiency:

Photodiodes specifically designed for light detection usually have a design optimized to produce a high response to light, including the design of the electrode, material, and other ancillary devices. Blue LEDs are not optimized for this task. While blue LEDs can be used as photodiodes in some simple applications, such as simple light sensors or educational experiments, they will not perform as well as specially designed photodiodes. Therefore, for serious light detection applications, it is advisable to use photodiodes specifically designed for the wavelength range of the light to be detected. This photodiode will have a better response and higher sensitivity to the light it will detect.
LED lights of various colors are used to understand the phenomenon of the photoelectric effect. The photoelectric effect is a phenomenon in which light falling on a metal surface causes electrons to be ejected from the surface. Some important aspects to understand about the photoelectric effect involve Quantum Energy: The photoelectric effect only occurs when light with a certain energy, called quantum energy (or photons), hits a metal surface. This is one of the key concepts in understanding the photoelectric effect. Work Function: Every metal has something called a "work function" which is the minimum energy required to remove electrons from the surface of the metal. This work function depends on the type of metal. Photoelectric Effect Depends on Frequency: The success of the photoelectric effect depends on the frequency of light hitting the metal. If the frequency of light is less than the quantum energy of the work function, then the photoelectric effect will not occur. Electron Flow: When the photoelectric effect occurs, electrons will be ejected from the surface of the metal and form an electron current. This current can be measured and used to understand the nature of the photoelectric effect. Light Color: The use of different colored LED lights allows experimenters to examine how the color of the light (which is related to frequency) affects the photoelectric effect. Higher frequencies (light with a blue or purple tint) have more energy and are more likely to trigger the photoelectric effect than lower frequencies (such as red light). Applications: The photoelectric effect has many applications in modern technology, including photodetectors, solar panels, and various electronic devices. So, by using LED lights of various colors, research into the photoelectric effect can allow us to better understand how light and quantum energy interact with matter, and how this effect has an impact on the various technologies we use every day.
-
V. CONCLUSIONS
In summary, with the aid of LED lighting in a variety of colors, the system allows for a direct and easy-to-understand demonstration of the nature of the threshold for the photoelectric effect, as well as measurement of the resulting photocurrent. Each color spectrum has a separate voltage delivered to the photodiode (cathode). The smaller the output voltage value for each distinct wavelength, the less light the photodiode receives in terms of intensity. Each LED color's output voltage is variable in magnitude since each color's wavelength varies, hence the value is not the same. The equipment provided in this study is based on an LED-to-LED system and is easy to use, powerful and economical. It can be used to test the internal photoelectric effect in undergraduate physics.
ACKNOWLEDGMENT
The authors thank the Ministry of Education and Culture of the Republic of Indonesia for their support in providing Indonesian and Research Scholarships (179/E5/PG.02.00/PL/2023). Jobs at Pertamina University and (093/UP-WRP.1/PJN/VII/2023 and 0044/UP-R/SK/HK.01/II/2023).
REFERENCES
-
[1] A. Checchetti and A. Fantini, “Experimental Determination of Planck’s
constant using Light Emitting Diodes (LEDs) and Photoelectric Effect,” World Journal of Chemical Education, vol. 3, no. 4, Art. no. 4, Aug. 2015, doi: 10.12691/wjce-3-4-2.
-
[2] J. P. Colinge and C. A. Colinge, Eds., “Quantum-effect Devices,” in
Physics of Semiconductor Devices, Boston, MA: Springer US, 2002, pp. 331–362. doi: 10.1007/0-306-47622-3_10.
-
[3] J. F. Waymouth, “History of Light Sources,” in Handbook of Advanced
Lighting Technology, R. Karlicek, C.-C. Sun, G. Zissis, and R. Ma, Eds., Cham: Springer International Publishing, 2017, pp. 3–40. doi: 10.1007/978-3-319-00176-0_1.
-
[4] S. Prayogi, Y. Cahyono, I. Iqballudin, M. Stchakovsky, and D.
Darminto, “The effect of adding an active layer to the structure of a-Si: H solar cells on the efficiency using RF-PECVD,” J Mater Sci: Mater Electron, vol. 32, no. 6, pp. 7609–7618, Mar. 2021, doi:
10.1007/s10854-021-05477-6.
-
[5] D. H. Dowell et al., “Cathode R&D for future light sources,” Nuclear
Instruments and Methods in Physics Research Section A: Accelerators, Spectrometers, Detectors and Associated Equipment, vol. 622, no. 3, pp. 685–697, Oct. 2010, doi: 10.1016/j.nima.2010.03.104.
-
[6] D. Darminto et al., “Unrevealing tunable resonant excitons and
correlated plasmons and their coupling in new amorphous carbon-like for highly efficient photovoltaic devices,” Sci Rep, vol. 13, no. 1, Art. no. 1, May 2023, doi: 10.1038/s41598-023-31552-5.
-
[7] M. Mõttus, M. Sulev, F. Baret, R. Lopez-Lozano, and A. Reinart,
“Photosynthetically Active Radiation:
Measurementphotosynthesis/photosynthetic(ally)active radiation
(PAR)measurementand
Modelingphotosynthesis/photosynthetic(ally)active radiation
(PAR)modeling,” in Encyclopedia of Sustainability Science and Technology, R. A. Meyers, Ed., New York, NY: Springer, 2012, pp. 7902–7932. doi: 10.1007/978-1-4419-0851-3_451.
-
[8] A. C. Parr, “The Candela and Photometric and Radiometric
Measurements,” J Res Natl Inst Stand Technol, vol. 106, no. 1, pp. 151– 186, 2001, doi: 10.6028/jres.106.007.
-
[9] F. B. Effah, P. Gasu, P. Okyere, and A. Acakpovi, “Harmonics of CF
and LED lamps - Maximum Penetration Perspective on Power Quality in Distribution Systems,” JNTE, pp. 171–181, Nov. 2020, doi: 10.25077/jnte.v9n3.795.2020.
-
[10] S. Prayogi et al., “Observation of resonant exciton and correlated plasmon yielding correlated plexciton in amorphous silicon with various hydrogen content,” Sci Rep, vol. 12, no. 1, Art. no. 1, Dec. 2022, doi: 10.1038/s41598-022-24713-5.
-
[11] M. W. Burke, “Lighting II: Sources,” in Image Acquisition, M. W. Burke, Ed., Dordrecht: Springer Netherlands, 1996, pp. 127–283. doi: 10.1007/978-94-009-0069-1_2.
-
[12] S. Prayogi, Y. Cahyono, and D. Darminto, “Electronic structure analysis of a-Si: H p-i1-i2-n solar cells using ellipsometry spectroscopy,” Opt Quant Electron, vol. 54, no. 11, p. 732, Sep. 2022, doi: 10.1007/s11082-022-04044-5.
-
[13] E. S. Wahyuni, Z. Iqbal, and D. Farahiya, “Detection of Human Movement Direction Using Optical Flow Analisys on Multiple Camera Angles,” JNTE, Jul. 2021, doi: 10.25077/jnte.v10n2.924.2021.
-
[14] D. Hamdani, S. Prayogi, Y. Cahyono, G. Yudoyono, and D. Darminto, “The Effects of Dopant Concentration on the Performances of the a-SiOx:H(p)/a-Si:H(i1)/a-Si:H(i2)/µc-Si:H(n) Heterojunction Solar Cell,” International Journal of Renewable Energy Development, vol. 11, no. 1, pp. 173–181, Feb. 2022, doi: 10.14710/ijred.2022.40193.
-
[15] J. P. Colinge and C. A. Colinge, Eds., “Theory of Electrical Conduction,” in Physics of Semiconductor Devices, Boston, MA: Springer US, 2002, pp. 51–72. doi: 10.1007/0-306-47622-3_2.
Majalah Ilmiah Teknologi Elektro, Vol.22, No.2, Juli-Desember 2023 DOI: https://doi.org/10.24843/MITE.2023.v22i02.P12
-
[16] S. Prayogi, “Silikon Kristal vs Silikon Amorf: Perbedaan Struktural dalam Aplikasi Fotovoltaik,” Jurnal Teknik AMATA, vol. 3, no. 2, Art. no. 2, Dec. 2022, doi: 10.55334/jtam.v3i2.303. [26]
-
[17] M. A. Afandi, I. Hikmah, and C. Agustinah, “Microcontroller-based Artificial Lighting to Help Growth the Seedling Pakcoy,” JNTE, Nov. 2021, doi: 10.25077/jnte.v10n3.943.2021.
-
[18] I. K. Wijaya, “Effect of Enhanced Air Temperature (extreme heat), and [27] Load of Non-Linear Against the Use of Electric Power,” Majalah Ilmiah Teknologi Elektro, vol. 14, no. 2, Art. no. 2, Dec. 2016, doi: 10.24843/MITE.2015.v14i02p12.
-
[19] G. Schirripa Spagnolo, F. Leccese, and M. Leccisi, “LED as Transmitter and Receiver of Light: A Simple Tool to Demonstration [28] Photoelectric Effect,” Crystals, vol. 9, no. 10, Art. no. 10, Oct. 2019, doi: 10.3390/cryst9100531.
-
[20] I. N. Hakim, A. L. Amdrian, A. B. Pradana, and A. N. I. Wardana, “Pengembangan Electronic Load Controller untuk Self-Excited [29] Induction Generator Berbasis Penyearah Tiga Fase Menggunakan Raspberry Pi,” JNTE, pp. 159–170, Nov. 2020, doi:
10.25077/jnte.v9n3.802.2020.
-
[21] S. Prayogi, A. Ayunis, Y. Cahyono, and D. Darminto, “N-type H2- [30]
doped amorphous silicon layer for solar-cell application,” Mater Renew Sustain Energy, Apr. 2023, doi: 10.1007/s40243-023-00232-9.
-
[22] L. A. Kosyachenko, “Possibilities to decrease the absorber thickness reducing optical and recombination losses in CdS/CdTe solar cells,” [31] Mater Renew Sustain Energy, vol. 2, no. 3, p. 14, Jun. 2013, doi: 10.1007/s40243-013-0014-1.
-
[23] I. M. A. Nugraha, P. A. Ridhana, and K. Listuayu, “Optimalisasi Pemasangan Panel Solar Home Sistem Untuk Kehidupan Masyarakat Pedesaan DiBan4kubu Karangasem,” Majalah Ilmiah Teknologi Elektro, vol. 17, no. 1, Art. no. 1, May 2018, doi: 10.24843/MITE.2018.v17i01.P16.
-
[24] P. A. Addo, L. Dwomoh, and C. Ofori, “Automatic Maintenance Alert System for Heavy Duty Haulage Machines,” JNTE, Jul. 2022, doi: 10.25077/jnte.v11n2.1002.2022.
-
[25] Z. Zainuddin, M. Syukri, S. Prayogi, and S. Luthfia, “Implementation of Engineering Everywhere in Physics LKPD Based on STEM Approach to Improve Science Process Skills,” Jurnal Pendidikan Sains
-
Indonesia (Indonesian Journal of Science Education), vol. 10, no. 2, Art. no. 2, Apr. 2022, doi: 10.24815/jpsi.v10i2.23130.
-
S. Ghufron and S. Prayogi, “Cooling System in Machine Operation at Gas Engine Power Plant at PT Multidaya Prima Elektrindo,” Journal of Artificial Intelligence and Digital Business (RIGGS), vol. 1, no. 2, Art. no. 2, 2023, doi: 10.31004/riggs.v1i2.21.
-
D. Hamdani, S. Prayogi, Y. Cahyono, G. Yudoyono, and D. Darminto, “The influences of the front work function and intrinsic bilayer (i1, i2) on p-i-n based amorphous silicon solar cell’s performances: A numerical study,” Cogent Engineering, vol. 9, no. 1, p. 2110726, Dec. 2022, doi: 10.1080/23311916.2022.2110726.
-
S. Prayogi, F. Silviana, and T. Hamid, “Analysis of the process of coloring objects based on the optical properties of objects,” Cakrawala Jurnal Ilmiah Bidang Sains, vol. 1, no. 2, Art. no. 2, Jan. 2023, doi: 10.28989/cakrawala.v1i2.1405.
-
S. Wardoyo, T. Ryadi, and R. Fahrizal, “Analisis Performa File Transport Protocol Pada Perbandingan Metode IPv4 Murni, IPv6 Murni dan Tunneling 6to4 Berbasis Router Mikrotik,” JNTE, vol. 3, no. 2, Art. no. 2, Sep. 2014, doi: 10.25077/jnte.v3n2.74.2014.
-
J. P. Sharma and H. R. Kamath, “Fuzzy Logic Controller Based Distributed Generation Integration Strategy for Stochastic Performance Improvement,” Advances in Electrical Engineering, vol. 2016, p. e9760538, Nov. 2016, doi: 10.1155/2016/9760538.
S. Mulyanti, W. Sukmawati, and N. E. H. Tarkin, “Development of items in Acid-Base Identification Experiments Using Natural Materials: Validity Test with Rasch Model Analysis,” Phenomenon: Jurnal Pendidikan MIPA, vol. 12, no. 1, Art. no. 1, Oct. 2022, doi: 10.21580/phen.2022.12.1.10703.
-
[32] M. Toh-arlim, A. Ma’arif, and A. A. Nuryono, “Desain Sistem Pengukuran Parameter dan Keamanan Penerangan Jalan Umum Tenaga Surya Berbasis Internet of Thing (IoT),” Majalah Ilmiah Teknologi Elektro, vol. 20, no. 2, Art. no. 2, Dec. 2021, doi: 10.24843/MITE.2021.v20i02.P18.
-
[33] S. Prayogi, “Thin Layer Deposition of a-Si: H n-Type Hydrogenated Amorphous Silicon using PECVD,” Journal of Science and Informatics for Society (JSIS), vol. 1, no. 1, Art. no. 1, Feb. 2023.

{Halaman ini sengaja dikosongkan}
ISSN 1693 – 2951
Soni Prayogi: LED lights of various colors for comprehending…
Discussion and feedback