The Effect of Corporate Governance on Corporate Value: The Role of Enterprise Risk Management
on
224 Matrik: Jurnal Manajemen, Strategi Bisnis dan Kewirausahaan Vol. 16, No. 2, Agustus 2022

MATRIK: JURNAL MANAJEMEN, STRATEGI BISNIS DAN KEWIRAUSAHAAN
Homepage: https://ojs.unud.ac.id/index.php/jmbk/index
Vol. 16 No. 2, Agustus (2022), 224-240
The Effect of Corporate Governance on Corporate Value: The Role of Enterprise Risk Management
Lena Sepriani 1), Candy 2)*
Faculty Business and Management Universitas Internasional Batam
email: candy.chua@uib.ac.id2

SINTA 2
DOI : https://doi.org/10.24843/MATRIK:JMBK.2022.v16.i02.p04
ABSTRAK
Guna mengetahui pengaruh corporate governance terhadap corporate value kemudian memoderasi hubungan tersebut dengan enterprise risk management (ERM) menjadi poin yang dituju melalui penelitian ini. Penelitian ini dilaksanakan dengan melakukan pengumpulan data dari 87 perusahaan sebagai sampel. Data yang diolah berasal dari data sekunder berbentuk laporan tahunan serta laporan keuangan pada tahun 2016-2020 dari setiap sampel perusahaan. Pengujian regresi data panel difasilitasi dengan pemanfaatan program E-Views 12. Hasil penelitian menunjukkan adanya pengaruh signifikan positif audit commmitee terhadap corporate value, independent commisioner yang memiliki pengaruh signifikan negatif, dan yang lain tidak memiliki pengaruh terhadap corporate value. Serta dapat dimoderasinya hubungan di antara audit committee dan corporate value serta managerial ownership dan corporate value dengan ERM.
Kata kunci: Tata kelola perusahaan, nilai perusahaan, ERM.
Pengaruh Tata Kelola Perusahaan Terhadap Nilai Perusahaan: Peran Enterprise Risk Management
ABSTRACT
In order to know the impact of corporate governance on corporate value, then moderating all relationships by enterprise risk management (ERM) is the aim of this study. This study gathered data from annual reports and financial statements in periods 2016-2020 of 87 companies as the sample and used panel regression as the analysis method. The results showed that the audit committee had a significant positive effect on corporate value, while an independent commissioner had a significant negative effect. This study also shows no significant effect on the corporate value of managerial ownership, institutional ownership, board size, and board director. However, ERM moderated the relationship between the corporate value and audit committee and between managerial ownership and corporate value.
Keyword: Corporate governance, corporate value, ERM.
INTRODUCTION
A newly formed company causes competition between companies to increase every year. It underlines the company's efforts to increase value through its competitive advantage to be better than its competitors. The maximization of corporate value can affect shareholders' wealth, so they have to become more maximum (Manurung et al., 2019). However, to achieve high corporate value, which is required to applicate good corporate governance (GCG) implementation. If a company performs the GCG well, certainly it will make an investor assured to having an investment because the good images have formed from the company so that corporate value will increase too. In an increasingly competitive competition, companies that implement better GCG will be able to survive in the face of it.
In the use of corporate values that are more maximum, it is not uncommon for uncertainty to arise in a business, which is also known as risk. Risk can arise from many things; one of the risks comes from other factors out of the company's control (Sibarani & Lusmeida, 2021). Risk management is required to identify risks so the possibility of undesirable events can be reduced (Steinberg, 2011:13). Therefore, the study about risk management is important to know. Enterprise risk management (ERM) is risk management that has correlations to GCG and gives a holistic perspective to the process of the company's risk management (Candy, 2021). ERM, which was first introduced by the Committee of Sponsoring Organizations (COSO) in 2004, can be a monitor or control mechanism in reducing problems related to GCG and assisting companies in understanding more about risks and mitigating, assessing, and efficiently managing risks (COSO, 2004).
From Asean Corporate Governance Association (ACGA) survey in 2020, it shows that the implementation of GCG in Indonesia is not really good compared to other countries with a score of 33.60% as shown in the Figure 1. This shows that the implementation of GCG in Indonesia must be reviewed with a harder effort from stakeholders to achieve a good and ideal implementation for companies in Indonesia.
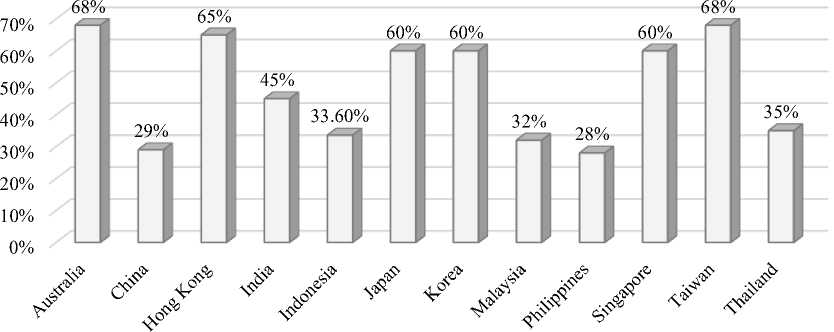
Figure 1. Percentage of GCG implementation in Asia Pacific Countries Source: ACGA (2020)
Indonesia have various corporate sectors, one of which is the manufacturing sector as the leading sector with an enormous contribution of 20.79% to Gross Domestic Product (GDP) of Indonesia in 2020 (Badan Pusat Statistik, 2020). Although the manufacturing sector in Indonesia is expected to grow significantly in 2020, not a single Indonesian company from the manufacturing sector has succeeded in being ranked as top ten company with the highest GCG score for industry sector in 2020 based on the assessment CLSA (2020). GCG's implementation for manufacturing companies in Indonesia needs to be reviewed in conjunction with stakeholders working even more challenging to achieve a better and ideal implementation. The role of government is also vital to maintain and pay attention to the manufacturing sector. Likewise, in terms of risk disclosure, companies included in the manufacturing sector must be prioritized because they are closely related to investment in these companies. Investors tend not to invest in risky companies; stock prices are impacted by decreased due to investors' decline in stock purchases against these companies (Sun et al., 2016). Stock prices and corporate value go hand in hand. The increase in stock prices will show increased corporate value and vice versa (Iswajuni et al., 2018).
To find out the effect of CCG on the corporate value, then moderating the connection with ERM is the purpose of this research. The importance of this research is to prove the signaling theory, GCG mechanisms, ERM disclosure, and the theories related to GCG, like agency theory and stewardship theory. Through this research, it is expected that every company can increase the understanding of CCG and ERM, which can affect corporate value. Besides that, this study is expected to contribute to regulators considering organizing the ERM regulation to reduce any asymmetric information. Therefore, determining and calculating the risk and the benefit of investing in a company is better for the investors.
Signaling theory refers to information about the company's past and future conveyed to the investors. The information can be utilized to evaluate whether the performance of the company is up to the task of surviving to face the competition. Before deciding to invest in a company, an investor needs complete information, accurate, comprehensive, and reliable information to use as material for analysis and consideration for making a decision (Jogiyanto, 2015:392).
The agency theory defines the different perceptions among the principal who becomes the company owner and the agent who becomes company management. As a result, the agency problem arises from agents who are more concerned with their personality than with the company's goals, even those that may conflict with or counteract the main goals of the company (Suhadak et al., 2019). The importance of voluntary disclosure as a way to monitor whether the company is running transparently or not (El-Diftar et al., 2017). Voluntary disclosure can be in the form of ERM disclosure, a procedure in the GCG framework that can monitor or control the mechanism in aligning the principals' agent connection to reduce agency problems (Maruhun et al., 2018).
As one of the theories from GCG, stewardship theory explains the loyalty of the managers in gaining high company performance. Gaining that will undoubtedly maximize the shareholder's profits and maintain the company's reputation (Limijaya et al., 2021). Subramanian (2018) emphasizes that a manager's stewardship can result in exemplary GCG practices when company values align with prevailing values, creating value for the shareholders. In analyzing its effect, several GCG mechanisms are used which are considered to affect corporate value, such as audit committee, ownership structure composed of institutional ownership, managerial ownership, independent commissioner, the board size, and board of director.
A company entity should implement GCG, which has an audit committee in the company (Indriastuti & Kartika, 2021). Research by Manu et al. (2019) obtained the results of a significant positive influence given by the audit committee on corporate value. With also supported by the research of Masitha and Djuminah (2019), which found that improvement in the implementation of GCG and corporate value go hand in hand. If there is an increase in one of them, the other will also increase. It is known that the ability to moderate the impact of the audit committee to corporate value with the existence of ERM due to the task of the audit committee is to control financial performance and assess whether the manager's report is functionally optimal or not. So it will make managers report risk management in the company's financial statements correctly and adequately (Burhanuddin et al., 2020; Sibarani and Lusmeida, 2021). Hence, the formulation of the hypothesis as follows:
H1a: Among the audit committee and corporate value have a significant positive effect.
H1b: The relationship between audit committee and corporate value moderated by enterprise risk management.
Suhadak et al. (2019) stated that the higher managerial ownership, the more control they have over the company’s operation so that the performance and corporate value are also affected. From the explanation, it can be concluded that managerial ownership positively influences corporate value. Anita and Yulianto (2016) also found the same result. The implementation of ERM disclosure makes the risk strategy even better because it prioritizes the company's primary goal, which is higher corporate value. In addition, the incompatibility of interests among agents and principals can be reduced (Burhanuddin et al., 2020; Rasmini, 2019). Hence, the formulation of the hypothesis as follows:
H2a: Among managerial ownership and corporate value have a significant positive effect.
H2b: The relationship between managerial ownership and corporate value moderated by
enterprise risk management.
Arifin (2017) states that the independent commissioner has significantly influenced corporate value in negative relationships. Because the appointment of an independent commissioner is only for legal purposes, not based on GCG implementation, it impacts supervision ineffectiveness, resulting in the company's performance decrease that can be represented in the financial statements. Likewise, the corporate value will decrease too. The same result was also found by Farida et al. (2019 and Indriawati et al. (2017). Burhanuddin et al. (2020) have research that stated between the independent commissioner and corporate value. There is a significant positive relationship after being moderated by ERM. It happens because the independent commissioner runs optimally, thus encouraging the implementation of GCG. Hence, the formulation of the hypothesis as follows:
H3a: Among the independent commissioner and corporate value there is a significant
negative effect.
H3b: The relationship between the independent commissioner and corporate value
moderated by enterprise risk management.
Handayani (2017) revealed that institutional ownership could significantly positively affect corporate value. If the value of institutional ownership is higher, it will reduce agency conflict because there will be more control over a company, impacting corporate value. Suhadak et al. (2019) also found a same result. Institutional ownership is part of GCG, which shows a positive influence given by institutional ownership to ERM. Institutional ownership can be a monitor in realizing good ERM by reducing the level of conflict in the company increasing the trust and confidence of investors to invest their capital in the company to enlarge the company's value (Hidayah et al., 2021). Hence, the formulation of the hypothesis as follows:
H4a: Among the institutional ownership and corporate value there is a significant positive
effect.
H4b: The relationship between institutional ownership and corporate value is moderated by
enterprise risk management.
The research of Ahulu and MacCarthy (2020) revealed that board size and corporate value have a significant positive relationship. This relationship is aligned with the theory of agency and GCG guidelines that separate which CEO position from the chairman of the board position will be impacted the performance of realizing maximum corporate value. The
more the number of boards, the higher the level of supervision to achieve more the value of the company. This statement which also supported by Husaini and Saiful (2017) and Mishra and Kapil (2018). As a part of GCG, board size positively influences ERM (Maruhun et al., 2018). So the board size is an important determinant of ERM implementation. Good ERM implementation will make the company aware of the risks that may occur and how to resolve them so it will not affect corporate value. Therefore, the formulation of the hypothesis as follows:
H5a: Among board size and corporate value is significant positive effect.
H5b: The relationship between board size and corporate value is moderated by enterprise risk management.
The results of the research (Indriastuti and Kartika, 2021; Ahulu and MacCarthy, 2020; Phuong and Hung, 2020; Masitha and Djuminah, 2019) explain the significant positive relationship of the board of directors on corporate value, this is because in the company there will always have a conflict between the directors and shareholders. Thus, the board of directors was formed as a mechanism to monitor the activities of the company's directors. The board of directors is one part of GCG, as stated in the research by Hidayah et al. (2021), which found a positive relationship between the board of directors and ERM. Align with the theory of agency that the existing board of directors can supervise managers under the board’s direction so managers' opportunistic behavior can be minimized, including risk management information to reduce information asymmetry. Moreover, the ERM existence can be considered in creating company management judgement to maintain the stability of the company's sustainability in the future. Hence, the formulation of the hypothesis as follows:
H6a: Among board of director and corporate value there is a significant positive effect.
H6b: The relationship between board of director and corporate value moderated by enterprise risk management.
METHODS
The listed companies on Indonesia Stock Exchange (IDX)/Bursa Efek Indonesia (BFE) are the population, whereas the company manufacturers are the sample. To collect the data using purposive sampling, with some criteria to be met. 1) Is a manufacturing company; 2) Has complete annual report data for the 2016-2020 period; and 3) reports its financial statements in Rupiah. It was discovered that 87 companies successfully met the previously mentioned criteria.
A quantitative approach was used as the design of this research to obtain answers through theory testing using the measurement of research variables (Creswell & Creswell, 2018:206). In this study, the data sources were used secondary data, namely annual reports, and financial reports for 2016-2020 from each sample company published on the IDX website (www.idx.co.id) and the company's official website.
This research is a hypothesis test that aims to recognize the significance of the nature of the correlation between variables by putting these variables to the test (Cooper & Schindler, 2014:428). The GCG hypothesis on corporate value will be tested in this study, and enterprise risk management variables will be used to moderate the relationship. A study model is developed to demonstrate an influence, such as a positive, negative, or no significant, as shown in Figure 2, with measurements listed in Table 1 below:
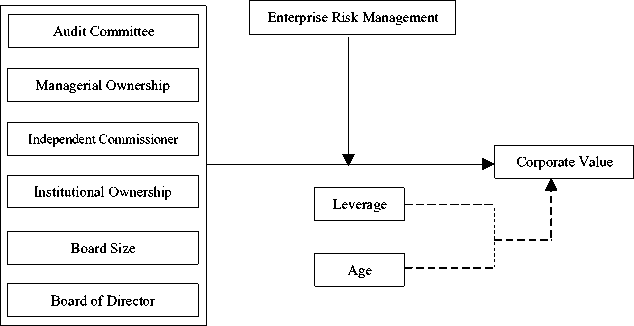
Figure 2. Research Model
Table 1. Variable Measurement
|
No. |
Variable Type |
Variable Name |
Measurement |
Source |
|
1. |
Dependent |
Corporate Value |
Market Value of Equity + Total Debt Total Asset |
Manu et al. (2019) |
|
2. |
Independent |
Audit Committee |
Number of Audit Members in the Company |
Handayani (2017) |
|
Managerial Ownership |
ΣShares owned by directors & commissio ΣShares outstanding |
Rahmadianti & Asandimitra (2017) | ||
|
Independent Commissioner |
ΣIndependent Commissioner ΣCommissioner |
Arifin (2017) | ||
|
Institutional Ownership |
ΣShares owned by institutions ΣShares outstanding |
Manurung et al. (2019) | ||
|
Board Size |
∑Director and Commissioner in the Company |
Ahulu & MacCarthy (2020) | ||
|
3. |
Moderation |
Board of Director ERM |
∑Director in the Company Disclosed items of ERM |
Phuong & Hung (2020) Husaini & Saiful (2017) |
|
108 | ||||
|
4. |
Control |
Leverage |
Total Amount of Debt |
Rahmadianti & |
|
Total Equity |
Asandimitra (2017) | |||
|
Age |
Research Year – First Listing Year |
Wahyudin & Solikhah (2017) |
Source: Data processed (2022)
In order to get more accurate research results, a program that is able to perform calculations on the data analysis of the research model is needed. Therefore, this research will be assisted by the E-Views 12 program. The panel data collected will be analyzed using the moderated regression analysis method. Classical assumption test isn’t required in panel regression because panel regression has the advantage primarily of being robust against multiple violations of Gauss Markov assumptions (Ajija, 2011; Gujarati, 2003). The following is the equation in this study:
CVit = α + β1ACit + β2MOit + β3ICit + β4IOit + β5BSIZEit + β6BODit + β7LEVit + β8AGEit
+ β9M1it + β10M2it + β11M3it + β12M4it + β12M5it + β13M6it +
εit........................................................................................................................... (1)
|
Where: | |||||
|
CVit |
= |
Corporate Value |
AGE |
= |
Age |
|
α |
= |
Constanta |
M1 |
= |
AC * ERM |
|
β1-13 |
= |
Coefficient |
M2 |
= |
MO * ERM |
|
AC |
= |
Audit Committee |
M3 |
= |
IC * ERM |
|
MO |
= |
Managerial Ownership |
M4 |
= |
IO * ERM |
|
IC |
= |
Independent Commissioner |
M5 |
= |
BSIZE * ERM |
|
IO |
= |
Institutional Ownership |
M6 |
= |
BOD * ERM |
|
BSIZE |
= |
Board Size |
ε |
= |
Error term |
|
BOD |
= |
Board of Director |
i |
= |
Cross section item |
|
LEV |
= |
Leverage |
t |
= |
Time series item |
RESULTS AND DISCUSSION
Table 2 gives information about the sample using the purposive sampling method to obtain it.
|
Table 2. Sample Selection | |
|
Description |
Number of Observations |
|
Companies listed on the Stock Exchange |
774 companies |
|
Companies that are not engaged in manufacturing |
(593 companies) |
|
Companies engaged in manufacturing |
181 companies |
|
Companies that do not meet the criteria |
(94 companies) |
|
Companies that meet the criteria and become as a research |
87 companies |
|
samples | |
|
Number of samples for 5 years |
435 samples |
|
Number of outliers |
(45 samples) |
|
Number of samples after outliers |
390 samples |
Source: Data processed (2022)
Thus, 87 companies meet the criteria, so the total sample is 435 data for five years. Due to the extreme data, an outlier test is needed, which refers to a Z-score less than -3 or more than 3 using SPSS version 26 so that the remaining data is 390 data that can be used in the next test.
Table 3. Descriptive Statistical Test Result
|
Variable |
Minimum |
Maximum |
Mean |
Std. Deviation |
|
Corporate Value |
0.3099 |
269.0054 |
3.9768 |
18.2644 |
|
Audit Committee |
0.0000 |
5.0000 |
3.0298 |
0.5138 |
|
Managerial Ownership |
0.0000 |
0.8732 |
0.0641 |
0.1615 |
|
Independent Commissioner |
0.0000 |
1.0000 |
0.3835 |
0.1284 |
|
Institutional Ownership |
0.0000 |
0.9971 |
0.6346 |
0.2633 |
|
Board Size |
3.0000 |
23.0000 |
9.3448 |
3.8336 |
|
Board of Director |
2.0000 |
16.000 |
5.1471 |
2.4118 |
|
ERM |
0.1296 |
0.6574 |
0.3559 |
0.0809 |
|
Leverage |
-10.1881 |
162.1920 |
1.4809 |
8.0101 |
|
Age |
2.0000 |
39.0000 |
21.3793 |
8.6619 |
Source: Data processed (2022)
Refer to Table 3 shows the corporate value with a minimum value of 0.3099 and a maximum value of 269.0054. Between the two values, there is a mean value of 3.9768.
Because of the maximum corporate value, the shareholders can be affected by their wealth to the maximum. In addition, the standard deviation value is shown to be 18.2644, and the resulting value exceeds the mean value. It indicates a reasonably significant deviation in the data on the corporate value to the mean value.
The maximum number of audit committees from the research sample is five people. Meanwhile, some companies do not have an audit committee at all. Judging from the mean value, the sample company has an audit committee of 3.0298. Variation audit committee among sample companies is not too high. It can be proven that the resulting standard deviation has a value smaller than the mean value (0.5138<3.0298). Refer to the official letter issued by BEJ with reference no. SE-008/BEJ/12-2001, which informs the composition of the audit committee must consist of three people, and the chairman is included. Moreover, the results of descriptive statistics for the audit Ie variable show that there are still companies that do not comply with the official letter issued by BEJ.
From 87 companies during 2016-2020, managerial ownership of manufacturing companies in Indonesia are not sufficiently spread out. The results of descriptive statistics on managerial ownership show that there are still managements that do not have ownership in the form of shares in their companies. The highest value of this variable is 0.8732, which means that the management owns 87.32% of the shares in the company. The mean value of 0.0641 describes the average percentage of managerial ownership of 6.41%. Then the value of standard deviation is 0.1615, which describes the relatively more significant deviation of the data.
Independent commissioner has a minimum and maximum value of 0.0000 and 1.0000. The mean value of 0.3835 indicates that the average independent commissioner for the five years is 38.35%, which has complied with OJK No. 33/POJK.04/2014 states that a public company must have at least two people as commissioners, and 30% consists of independent commissioners. The standard deviation value of 0.1284 means the data of the independent commissioner is less varied because it is smaller than the mean value.
Institutional ownership has the lowest value, namely 0.000 and 0.9971 as the highest value. The mean value shown is 0.6346, indicating that from all shareholders, the level of ownership from outside parties such as institutions or other companies is 63.46% which can make supervision even better. In addition, the standard deviation value is shown to be 0.2633, and the resulting value is not more than the mean value. It indicates a low deviation in the institutional ownership on the mean value.
Board size shows that three people as the minimum value, 23 people as the maximum value, and the average is 9.3448. These results indicate that all objects of research have complied with the regulations of UU RI No. 40 Tahun 2007, which provides information that a company should have a board size of at least two people. In addition, the deviation of the board size is relatively small because it is smaller than the mean value (3.8336 <9.3448).
The board of directors shows that the minimum value is two people, the maximum value is 16 people, and the average is 5,1471. In addition, the deviation of the board of directors is relatively small because it is smaller than the mean value (2.4118 <5.1471). The following variable is the moderating variable in enterprise risk management (ERM), with a 0.1296 as minimum and 0.6574 as a maximum value. The higher the value, the more strategies the company uses to manage and evaluate every risk that occurs in the company. The mean value of 0.3559 proves that the object in this study does not apply ERM. In addition, the standard deviation value is shown to be 0.0809, and the resulting value is not more than the mean value. It indicates a low deviation in the ERM variable data to the mean value.
Furthermore, the control variable is leverage which is proxied by DER. The analysis shows that the lowest DER value is -10.1881, and the highest DER value is 162.1920. A DER ratio value that exceeds 1 or 100% indicates that the fundamental condition of the company is not running well. The average leverage is 1.4809 or 148.09%. It indicates that many objects have poor fundamental conditions because their debts are more significant than their assets. In addition, the deviation of the leverage is relatively large because it is greater than the mean value (8.0101<1.4809).
The last variable, namely age, shows how long the company can maintain its existence in business competition. The minimum age of the object is two years and the maximum age indicated is 39 years. Judging from the mean value is shown at 21.3793 years, which means the average age of the object can maintain its existence in business competition for 19-20 years. In addition, the deviation of the age is classified as less varied because it is smaller than the mean value (8.6619<21.3793).
In the panel regression test, there will be three models, namely the common effect model (CEM), fixed effect model (FEM), and random effect model (REM). It takes some testing first so that the model used later is the best and by the conditions of the research data of the researcher as a whole. Each of these tests is described as follows:
Chow Test can be useful in selecting the best model between CEM and FEM. Refer to Table 4, which indicates that the best model is FEM with probability. Cross-section F and Cross Section Chi-Square are 0.000, smaller than α (α = 0.05). Thus, the test will continue with the Hausman Test.
Table 4. Chow Test Result
|
Effects Test |
Statistic |
d.f. |
Prob. |
|
Cross-section F |
11.380576 |
(80,301) |
0.0000 |
|
Cross Section Chi-Square |
543.059321 |
80 |
0.0000 |
Source: Data processed (2022)
Hausman test can be useful in choosing the best model between FEM and REM. Refer to Table 5, which indicates that the best model is REM with probability. Cross-section random is 0.3005 which is greater than α (α = 0.05). Thus, the test will continue with the Lagrange multiplier test.
Table 5. Hausman Test Result
|
Test Summary |
Chi-Sq Statistic |
Chi-Sq d.f. |
Prob. |
|
Cross-section random |
9.518136 |
8 |
0.3005 |
Source: Data processed (2022)
The Lagrange multiplier test can be useful in choosing the best model between FEM and CEM. Refer to Table 6, which indicates that the best model is REM with probability. Breusch-Pagan value is 0.0000, which is less than α (α = 0.05). Thus, REM is the best model for this research from these three tests.
Table 6. Lagrange Multiplier Test Result
|
Cross Section |
Time |
Both | |
|
Breusch-Pagan |
357.1095 |
0.227857 |
357.3374 |
|
(0.0000) |
(0.6331) |
(0.0000) |
Source: Data processed (2022)
Table 7. F-Test Result – Random Effect Model
|
Weighted Statistics |
Sig. |
Result |
|
Prob (F-Statistic) |
0.006781 |
Significant |
Source: Data processed (2022)
Table 8. T-Test Result
|
Variable |
Coefficient |
Prob. |
Result |
Hypothesis |
|
Constant |
0.616205 |
0.8119 |
- |
- |
|
Audit Committee |
3.938609 |
0.0043 |
Significant Positive |
Accepted |
|
Managerial Ownership |
-28.69496 |
0.0662 |
Insignificant |
Rejected |
|
Independent Commissioner |
-12.02192 |
0.0410 |
Significant Negative |
Accepted |
|
Institutional Ownership |
-0.506312 |
0.9152 |
Insignificant |
Rejected |
|
Board Size |
-0.468880 |
0.5570 |
Insignificant |
Rejected |
|
Board of Director |
0.044213 |
0.9716 |
Insignificant |
Rejected |
|
Leverage |
-0.090275 |
0.1751 |
- |
- |
|
Age |
-0.009222 |
0.7984 |
- |
- |
Source: Data processed (2022)
Based on the results of the F-test in Table 7, it indicates that there is an effect of the independent variable on the dependent variable simultaneously. The F-test results' probability value (F-Statistic) does not exceed 0.05.
The hypothesis test consists of a T-test and a test of the effect of moderating variables. By using the hypothesis test can show a significant effect of the independent variable on the dependent and also the effect of the moderating variable. Through Table 8 and Table 9, the results of hypothesis testing on REM can be shown.
Table 9. Result of Moderating Effect
|
Variable |
Coefficient |
Prob. |
Result |
Hypothesis |
|
M1 |
-9.436867 |
0.0071 |
Moderate |
Accepted |
|
M2 |
97.71434 |
0.0403 |
Moderate |
Accepted |
|
M3 |
24.26403 |
0.1501 |
Not Moderating |
Rejected |
|
M4 |
5.362996 |
0.6638 |
Not Moderating |
Rejected |
|
M5 |
1.947284 |
0.3273 |
Not Moderating |
Rejected |
|
M6 |
-1.152591 |
0.7111 |
Not Moderating |
Rejected |
Source: Data processed (2022)
From the results of the hypothesis test, the moderated regression analysis equation with panel data regression REM model in this research can be formed as follows:
CVit=0.616205 + 3.938609ACit - 28.69496MOit - 12.02192ICit - 0.506312IOit -
0.468880BSIZEit + 0.044213BODit - 0.090275LEVit - 0.009222AGEit -
9.436867M1it + 97.71434M2it + 24.26403M3it + 5.362996M4it + 1.947284M5it -1.152591M6it+ε....................................................................................................... (2)
The probability value of 0.0043 and the coefficient value of 3.938609 concluded that the audit committee has a significant positive influence on the corporate value given by the audit committee because the probability value is not greater than 0.05. It can be done through internal control to produce a high-quality financial report for a company because an audit committee can analyze the credibility of a financial report that investors usually use as a source to assess the feasibility of a company before investing in the company. It will also
positively affect the corporate value. Thus, H1a is accepted, and this result is in sync with the research proposed by (Indriastuti & Kartika, 2021; Manu et al., 2019; Masitha & Djuminah, 2019; Samasta et al., 2018; Chairunesia & Sulistiyani, 2019). With the existence of ERM, that is able to moderate audit committee with corporate value. The disclosure of the company's risk management can positively signal investors regarding the quality of the resulting financial reports, which is the responsibility of the audit committee. Thus, it can encourage the growth of corporate value. H1b was accepted, and the same results were also found in the research by Burhanuddin et al. (2020) and Sibarani and Lusmeida (2021).
With the data obtained from the test results can indicate that managerial ownership is not significant to corporate value. Therefore, H2a is rejected, and these results are in sync with the research that has been proposed by (Rahmadianti & Asandimitra, 2017; Hertina et al. 2021; Ilmi et al. 2017; Ratnasari et al. 2018; Trisnawati et al. 2020; Chairunesia & Sulistiyani, 2019; Farida et al. 2019). In terms of moderation, managerial ownership and corporate value can be moderated by ERM. It is proven the probability value obtained has a value less than 0.05. Through managerial ownership, the incompatibility of interests among agents and principals can be reduced. The implementation of ERM disclosure makes the risk strategy even better because it prioritizes the company's primary goal, namely corporate value (Burhanuddin et al. 2020; Rasmini, 2019; Trisnawati et al. 2020). Thus, H2b is accepted.
Independent commissioner has a significant negative effect because the probability value is not more than 0.05, and the coefficient value is negative. It is appointing an independent commissioner only for legal purposes, not based on the implementation of GCG. It impacts ineffectiveness in supervision, which results in the company's performance decrease that can be represented in the financial statements. Likewise, the corporate value will decrease too. Thus, H3a is accepted, and these results are in sync with the research that has been proposed by (Arifin, 2017; Farida et al. 2019; Indriawati et al. 2017). In terms of being moderated by the ERM variable, the test results show that among independent commissioner and corporate value can’t be moderated by ERM. Because when a risk is faced by a company, risk management is needed which will be delegated directly to related parties under the company's board such as the risk committee or audit committee and other supporting committees according to regulation that issued by OJK with reference no. 17/POJK.03/2014. Therefore, H3b is rejected, and these results are in sync with the research that has been proposed by (Sibarani & Lusmeida, 2021; Rivandi, 2018; Sari, 2013; Agista et al. 2017).
Table 8 indicates that institutional ownership is not significant to corporate value because the probability value is more than 0.05. Because when a potential investor invests in the company, the potential investor does not see who the institutional investor is. However, it will look at company management and corporate value. Thus, H4a is rejected, and these results are in sync with the research that has been proposed by (Rahmadianti & Asandimitra, 2017; Chairunesia & Sulistiyani, 2019; Manurung et al. 2019; Puspaninggiri, 2021; Samasta et al. 2018; Farida et al. 2019; Hertina et al. 2021). In terms of moderation, institutional ownership and corporate value can not be moderated by ERM. Institutional ownership in the composition of shares does not affect the implementation of ERM in a company because, in ERM disclosure, supervision remains to the management. Therefore, H4b is rejected, and the same result was also found by Jamaluddin et al. (2020).
Board size is not significant to corporate value because the probability value is 0.5570. Because the salary paid to the directors will increase the company's cost, decisionmaking takes longer if there are more boards in the company and the issue of agency conflict
is not being effectively examined in front of many councils. Thus, H5a is rejected, and this result is in sync with the research proposed by (Asante-Darko et al. 2018; Nguyen et al. 2016; Oktari et al. 2018; Bhat et al. 2018). In terms of being moderated by the ERM variable, the test results show that board size and corporate value can not be moderated by ERM. So H5b is rejected because the board size that exceeds seven people will usually result in communication problems, and coordination among the boards usually becomes more ineffective. So when a company has many investment opportunities, the board size with many members does not necessarily reduce the company's ability to choose projects that have the potential to pose a risk to the company. Although more projects are likely to be disapproved, there will still be risky projects that pass the board selection process. Therefore, the company must be able to implement good investments that will ultimately contribute to higher corporate value. Thus, H5b is rejected, and the same result was also found by (Akbar et al. 2017; Allini et al. 2016; Tao & Hutchinson, 2013; Makoto & Pascal, 2012).
The board of directors has probability values and coefficient values of 0.9716 and 0.044213. These results indicate that the board of directors is not significant to corporate value because the probability value is more than 0.05. Thus, H6a is rejected, and this result is in sync with the research proposed by (Samasta et al. 2018; Arora & Sharma, 2016; Kritika & Choudhary, 2015; Alfaraih et al. 2012). In terms of moderation, board of directors and corporate value can not be moderated by ERM. Therefore, H6b is rejected. It is necessary to review the board of directors' involvement in implementing ERM. Therefore, the board of directors must be active in ensuring the successful implementation of ERM through monitoring activities. The same result was also found by Kanu (2020) and Selamat and Ibrahim (2018).
With the adjusted R-Square in Table 10, which shows a value of 4.216%, the independent variable is able to explain the dependent variable. The rest is explained by other variables not tested in this study. Examples are foreign ownership, female board, BOD meeting frequency, gender board, firm size, and auditors’ reputation.
Table 10. Coefficient of Determination Test Result
Dependent Variable R-squared Adjusted R-squared
Corporate Value 0.076633 0.042160
Source: Data processed (2022)
This study supports signaling theory because an investor needs information about a company's risk profile, which is a place where investors invest their capital. The wider the risk disclosure, the better information for investors (Rasmini, 2019). Because it can implement good risk management to minimize problems that will threaten the company to maintain its business continuity, according to Moudud-Ul-Huq et al. (2020) and Shan (2019), shows that among managerial ownership, theory of agency is not closely related. From the agency theory point of view, the incompatibility of interests among agents and principals is caused by management failing to optimize the owner's welfare. By implementing ERM disclosures, the company's risks that may become a failure can be minimized. Thus, agency theory is supported in this study.
Research of (Shan, 2019; Kyere & Ausloos, 2021; Taufik & Chua, 2016; Makhlouf et al. 2017) revealed that the board of directors supporting stewardship theory must have a composition of directors that is greater than independent directors in a significant proportion. For decision-making to be effective and efficient, directors better understand business performance. The change in regulation No I-A states that issuers do not need to have an
independent director since it was implemented on December 27, 2018. Because this research covers the research year from 2016 to 2020, the first three years, there is still a composition of independent directors on the board of directors. Therefore, this study does not support stewardship theory.
CONCLUSION
This study aims to analyze the manufacturing sector seen in the influence of GCG on corporate value and then moderate the relationship. The GCG mechanism includes six variables: audit committee, managerial ownership, institutional ownership, board size, independent commissioner, and board of directors. Moreover, the conclusions obtained from the explanation of the discussion show a significant positive effect of the audit committee on corporate value, the independent commissioner has a significant negative effect, and the others do not affect corporate value. Furthermore, in terms of moderating relationships, ERM can moderate the relationship between the audit committee and corporate value and managerial ownership and corporate value. Through the result of this research, it is expected that every company can increase the understanding of CCG and ERM, which can affect corporate value. Besides that, this study is expected to contribute to regulators considering organizing the ERM regulation to reduce any asymmetric information. Therefore, determining and calculating the risk and the benefit of investing in a company is better for the investors. Several limitations were found in carrying out this research, such as the relatively short research time from 2016-2020 and the low adjusted R-Square value. In further research, there are several recommendations, such as expanding the period and the companies that will be used in further research. The data obtained can be studied more and show more significant results. Then further research can consider another good corporate governance mechanism that may affect corporate value. There are more sources for more indepth research and samples from other countries, so it is not limited to samples from Indonesia.
REFERENCES
ACGA. (2020). CG Watch 2020 (Future promise: Aligning governance and ESG in Asia). In Science and Public Policy. https://doi.org/10.1093/spp/15.1.67
Agista, G. G., Putu, N., & Harta, S. (2017). Pengaruh Corporate Governance Structure Dan Konsentrasi Kepemilikan Pada Pengungkapan Enterprise Risk Management. E-Jurnal Akuntansi, 2017(1), 438–466.
Ahulu, H., & MacCarthy, J. (2020). Does Corporate Governance Structures Predict Firm’s Market Value? Empirical Evidence From Ghana. International Journal of Economics and Financial Issues, 10(1), 52–58. https://doi.org/10.32479/ijefi.8874
Akbar, S., Kharabsheh, B., Poletti-Hughes, J., & Shah, S. Z. A. (2017). Board Structure and Corporate Risk Taking in the UK Financial Sector. International Review of Financial Analysis, 50(February), 101–110. https://doi.org/10.1016/j.irfa.2017.02.001
Alfaraih, M., Alanezi, F., & Almujamed, H. (2012). The Influence of Institutional and Government Ownership on Firm Performance: Evidence from Kuwait. International Business Research, 5(10), 192–200. https://doi.org/10.5539/ibr.v5n10p192
Allini, A., Manes Rossi, F., & Hussainey, K. (2016). The Board’s Role in Risk Disclosure: An Exploratory Study of Italian Listed State-Owned Enterprises. Public Money and Management, 36(2), 113–120. https://doi.org/10.1080/09540962.2016.1118935
Anita, A., & Yulianto, A. (2016). Pengaruh Kepemilikan Manajerial dan Kebijakan Dividen terhadap Nilai Perusahaan. Management Analysis Journal.
Arifin, J. (2017). Corporate Governance and Intellectual Capital on Firm Value of Banking Sector Companies Listed at Indonesia Stock Exchange in Period 2008-2012. Wacana, Jurnal Sosial Dan Humaniora, 20(1), 36–47.
https://doi.org/10.21776/ub.wacana.2017.020.01.5
Arora, A., & Sharma, C. (2016). Corporate Governance and Firm Performance in Developing Countries: Evidence from India. Corporate Governance (Bingley), 16(2), 420–436. https://doi.org/10.1108/CG-01-2016-0018
Asante-Darko, D., Adu Bonsu, B., Famiyeh, S., Kwarteng, A., & Goka, Y. (2018). Governance Structures, Cash Holdings and Firm Value on the Ghana Stock Exchange. Corporate Governance: The International Journal of Business in Society, 18(4), 671– 685. https://doi.org/10.1108/CG-07-2017-0148
Badan Pusat Statistik. (2020). Perkembangan Indeks Produksi Industri Manufaktur 2020.
Bhat, K. U., Chen, Y., Jebran, K., & Bhutto, N. A. (2018). Corporate Governance and Firm Value: A Comparative Analysis of State and Non-State Owned Companies in the Context of Pakistan. Corporate Governance: The International Journal of Business in Society, 18(6), 1196–1206. https://doi.org/10.1108/CG-09-2017-0208
Burhanuddin, F. F., Pagalung, G., & Damayanti, R. . (2020). The Role of Enterprise Risk Management as a Moderation in Increasing Company Value. International Journal of Innovative Science and Research Technology, 5(9), 778–785.
https://doi.org/10.38124/ijisrt20sep611
Candy. (2021). Best Practice of Enterprise Risk Management: The Impact on Rurals’ Bank Performance. International Journal of Economics, Business and Accounting Research (IJEBAR), 2021(2), 231–237.
Chairunesia, W., & Sulistiyani, E. (2019). The Effect of Profit Management on Corporate Value with Good Corporate Governance Mechanisms as Moderated Variables ( Case Study in Property and Real Estate Companies Registered on the Indonesia Stock Exchange 2012-2017). Saudi Journal of Economics and Finance, 3(8), 331–343. https://doi.org/10.21276/sjef.2019.3.8.3
CLSA. (2020). CG Watch 2020 Preview (Future promise: Aligning governance and ESG in Asia) (Vol. 15, Issue 1). https://doi.org/10.1093/spp/15.1.67
Cooper, D. R., & Schindler, P. S. (2014). Business Research Methods 12th Edition. In Business Research Methods. McGraw-Hill/Irwin.
COSO. (2004). Enterprise Risk Management-Integrated Framework.
https://doi.org/10.1002/9781119201939.app4
Creswell, J. W., & Creswell, J. D. (2018). Research and Design Qualitative, Quantitative and Mixed Methods Approaches. In Thousand Oaks California. SAGE Publications, Inc.
El-Diftar, D., Jones, E., Ragheb, M., & Soliman, M. (2017). Institutional Investors and Voluntary Disclosure and Transparency: The Case of Egypt. Corporate Governance (Bingley), 17(1), 134–151. https://doi.org/10.1108/CG-05-2016-0112
Farida, F., Ramadhan, A., & Wijayanti, R. (2019). The Influence of Good Corporate Governance and Corporate Social Responsibility on Firm Value: Evidence from Indonesia. International Journal of Economics and Financial Research, 5(57), 177–183. https://doi.org/10.32861/ijefr.57.177.183
Handayani, B. D. (2017). Mekanisme Corporate Governance, Enterprise Risk Management, Dan Nilai Perusahaan Perbankan. Jurnal Keuangan Dan Perbankan, 21(1), 70–81. https://doi.org/10.26905/jkdp.v21i1.1228
Hertina, D., Erizal, R., & ... (2021). Corporate Value Impact of Managerial Ownership, Institutional Ownership and Audit Committee. Psychology And Education, 58(3), 14–
22.
Hidayah, R., Faizah, S. N., Sukirman, S., Suryandari, D., & Zahid, A. (2021). Corporate Governance, Enterprise Risk Management, and Company Performance. Management Analysis Journal.
Husaini, & Saiful. (2017). Enterprise Risk Management, Corporate Governance and Firm Value: Empirical Evidence from Indonesian Public Listed Companies. International Journal of Advances in Management and Economics, 6(6), 16–23.
Ilmi, M., Kustono, A. S., & Sayekti, Y. (2017). Effect of Good Corporate Governance , Corporate Social Responsibility Disclosure and Managerial Ownership To the Corporate Value With Financial Performance As Intervening Variables: Case on Indonesia Stock Exchange. 1, 75–88.
Indriastuti, M., & Kartika, I. (2021). Improving Firm Value through Intellectual Capital, Good Corporate Governance and Financial Performance. Jurnal Ilmiah Akuntansi, 6(1), 85. https://doi.org/10.23887/jia.v6i1.30993
Indriawati, F., Ayu, D., & Sari, P. (2017). Proportion of the Independent Commissioners Board , Institutional Ownership and Its Characteristics Effect on Discussion of Sukarela in Annual Report (Empirical Study of Manufacturing Companies Listed on BEI). Research Journal of Finance and Accounting, 8(12), 55–64.
Iswajuni, I., Manasikana, A., & Soetedjo, S. (2018). The Effect of Enterprise Risk Management (ERM) on Firm Value in Manufacturing Companies Listed on Indonesian Stock Exchange Year 2010-2013. Asian Journal of Accounting Research, 3(2), 224–235. https://doi.org/10.1108/AJAR-06-2018-0006
Jamaluddin, J., Hermanto, S. B., & Fidiana, F. (2020). Mekanisme Corporate Governance Terhadap Nilai Perusahaan dengan Enterprise Risk Management sebagai Variabel Intervening. Wahana: Jurnal Ekonomi, Manajemen Dan Akuntansi, 23(1), 59–80. https://doi.org/10.35591/wahana.v23i1.185
Jogiyanto, H. (2015). Teori Portofolio dan Analisis Investasi (Edisi 10). Yogyakarta: BPFE.
Kritika, & Choudhary, V. (2015). Impact of Board Size on Firm Performance: A study of Selected BSE 500 Companies. Apeejay Journal of Management and Technology, 10(1), 34–40.
Kyere, M., & Ausloos, M. (2021). Corporate Governance and Firms Financial Performance in the United Kingdom. International Journal of Finance and Economics, 26(2), 1871– 1885. https://doi.org/10.1002/ijfe.1883
Limijaya, A., Hutagaol-Martowidjojo, Y., & Annisa, S. (2021). Corporate Governance Award and Performance of Indonesian LQ45 Firms. IOP Conference Series: Earth and Environmental Science, 729(1). https://doi.org/10.1088/1755-1315/729/1/012136
Makhlouf, M. H., Laili, N. H., Basah, M. Y. A., & Ramli, N. A. (2017). Board of Directors’ Effectiveness and Firm Performance: Evidence from Jordan. Research Journal of Finance and Accounting, 8(18), 23–34.
https://www.researchgate.net/publication/320130813
Makoto, N., & Pascal, N. (2012). Board Size and Corporate Risk-Taking: Further Evidence from Japan. Corporate Governance: An International Review, 20(4), 369–387.
Manu, R. E. H. R., Alhabsji, T., Taher, S. M., & Nuzula, N. F. (2019). The Effect of Corporate Governance on Profitability, Capital Structure and Corporate Value. Research Journal of Finance and Accounting, 10(2019). https://doi.org/10.7176/RJFA
Manurung, E., Effrida, E., & Gondowonto, A. J. (2019). Effect of Financial Performance, Good Corporate Governance and Corporate Size on Corporate Value in Food and Beverages. International Journal of Economics and Financial Issues, 9(6), 100–105.
https://doi.org/10.32479/ijefi.8828
Maruhun, E. N. S., Abdullah, W. R. W., & Atan, R. (2018). Assessing the Effects of Corporate Governance on Enterprise Risk Management and Firm Value: Malaysian Evidence. International Journal of Economics and Management, 12(Special Issue 2), 413–430.
Maruhun, E. N. S., Abdullah, W. R. W., Atan, R., & Yusuf, S. N. S. (2018). The Effects of Corporate Governance on Enterprise Risk Management: Evidence from Malaysian Shariah-Compliant Firms. International Journal of Academic Research in Business and Social Sciences, 8(1). https://doi.org/10.6007/ijarbss/v8-i1/3893
Masitha, Z., & Djuminah, D. (2019). Influence of Corporate Governance on Firm Value Through Intellectual Capital and Corporate Social Responsibility. Journal of Public Administration and Governance, 9(4), 148. https://doi.org/10.5296/jpag.v9i4.15135
Mishra, R. K., & Kapil, S. (2018). Board Characteristics and Firm Value for Indian companies. Journal of Indian Business Research, 10(1), 2–32.
https://doi.org/10.1108/JIBR-07-2016-0074
Moudud-Ul-Huq, S., Biswas, T., & Proshad Dola, S. (2020). Effect of Managerial Ownership on Bank Value: Insights of an Emerging Economy. Asian Journal of Accounting Research, 5(2), 241–256. https://doi.org/10.1108/AJAR-03-2020-0016
Nguyen, P., Rahman, N., Tong, A., & Zhao, R. (2016). Board Size and Firm Value: Evidence from Australia. Journal of Management and Governance, 20(4), 851–873.
https://doi.org/10.1007/s10997-015-9324-2
Oktari, V., Mela, N. F., & Zarefar, A. (2018). The Influence of Good Corporate Governance on Company Value in Jakarta Islamic Index Companies. Jurnal Akuntansi Keuangan Dan Bisnis, 11(1), 69–78.
Phuong, N. T. T., & Hung, D. N. (2020). Impact of Corporate Governance on Corporate Value: Research in Vietnam. Research in World Economy, 11(1), 161–170.
https://doi.org/10.5430/rwe.v11n1p161
Puspaninggiri, E. (2021). The Influence of Profitability, Leverage and Good Corporate Governance on Company Value. Jurnal RAK (Riset Akuntansi Keuangan), 6(1), 99–120.
Rahmadianti, D. P., & Asandimitra, N. (2017). Internal Factors, Corporate Governance, Corporate Social Resposibility Disclosure and Company Value in Indonesia. International Journal of Applied Business and Economic Research, 15(4), 439–445.
Rasmini, N. K. (2019). Pengaruh Kepemilikan Manajerial Pada Nilai Perusahaan Dengan Pengungkapan Enterprise Risk Management Sebagai Variabel Pemoderasi. Matrik: Jurnal Manajemen, Strategi Bisnis Dan Kewirausahaan, 13(2), 234.
https://doi.org/10.24843/matrik:jmbk.2019.v13.i02.p11
Ratnasari, D., Chomsatu Samrotun, Y., & Wijayanti, A. (2018). Effect of Financial Performance and Good Corporate Governance on Value of Company. EBA Journal: Journal Economics, Bussines and Accounting, 4(2), 10–21.
https://doi.org/10.32492/eba.v4i2.610
Rivandi, M. (2018). Pengaruh Enterprise Risk Management Disclosure dan Corporate Governance Terhadap Nilai Perusahaan. Jurnal Benefita, 3(2), 137.
https://doi.org/10.22216/jbe.v3i2.3113
Samasta, A. S., Muharam, H., & Haryanto, A. M. (2018). The Effect of Board Of Director, Audit Committee, Institutional Ownership To Firm Value, with Firm Size, Financial Leverage and Industrial Sector as Control Variables (Study On Listed Companies In Indonesian Stock Exchange Period 2011-2015). Jurnal Bisnis Strategi, 27(1), 53. https://doi.org/10.14710/jbs.27.1.53-62
Santigie Kanu, M. (2020). The Role of Risk Culture in Enterprise Risk Management Implementation. International Journal of Business and Management, 15(11), 13.
https://doi.org/10.5539/ijbm.v15n11p13
Sari, F. J. (2013). Implementasi Enterprise Risk Management pada Perusahaan Manufaktur di Indonesia. Accounting Analysis Journal, 2(2), 163–170.
Selamat, M. H., & Ibrahim, O. (2018). The Moderating Effect of Risk Culture in Relationship between Leadership and Enterprise Risk Management Implementation in Malaysia. Business Management and Strategy, 9(1), 244. https://doi.org/10.5296/bms.v9i1.12140
Shan, Y. G. (2019). Managerial Ownership, Board Independence and Firm Performance. Accounting Research Journal, 32(2), 203–220. https://doi.org/10.1108/ARJ-09-2017-0149
Sibarani, L., & Lusmeida, H. (2021). Impact of Good Corporate Governance Towards Corporate Value With Enterprise Risk Management As Moderating Variable (Empirical Study of Financial Companies Listed in Idx for the Period 2017-2019). Ultima Management: Jurnal Ilmu Manajemen, 13(1), 74-98.
https://doi.org/10.31937/manajemen.v13i1.1957
Steinberg, R. M. (2011). Governance, Risk Management, and Compliance. John Wiley & Sons, Inc.
Subramanian, S. (2018). Stewardship Theory of Corporate Governance and Value System: The Case of a Family-owned Business Group in India. Indian Journal of Corporate Governance, 11(1), 88–102. https://doi.org/10.1177/0974686218776026
Suhadak, Kurniaty, Handayani, S. R., & Rahayu, S. M. (2019). Stock Return and Financial Performance as Moderation Variable in Influence of Good Corporate Governance Towards Corporate Value. Asian Journal of Accounting Research, 4(1), 18–34.
https://doi.org/10.1108/AJAR-07-2018-0021
Sun, X. Q., Shen, H. W., Cheng, X. Q., & Zhang, Y. (2016). Market Confidence Predicts Stock Price: Beyond Supply and Demand. PLoS ONE, 11(7), 1–10.
https://doi.org/10.1371/journal.pone.0158742
Tao, N. B., & Hutchinson, M. (2013). Corporate Governance and Risk Management: The Role of Risk Management and Compensation Committees. Journal of Contemporary Accounting and Economics, 9(1), 83–99. https://doi.org/10.1016/j.jcae.2013.03.003
Taufik, M., & Chua, L. (2016). BOD Characteristics and Firm Performances : Evidence from Indonesia. Sebelas Maret Business Review, 6(2), 99–110.
Trisnawati, N., Dewi, M. S., & ... (2020). Increasing Corporate Value Through Managerial and Enterprise Risk Management (ERM) Disclosure. International Journal of …, 4(3), 383–389. https://ejournal.undiksha.ac.id/index.php/IJSSB/article/view/26566
Wahyudin, A., & Solikhah, B. (2017). Corporate Governance Implementation Rating in Indonesia and Its Effects on Financial Performance. Corporate Governance (Bingley), 17(2), 250–265. https://doi.org/10.1108/CG-02-2016-0034
Zulfikar, R. (2018). Estimation model and selection method of panel data regression: An overview of common effect, fixed effect, and random effect model. 10.
Discussion and feedback