Effect of Liquidity and Managerial Ownership on the Usage of Derivative Instruments and Company Risk
on
Henny Rahyuda, Pengaruh Likuiditas dan Kepemilikan Manajerial…

MATRIK: JURNAL MANAJEMEN, STRATEGI BISNIS DAN KEWIRAUSAHAAN
Homepage: https://ojs.unud.ac.id/index.php/jmbk/index
Vol. 16 No. 1, Februari (2022), 1-17
Effect of Liquidity and Managerial Ownership on the Usage of
Derivative Instruments and Company Risk
Henny Rahyuda, Made Reina Candradewi
Faculty of Economics and Business Udayana University
DOI : https://doi.org/10.24843/MATRIK:JMBK.2022.v16.i01.p01

ABSTRAK
Penelitian ini bertujuan untuk menganalisis pengaruh likuiditas, kepemilikan manajerial dan penggunaan derivatif terhadap risiko perusahaan manufaktur di Bursa Efek Indonesia (BEI). Penelitian ini dilakukan dengan menggunakan pendekatan kuantitatif. Populasi dalam penelitian ini adalah seluruh perusahaan manufaktur yang terdaftar di BEI. Teknik penentuan sampel yaitu dengan purposive sampling method. Perusahaan-perusahaan yang termasuk ke dalam sampel penelitian ini adalah perusahaan manufaktur yang menggunakan instrument derivatif dan selalu terdaftar di BEI tahun 2016 sampai 2018. Sebanyak 12 perusahaan yang dapat digunakan sebagai sampel dalam penelitian ini. Berdasarkan hasil analisis regresi dan uji mediasi, dapat disimpulkan bahwa variabel kepemilikan manajerial berpengaruh positif signifikan terhadap penggunaan instrumen derivatif. Variabel penggunaan instrument derivatif berpengaruh negatif signifikan terhadap risiko perusahaan. Penggunaan instrumen derivatif mampu memediasi hubungan antara kepemilikan manajerial dan risiko perusahaan.
Kata kunci: Financial Indicators; Corporate Governance; Variable Ekonomi Makro; Financial Distress.
ABSTRACT
This study aims to analyze the effect of liquidity, managerial ownership and use of derivatives on corporate risk of manufacturing companies on the Indonesia Stock Exchange IDX.. This research was conducted using a quantitative approach. The population in this study are all manufacturing companies listed on the IDX. The sampling technique used was purposive sampling method. The companies included in the sample of this study are manufacturing companies that use derivative instruments and are always listed on the IDX from 2016 to 2018. A total of 12 companies can be used as final samples in this study. Based on the results of regression analysis and mediation test, it can be concluded that the managerial ownership variable has a significant positive effect on the Usage of Derivative Instruments. The variable Usage of Derivative Instruments has a significant negative effect on company risk. The Usage of Derivative Instruments is able to mediate the relationship between managerial ownership and corporate risk.
Keyword: Financial Indicators; Corporate Governance; Macroeconomic; Financial Distress.
INTRODUCTION
The companies have a very important role for the economy of a country. The companies are also the main factor that determines the movement of the business world. In 2019, a total of 606 companies were listed on the Indonesian capital market, namely the Indonesia Stock Exchange (IDX). Of all the companies listed on the IDX, 28% are manufacturing companies. But now, the main challenge for the company is how the company is able to face the increasing risk. Globalization, liberalization and technological advances cause companies to have various kinds of risks that must be faced such as exchange rate risk, risk of changes in interest rates, market risk, credit risk, operational risk, technology risk,
credit risk, liquidation risk, risk of changes in commodity prices, risk of global financial crisis and others (Saunders & Cornett, 2014). These risks are difficult to avoid, can occur at any time and at worst can result in bankruptcy for the company. The volatility of the company's stock returns can be used to measure all risks faced by the company (Bartram et al., 2009). Research on how to deal with corporate risk is very important to do.
Based on previous research, liquidity, managerial ownership and usage of derivative instruments are important factors that can affect company risk (Biase & Apolito, 2012; Capozza & Seguin, 2003; Gatopoulos & Louberge, 2013). Liquidity is a financial ratio that reflects the company's ability to meet its short-term needs by using the company's current assets. The higher the liquidity of a company, the lower the risk because the company has ability to meet its short-term needs (Biase & Apolito, 2012). Managerial ownership is the number of shares owned by management from all share capital in the company. Managerial ownership has important role to invest in assets that have lower risk and decide to use lower proportion of debt, thus the total risk of the company tends to decrease (Capozza & Seguin, 2003). Derivative instruments are a tool for companies and other users to reduce company risk (Gatopoulos & Louberge, 2013). When a company reduces its risk exposure by using derivatives, this is referred to as hedging.
Besides, liquidity and managerial ownership also can influence the usage of derivatives by the company as a hedging instrument (Lantara, 2010; Biase & Apolito, 2012; Tufano, 1996). When the companies have problem with their liquidity, they tend to use derivatives instrument to overcome this probrem (Lantara, 2010). The companies with a lager proportion of managerial ownership tend to have a greater motivation to use derivatives as risk management tools (Tufano, 1996). Therefore, it could be observed that the usage of derivative instrument could have a mediation role. This study aims to analyze the effect of liquidity and managerial ownership on the Usage of Derivative Instruments and corporate risk in manufacturing companies listed on the Indonesia Stock Exchange (IDX). In-depth research on the influence of liquidity and managerial ownership on the Usage of Derivative Instruments and corporate risk is still very much needed in Indonesia. The implementation of this research is expected to help companies in Indonesia in tackling corporate risks, so that companies are able to survive and contribute to the Indonesian economy.
Risk can be defined as an adverse event (Hanafi, 2014). The types of risks faced by the company are physical asset risk, employee risk, legal risk, interest rate risk, currency exchange risk, market risk, credit risk, liquidity risk, operational risk, and country risk. Meanwhile, according to Horne & Warchowicz (2008) company risk is categorized into three types of risk: business risk, financial risk and total risk. Aggregate company risk can be measured by calculating the volatility of the company's stock returns (Guay, 1999). Thus, the risk of the company referred to in this study is the volatility of daily stock returns for one year in manufacturing companies on the IDX for the 2016-2018 period.
Liquidity reflects the company's ability to meet its short-term needs by using the current assets of the company Horne & Warchowicz (2008). The level of liquidity in a company also affects the company's ability to take available investment opportunities. If the company is unable to take the investment opportunity due to short-term liquidity constraints, then the company tends to use derivative instruments by means of hedging to overcome this problem (Froot, 1993). Research by Carter & Sinkey (1998) concludes that liquidity problems in a company are closely related to the need to use derivatives as hedging instruments. Research by Lantara (2010) proves that the company's liquidity is very influential on the Usage of Derivative Instruments negatively and significantly. The company's liquidity level can be measured by calculating the company's Current Ratio.
Hypothesis 1: Liquidity has a negative and significant effect on the Usage of Derivative Instruments.
Ownership structure is an important factor of corporate governance that can affect the use of derivatives. In his research, Lantara (2010) stated that companies that have a greater proportion of shares held by managerial, then company leaders have a greater motivation to use derivative instruments in order to reduce risk and increase company value. This is because the management of the company is part of the shareholders so that it has the same goal as other shareholders, namely to increase company value. Research by Tufano (1996) found empirical evidence that managers who have larger shareholdings tend to use derivatives as a hedging tool.
Hypothesis 2: Managerial Ownership has a positive and significant effect on the Usage of Derivative Instruments.
The level of liquidity measures the company's ability to meet its short-term needs by using the company's current assets. Low corporate liquidity indicates the company's inability to meet its short-term needs Horne & Warchowicz (2008). It can be observed that the low level of liquidity of a company indicates the company's financial performance is not good. When the company has a high level of liquidity, this shows that the company does not have financial problems, so the company's risk decreases. Research by Beaver et al., (1970) examined the effect of market factors and accounting factors on the company's systematic risk and found a negative significant correlation between the level of liquidity and the company's systematic risk. In addition, empirical research by Biase & Apolito (2012) concluded that the level of liquidity has a negative and significant effect on the risk of bank companies in Italy.
Hypothesis 3: Liquidity has a negative and significant effect on company risk
Managerial ownership in the company is believed to improve company performance because with managerial ownership the company's leaders (board of directors and board of commissioners) will be encouraged to carry out their duties properly and conduct supervision efficiently (Brickley et al., 1988). When the company has managerial ownership, the board of directors and commissioners are also part of the shareholders, so they have the same goal as other shareholders, namely increasing company value and reducing risk. Jensen & Murphy (1990); Chung & Pruitt (1994) concluded that board's ownership can improve company performance. In addition, research by Chen et al., (1998) found evidence that managerial ownership can reduce market risk. Furthermore, Capozza & Seguin (2003) stated that companies that have a higher proportion of insider ownership tend to invest in assets that are not risky and use a lower proportion of debt in their capital structure, so that the total risk of the company tends to decrease.
Hypothesis 4: Managerial ownership has a negative and significant effect on company risk
Modigliani & Miller (1963), developing the classical theory of funding decisions, revealed that corporate risk management is irrelevant because shareholders are able to create a well-diversified stock portfolio under the assumption of a perfect capital market. However, this does not happen because in the real world there is no perfect capital market. Smith & Stulz (1985) developed a theory of corporate hedging which states that imperfect capital markets create a condition that hedging is economically justified. Research by (Guay, 1999) found that companies that use derivatives for hedging, experience a significant reduction in corporate risk. There are several types of derivatives that the company could use for example interest rates, foreign exchange and commodities derivatives. Each types of these derivatives could be employed to manage each types of risk for example interest rate risk, foreign exchange risk and investment risk. This study tried to capture the total amount and all types 3
of derivatives used by the company. The use of derivatives by means of hedging is able to reduce company risk by reducing expectations of financial distress costs and reducing tax costs (Gatopoulos & Louberge, 2013). Therefore, it is clear that the use of derivatives is very beneficial for the company to reduce cost, maintain and maximize the firm value which is shown by the company stock price, and by then the company risk could decrease (Guay,1999). The company risk is measured by the total risk which is calculated by the annualized standard deviation of daily stock returns over years (Guay, 1999).
Hypothesis 5: The Usage of Derivative Instruments has a negative and significant effect on company risk
As previously explained, liquidity is suspected to have a negative influence on Company Risk. Company liquidity can be used as a measure to assess the company's financial performance. Good financial performance, as measured by the liquidity ratio indicates that the company has a good health condition, so that the risk of the company also tends to decrease (Chun & Ramasamy, 1999; Hardwick & Adams, 1999; Biase & D'Apolito, 2012).
Liquidity is also suspected to have a negative effect on the Usage of Derivative Instruments. In the course of its business, the company, of course, has experienced financial difficulties or problems. The company's liquidity can be a reference or an assessment of whether the company has financial problems. Poor financial performance, which is reflected in the level of liquidity ratios, indicates that the company is facing various financial problems such as short-term liquidity, financial distress, cash shortfalls (Froot et al., 1993; Bartram et al., 2009). This financial problem can be solved by using derivative instruments.
The Usage of Derivative Instruments is suspected to have a negative effect on the Company's Risk. The purpose of using derivative instruments is as a tool to manage company risk through hedging techniques (McDonald, 2006). Companies that are able to manage their risk by using derivative instruments through hedging have a tendency to decrease the risk faced by the company (Guay, 1999).
Based on the elaboration of several empirical studies, it can be concluded that the Usage of Derivative Instruments has a mediating role in this study. Liquidity variables affect the use of derivative products (Froot et al., 1993; Bartram et al., 2009). Liquidity variables affect firm risk (Hardwick & Adams, 1999; Biase & D'Apolito, 2012). Variable Usage of Derivative Instruments affects the company's risk (Guay, 1999). Some of these studies can build a new concept where the Usage of Derivative Instruments has a mediating role between liquidity and company risk.
Hypothesis 6: The Usage of Derivative Instruments is able to mediate the relationship between liquidity and company risk
Managerial ownership is one of the indicators in corporate governance that affects the success of a company. Poor corporate governance, one of which is reflected in the level of managerial ownership, can result in various problems such as financial pressure, possible bankruptcy and agency conflicts (Elloumi & Gueyie, 2001; Daily et al., 2003). This causes the Company's risk to tend to increase (Bukley et al., 2007; Salhi & Boujelbene, 2012). Previous research also explains that managerial ownership is related to the Usage of Derivative Instruments. As the number of managerial ownership in a company increases, the company has a better ability to make all decisions that are best for the company, one of which is the decision to use derivative products (Borokhovich et al., 2004). This is because the company's managerial acts as a shareholder so that it has the same goal as other shareholders, namely to maximize the value of the company. Therefore, managerial ownership is suspected to have a positive effect on the Usage of Derivative Instruments.
Empirical research has revealed that the Usage of Derivative Instruments can reduce corporate risk (Guay, 1999; Zhang, 2009). Derivative instruments have a function as a company risk management tool through hedging techniques (McDonald, 2006). Companies that hedge with derivative instruments aim to reduce risk (Hull, 2009). Based on the elaboration of several empirical studies, it can be concluded that the Usage of Derivative Instruments has a mediating role in this study. Managerial ownership variables affect the use of derivative products (Borokhovich et al., 2004; Osuoha, 2013). Managerial Ownership variable affects company risk (Bukley et. al., 2007; Salhi & Boujelbene, 2012). Variable Usage of Derivative Instruments affects the company's risk (Guay, 1999). Some of these studies can build a new concept where the Usage of Derivative Instruments has a mediating role between managerial ownership and company risk.
Hypothesis 7: The Usage of Derivative Instruments is able to mediate the relationship between managerial ownership and company risk
RESEARCH METHODS
The study uses a causality design to prove the relationship between the dependent and independent variables. This study was designed to determine the effect of liquidity and managerial ownership on the Usage of Derivative Instruments and company risk. The object of research is the company's risk in manufacturing industrial companies listed on the Indonesia Stock Exchange (IDX) in 2016-2018. The Usage of Derivative Instruments and company risk are the dependent variables in this study. Liquidity and managerial ownership are independent variables in this study. The research design in this study can be seen in Figure 1.
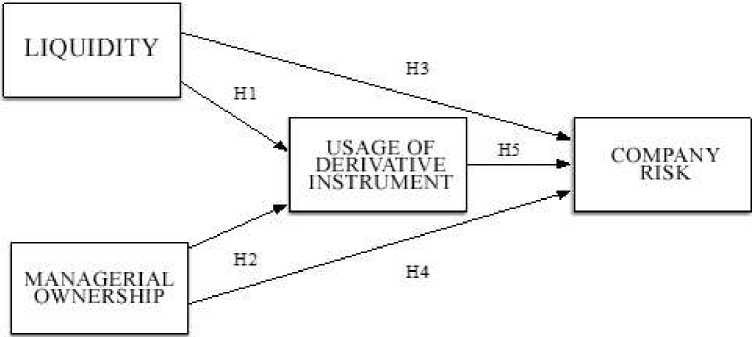
Figure 1. Research Design
This research was carried out in Indonesia, namely on manufacturing industrial companies listed on the Indonesia Stock Exchange (IDX) for the period 2016 to 2018. This location was chosen because the Indonesia Stock Exchange is the only stock exchange in Indonesia and all companies listed in Indonesia through Indonesia stock exchange.
All data in this study are quantitative data. Quantitative data is data in the form of numbers. Secondary data is data that has been collected by certain parties for other purposes (Saunders et al., 2016). This study uses secondary data, where all data such as liquidity, managerial ownership, Usage of Derivative Instruments and company risk can be obtained from the annual financial statements of each company published on the Indonesia Stock
Exchange website and for company risk data can be obtained by collecting stock price data. company through the yahoo finance website.
The population in this study are manufacturing companies on the Indonesia Stock Exchange listed from 2016 until 2018, in total there are 136 companies. The sampling technique in this study is the purposive sampling method. Purposive sampling method is a sampling technique based on criteria determined by the researcher. The sampling criteria used in this study are manufacturing companies that use derivative instruments that are always listed on the IDX for the period 2016 to 2018. There are 12 manufacturing companies that meet the sample criteria.
The following is the definition of all variables used in this study: Liquidity (CR) is a financial performance that shows the company's ability to meet its short-term needs. The company's liquidity in this study is measured using the current ratio, which is calculated by dividing current assets by current liabilities in manufacturing companies on the IDX in 2016 - 2018. The scale of this data is a ratio and the unit is percent.
Current asset
Current liabilities
Current Ratio =
x 100%.....................................................
(1)
Managerial Ownership (MO) is the proportion of the number of shares owned by the board of directors and commissioners in the company compared to the total number of shares of the company. This proportion is measured by dividing the number of shares owned by the board of directors and commissioners by the total number of shares in manufacturing companies on the IDX in 2016 - 2018. The scale of this data is ratio data and the unit is percentage.
Usage of Derivative Instruments (DERIV) is the value of derivative instruments used by companies or the amount of funds issued in the Usage of Derivative Instruments as risk management tools by manufacturing companies on the IDX in 2016 - 2018. The value of derivatives used by the companies cover all types of derivatives used. The total value of derivatives used by companies in this study was obtained from the annual reports of the sample companies, by adding up the fair value of the derivatives displayed in the financial statements, namely the company's balance sheet. This variable is measured by calculating the natural logarithm of the company's total value of derivatives.
Usage of Derivative Instruments = ln (total value of derivatives) .......................... (2)
The Corporate Risk (RISK) used in this study is the daily stock returns volatility in manufacturing companies on the IDX in 2016 - 2018. This measurement refers to previous research by Guay (1999); Bartram et al., (2008) which says that the measurement of risk in the aggregate can be measured using the volatility of stock returns.
fst~st~1χ100)∖
¥-1 261 I............................... (3)
where: St = stock price time t
St-1 = stock price time t-1
The first data analysis conducted in this study was descriptive statistics. Descriptive statistics is a data analysis method used to describe or describe the data that has been collected (Sugiyono, 2017). Descriptive statistics in this study will calculate the average, standard deviation, percentage of sample data for all variables with ratio data such as liquidity, profitability ratios, managerial ownership, Usage of Derivative Instruments, and company risk.
The second data analysis conducted in this study is inferential analysis. Inferential analysis is used to test the hypotheses formulated in this study. The inferential analysis technique used in this study is multiple linear regression analysis to test the hypothesis using
the SPSS program. Multiple linear regression analysis technique can be used to test how the influence of the independent variables on the dependent variable in the empirical research model. Multiple linear regression equation model is the most appropriate regression model to analyze the empirical model of this study, because in the empirical model there are 2 independent variables and 2 dependent variables. Furthermore, this study uses the method of path analysis (path analysis). Path analysis is used to determine whether the independent variable has a direct or indirect effect on the dependent variable. To determine the effect of each independent variable on the dependent variable used regression analysis. The multiple linear regression equation from the empirical model of this study can be written in the
following equation:
DERIV = b11CR + b12MO +ε1 ..........................................................................(4)
RISK = b21CR + b22MO + b23DERIV + ε2 ....................................................(5)
Equation 1 model is used to explain the effect of CR and MO, on the DERIV. Equation 2 model is used to explain the effect of CR, MO and DERIV on RISK.
Path analysis for mediation testing can be observed with the following explanations: 1). If X is significant to Y1 and the hypothesis is accepted, and Y1 is significant to Y2 and the hypothesis is accepted, and X is significant to Y1 and the hypothesis is accepted, then the Y1 variable is a half-mediation variable. 2). If X is significant to Y1 and the hypothesis is accepted, and Y1 is significant to Y2 and the hypothesis is accepted, while X is not significant to Y2, then Y1 is a full mediating variable. 3). If X is not significant to Y1, and Y1 is significant to Y2 and the hypothesis is accepted, then the Y1 variable is not a mediating variable (Solimun, 2010).
RESULT AND DISCUSSION
Descriptive statistical analysis was conducted to provide an overview or description of the research variables consisting of Liquidity (CR), Managerial Ownership (MO), Use of Derivatives (DERIV) and Company Risk (RISK) through the average value (mean), maximum value, value minimum and standard deviation. The complete descriptive statistics can be seen in Table 1.
Table 1. Descriptive Statistics of Research Variables
|
N |
Minimum |
Maksimum |
Average |
Standard Deviation | |
|
CR |
36 |
63,60 |
373,90 |
152,06 |
85,49 |
|
MO |
36 |
0,00 |
59,63 |
4,59 |
10,43 |
|
DERIV |
36 |
2,60 |
13,80 |
9,06 |
2,04 |
|
RISK |
36 |
1,00 |
4,30 |
2,58 |
0,87 |
Source: secondary data processed
The Company Risk Variable (RISK) has a minimum value of 1.00, namely the Indomobil Sukses International Tbk company in 2018, and the maximum value of 4.30 is the Unggul Indah Cahaya Tbk company in 2017. Variable Use of Derivatives (DERIV) has a minimum value of 2.60, namely the Krakatau Steel Tbk company in 2016, and a maximum value of 13.80, namely the Astra International Tbk company in 2016. The Liquidity Variable (CR) has a minimum value of 63.60%, namely the Multi Bintang Indonesia Tbk company in 2018, and a maximum value of 373.90%, namely the Selamat Sempurna Tbk company in 2017. Managerial Ownership (MO) variable has a minimum value of 0.00, namely in several manufacturing companies that did not implement the managerial share
ownership program during 2016-2018. The maximum value of 59.63% is at the company Krakatau Steel Tbk in 2016.
Testing the Strength and Suitability of the Equation Model 1. Equation 1 model in this study is: DERIV = a1 + b11CR + b12MO + 1. The equation consists of 1 dependent variable, namely Derivative Use (DERIV) which is proxied by the natural logarithm of the fair value of the company's use of derivatives and 2 dependent variables, namely Liquidity Ratio (CR) and Managerial Ownership (MO).
Table 2. Normality Test Results of Equation Model 1
|
Unstandardized Residual | |
|
N |
36 |
|
Mean |
.0000000 |
|
Normal Parametersa,b | |
|
Std. Deviation |
1.69643196 |
|
Absolute |
.081 |
|
Most Extreme Differences Positive |
.081 |
|
Negative |
-.060 |
|
Kolmogorov-Smirnov Z |
.081 |
|
Asymp. Sig. (2-tailed) |
.200 |
Source: processed data, 2021
The results of the normality test in Table 2 show the asymp value. Sig (2-tailed) of 0.200 (p>0.05). This indicates a normal distribution of the data, so that the data can be used for further regression analysis.
Classical Assumption Testing. Classical assumption testing is done by testing multicollinearity. heteroscedasticity and autocorrelation. This test is carried out to meet the assumptions specified in the linear regression analysis technique or Ordinary Least Square (OLS). The results of the classical assumption test: multicollinearity, heteroscedasticity and autocorrelation can be seen in Table 3.
Table 3. Testing Results of Classical Assumption Model Equation 1
|
Independent Variables |
Multicollinierities (VIF) |
Heteroscedasticity |
Autocorrelation (DW-test) |
|
Liquidity (CR) |
1.001 |
t= -0.468 ; sig= 0.643 |
1.590 |
|
Managerial ownership (MO) |
1.001 |
t= -0.979 ; sig= 0.335 |
1.590 |
Source: processed data, 2021
The results of the VIF test resulted in the VIF value for all independent variables less than 10, so that all independent variables were free from the problem of multicollinearity. The results of the multicollinearity test in Table 3 presents the VIF value for each independent variable less than 10 (VIF < 10), so it can be concluded that all independent variables included in the regression model are free from multicollinearity problems. The results of the heteroscedasticity test as presented in Table 3 show that all independent variables included in the regression model are not statistically significant (sig = > 0.05) have an effect on the residuals, so the regression model is free from heteroscedasticity problems. Testing for the presence or absence of autocorrelation symptoms in the regression model was carried out using the Durbin-Watson test. The values of dL, dU, 4-dU, and 4-dL samples are 36 with = 0.05 are 1.3537 (dL), 1.5872 (dU), 2.4128 (4-dU), and 2.6463 (4-dL). So, if the Durbin-Watson value lies between dU to 4-dU or 1.5872 to 2.4128 the regression model is free from autocorrelation symptoms. The results of the autocorrelation test with the Durbin-Watson Test as presented in
Table 4.3 show that the DW-test value is 1.590, which means that the regression model is free from autocorrelation symptoms.
Model Fit Testing. Testing the suitability of the model (goodness of fit) is done by looking at the value of the R-square and the significance of F. The R-square value explains the ability of the independent variables in influencing the dependent variable. Meanwhile, the significance of F describes the level of confidence that the model is appropriate.
Table 4. R-Square Calculation Results and Significance of F Equation 1
|
Model |
R |
R Square |
Adjusted R Square |
Std. Error of the Estimate | |
|
1 |
.558a |
.312 |
.270 |
1,74708 | |
|
Model |
Sum of Squares |
df |
Mean Square |
F |
Sig. |
|
Regression |
45.580 |
2 |
22,790 |
7,466 |
.002*** |
|
1 Residual |
100.726 |
33 |
3,052 | ||
|
Total |
146,306 |
35 | |||
Information:
*significant at 10% level
**significant at 5% level
***significant at 1% level
Source: processed data, 2021
The test results with the SPSS program show that the Rsquare value is 0.312 and the F value is 7.466 with sig. 0.002. Thus, the Liquidity Ratio (CR) and Managerial Ownership (MO) variables included in the regression model have the ability to explain the Use of Derivative Products (DERIV) of 31.2 percent, while the remaining 68.8 percent is explained by other factors that are not included in the regression model, for example profitability ratio, activity ratio, directors, independent commissioners and external factors. The regression model used in accordance with empirical evidence meets the model suitability at a significance level of less than 1 percent (sig. 0.002). The results of the calculation of R-square and the significance of F can be seen as presented in Table 4.
Testing the Strength and Suitability of the Equation 2 Model. Equation 1 model in this study is: RISK = a1 + b11CR + b12MO + b13DERIV + 2. The equation consists of 1 dependent variable, namely Corporate Risk (RISK), and 3 dependent variables, namely Liquidity Ratio (CR) and Managerial Ownership (MO) and Use of Derivatives (DERIV).
The results of the normality test in Table 5 show the asymp value. Sig (2-tailed) of 0.200 (p>0.05). This indicates a normal distribution of the data, so that the data can be used for further regression analysis.
Table 5. Normality Test Results of Equation 2 . Model
|
Unstandardized Residual | |
|
N |
36 |
|
Mean |
.0000000 |
|
Normal Parametersa,b | |
|
Std. Deviation |
.81457074 |
|
Absolute |
.096 |
|
Most Extreme Differences Positive |
.052 |
|
Negative |
-.096 |
|
Kolmogorov-Smirnov Z |
.096 |
|
Asymp. Sig. (2-tailed) |
.200 |
Source: processed data, 2021
Classical Assumption Testing. Classical assumption testing is done by testing multicollinearity. heteroscedasticity and autocorrelation. This test is carried out to meet the assumptions specified in the linear regression analysis technique or Ordinary Least Square (OLS). The results of the classical assumption test: multicollinearity, heteroscedasticity and autocorrelation can be seen in Table 6.
Table 6. Testing Results of Classical Assumption Model Equation 2
|
Independent Variable |
Multicollinierities (VIF) |
Heteroscedasticity |
Autocorrelation (DW-test) |
|
Liquidity (CR) |
1.007 |
t= 0.218 ; sig= 0.829 |
2.264 |
|
Managerial ownership (MO) |
1.452 |
t= -0.725 ; sig= 0.474 |
2.264 |
|
Usage of Derivative Instruments (DERIV) |
1.453 |
t= -1.092 ; sig= 0.335 |
2.264 |
Source: processed data, 2021
The results of the VIF test resulted in the VIF value for all independent variables less than 10, so that all independent variables were free from the problem of multicollinearity. The results of the multicollinearity test in Table 6 show that the VIF value for each independent variable is less than 10 (VIF < 10), so it can be concluded that all independent variables included in the regression model are free from multicollinearity problems. The results of the heteroscedasticity test as presented in Table 6 show that all independent variables included in the regression model are not statistically significant (sig = > 0.05) have an effect on the residuals, so the regression model is free from the heteroscedasticity problem. The results of the autocorrelation test with the Durbin-Watson Test as presented in Table 6 show that the DW-test value is 2.264, which means that the regression model is free from autocorrelation symptoms.
Model Fit Testing. Testing the suitability of the model (goodness of fit) is done by looking at the value of the R-square and the significance of F. The R-square value explains the ability of the independent variables in influencing the dependent variable. Meanwhile, the significance of F describes the level of confidence that the model is appropriate. The test results with the SPSS program show that the Rsquare value is 0.126 and the F value is 2.533 with sig. 0.025. So, the variables of Liquidity Ratio (CR), Managerial Ownership (MO) and Use of Derivative Products (DERIV) which are included in the regression model have the ability to explain Corporate Risk (RISK) of 12.6 percent, while the remaining 87.4 percent are explained by other factors not included in the regression model. The regression model used in accordance with empirical evidence meets the model suitability at a significance level of less than 5 percent (sig. 0.025). The results of the calculation of R-square and the significance of F can be seen as presented in Table 7
Table 7. R-Square Calculation Results and Significance of F Equation 2
|
Model |
R |
R Square |
Adjusted R Square |
Std. Error of the Estimate | |
|
1 |
.355a |
.126 |
.044 |
,85190 | |
|
Model |
Sum of Squares |
df |
Mean Square |
F |
Sig. |
|
Regression |
3,339 |
2 |
1,113 |
2,533 |
.025** |
|
1 Residual |
23,223 |
33 |
,726 | ||
|
Total |
26,562 |
35 | |||
Information:
*significant at 10% level
**significant at 5% level
***significant at 1% level
Sumber: data diolah, 2021
Equation Regression Testing 1. Regression equation 1 consists of the variables Liquidity Ratio (CR) and Managerial Ownership (MO) as independent variables and the Usage of Derivative Instruments (DERIV) as the dependent variable. The form of the equation is as follows:
DERIV = b11CR + b12MO + ε1...............................................................(6)
|
Table 8. Summary of Empirical Model Regression Test Results Equation 1 | ||||
|
Model |
Unstandardized Coefficients |
Standardized Coefficients |
t |
Sig. |
|
B Std. Error |
Beta | |||
|
(Constant) |
9,336 ,611 |
15.290 |
.000 | |
|
CR |
,001 ,003 |
,062 |
,430 |
.670 |
|
MO |
,109 ,028 |
,557 |
3,854 |
.001 |
|
Source: processed data, 2021 | ||||
Regression testing is done by using multiple regression and using the SPSS program. A summary of the results of the regression testing on the equation 1 model can be seen in Table 8. Based on Table 8, the regression equation can be written as follows: DERIV = 0.062CR + 0.557MO. The Liquidity Ratio (CR) coefficient value of 0.062 (positive) means that the liquidity ratio has a positive effect on the Usage of Derivative Instruments (DERIV). The coefficient of managerial ownership (MO) is 0.557 (positive), meaning that managerial ownership has a positive effect on the Usage of Derivative Instruments (DERIV). Managerial ownership has a statistically significant positive effect on the Usage of Derivative Instruments at the level of significant 1%.
The magnitude of the R-square 0.27 and the F-count 7.466 with a sig-F value = 0.002 indicates that the ability of the independent variables included in the model is able to explain 31.2 percent at the level of significant 1%, while 68.8 percent is explained by other variables outside the model. This means that the Usage of Derivative Instruments is influenced by the Liquidity Ratio (CR) and Managerial Ownership (MO) of 31.2 percent, while the remaining 68.8 percent is caused by other external factors, such as: company characteristics, economic conditions, culture and others.
Regression Testing Equation 2. Regression equation 2 consists of the variables Liquidity Ratio (CR), Managerial Ownership (MO) and Usage of Derivative Instruments (DERIV) as independent variables and Company Risk (RISK) as dependent variable. The form of the equation is as follows:
RISK = b11CR + b12MO + b13DERIV + ε2........................................................(7)
|
Table 9. Summary of Empirical Model Regression Test Results Equation 2 |
|
Unstandardized |
|
Standardized Coefficients |
|
Model Coefficients t Sig. |
|
B Std. Error Beta |
|
(Constant) 4,308 ,847 5,089 .000 |
|
CR ,000 ,002 -0,035 -,213 .833 |
MO -,015 ,017 -,177 -,886 .382
DERIV -,177 ,085 -,416 -2,088 ,045
Source: processed data, 2021
Regression testing was carried out with multiple regression and the SPSS 21 program was used. A summary of the results of regression testing on the equation 2 model can be seen in Table 9. Based on Table 9, the regression equation can be written as follows: RISK = -0.035CR - 0.117MO - 0.416DERIV . The Liquidity Ratio (CR) coefficient value of -0.035 (negative) means that the liquidity ratio has a negative effect on Company Risk (RISK). The coefficient of managerial ownership (MO) is -0.117 (negative), meaning that managerial ownership has a negative effect on Company Risk (RISK). The coefficient value of the Usage of Derivative Instruments (DERIV) is -0.416, meaning that the Usage of Derivative Instruments has a negative effect on Company Risk (RISK). The Usage of Derivative Instruments has a statistically significant negative effect on the use of company risk at the level of significant 5%.
The magnitude of the R-square 0.126 and the F-count 2.533 with a sig-F value = 0.025 indicates that the ability of the independent variables included in the model is able to explain 12.6 percent at the 1% level of significance, while 87.4 percent is explained by other variables outside the model. This means that the Usage of Derivative Instruments is influenced by the Liquidity Ratio (CR), Managerial Ownership (MO) and the Usage of Derivative Instruments (DERIV) by 12.6 percent, while the remaining 87.4 percent is caused by other external factors, such as: company characteristics, economic conditions, culture and others.
The result of the calculation of the regression analysis of equation 1 is as follows:
DERIV = 0,062CR + 0,557MO...................................................................(8)
Based on the results of the regression analysis, it can be concluded that Liquidity (CR) has a positive effect on the use of derivatives. Meanwhile, Managerial Ownership (MO) has a negative effect on the use of derivatives.
Equation 2 consists of three independent variables, namely CR, MO and DERIV and one dependent variable, namely Company Risk (RISK). The results of the calculation of the regression analysis of equation 2 are:
RISK = -0,035CR - 0,117MO - 0,416DERIV......................................................(9)
Based on the results of the regression analysis, it can be concluded that Liquidity (CR), Managerial Ownership (MO) and Use of Derivatives (DERIV) have a negative effect on Corporate Risk (RISK).
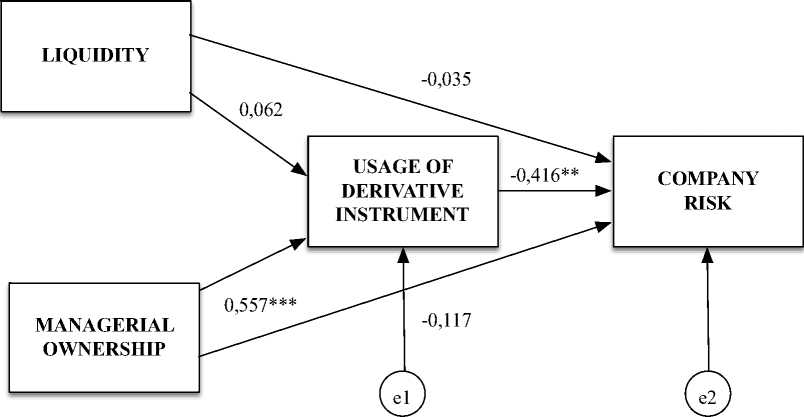
Figure 2. Empirical Model Path Analysis
** 5% significance level
*** 1% significance level
Source: results of data processing with SPSS 21
If the results of the regression analysis in equation 1 and equation 2 are included in the empirical research model, the results of the path analysis will be obtained which can be observed in Figure 2. Based on the results of the path analysis as shown in Figure 2, it can be analyzed whether the variable use of derivative products (DERIV) is a mediating variable or not. The results of the path analysis as shown in Figure 2 can be interpreted as in Table 10.
Table 10. Interpretation of Empirical Model Path Analysis
|
Variables |
Information |
Usage of Derivative Instruments (DERIV) |
Company Risk (RISK) |
|
Liquidity (CR) |
No significant effect on DERIV and RISK |
No effect |
No effect |
|
Managerial ownership (MO) |
Significant effect on DERIV |
Direct Effect |
No effect |
|
Usage of Derivative Instruments (DERIV) |
No significant effect on RISK |
- |
Direct Effect |
Source: Summary of data processing results
Table 10 is a summary of the calculation results of the path analysis of the empirical model that can be tested with the hypotheses that have been made. As for testing the existing hypothesis, it can be seen from the Liquidity variable that it does not have a significant effect on the Derivative Instruments variable. So, Hypothesis 1 which states that liquidity has a negative and significant effect on the Usage of Derivative Instruments is rejected (H1 is rejected). Managerial Ownership has a significant direct influence on Derivative Instruments. It can be concluded that Hypothesis 2 which states that Managerial Ownership has a positive and significant effect on the Usage of Derivative Instruments is accepted (H2 is accepted).
Liquidity variable does not have a significant effect on company risk. So, Hypothesis 3 which states that Liquidity has a negative and significant effect on Company Risk is rejected
(H3 is rejected). The relationship between Managerial Ownership and Company Risk was found to have no significant effect. It can be seen that Hypothesis 4 which states that Managerial Ownership has a negative and significant effect on Company Risk is rejected (H4 is rejected). There is a significant direct effect between the Usage of Derivative Instruments on corporate risk. Hypothesis 5 which states that the Usage of Derivative Instruments has a negative and significant effect on company risk is acceptable (H5 is accepted).
An insignificant relationship occurs in the liquidity variable to the derivative instrument variable and also the company risk variable. The results of the calculation analysis show that the indirect effect (liquidity on company risk through the Usage of Derivative Instruments) is smaller than the direct effect (liquidity on company risk). Then it can be seen that Hypothesis 6 which states that the Usage of Derivative Instruments is able to mediate the relationship between liquidity and company risk is rejected (H6 is rejected). The direct influence of the managerial ownership variable on the company's risk is not significant, but if it is through the Usage of Derivative Instruments, the result of the indirect effect is greater. So, Hypothesis 7 which states that the Usage of Derivative Instruments is able to mediate the relationship between managerial ownership and company risk is acceptable (H7 is accepted). Judging from this, there are three accepted hypotheses, namely the second hypothesis, the fifth hypothesis, and the seventh hypothesis. While there are four rejected hypotheses, namely the first hypothesis, the third hypothesis, the fourth hypothesis, and the sixth hypothesis. The results of this study can provide input to the company's management that managerial ownership plays an important role in the company's decision to use derivatives in an effort to reduce the company risk. This research also support the theory of corporate hedging by Smith & Stulz (1985) that hedging is economically justified by finding the important role of derivatives usage in reducing the company risk.
CONCLUSION
The results of the suitability test and the strength of the model in this study indicate that the regression model used is very good because it is proven to fit the data. Based on the results of the regression analysis and mediation test, it can be concluded that the managerial ownership variable has a significant positive effect on the Usage of Derivative Instruments. The variable Usage of Derivative Instruments has a significant negative effect on company risk. The Usage of Derivative Instruments can mediate the relationship between managerial ownership and company risk. The company must pay attention to the role of managerial ownership and usage of derivatives instrument in reducing company risk. The limitation of this research is in the period of the study which is limited for 3 years. The longer study period may provide a better insight. The future research may include the other factors into the analysis such as company characteristics, economic conditions and culture.
REFERECES
Bartram, S. M., Brown, G. W., & Conrad, J. S. (2009). The Effects of Derivatives on Firm Risk and Value. Ssrn, 46(4), 967–999. https://doi.org/10.2139/ssrn.1342771
Beaver, W., Kettler, P., & Scholes, M. (1970). The Association Between Market Determined and Accounting Determined Risk Measures. The Accounting Review, 45(4), 654–682. https://www.jstor.org/stable/244204
Biase, P. di, & D‘Apolito, E. (2012). The Determinants of Systematic Risk in the Italian Banking System: A Cross-Sectional Time Series Analysis. International Journal of Economics and Finance, 4(11), 152–164. https://doi.org/ 10.5539/ijef.v4n11p152
Borokhovich, K. A., Brunarski, K. R., & Simkins, B. J. (2004). Board Composition and Corporate Use Of Interest Rate Derivatives. The Journal of Financial Research, 27(2), 199–216. https://doi.org/10.1111/j.1475-6803.2004.t01-1-00079.x
Brickley, J. A., Lease, R. C., & Smith, C. W. (1988). Ownership structure and voting on antitakeover amendments. Journal of Financial Economics, 20(C), 267–291.
https://doi.org/10.1016/0304-405X(88)90047-5
Buckley, P., Clegg, L. J., Cross, A. R., Liu, X., Voss, H., & Zheng, P. (2007). The
Determinants of Chinese Outward Foreign Direct Investment. Journal of International Business Studies, 38(4), 499-518.
https://link.springer.com/article/10.1057/palgrave.jibs.8400277
Capozza, D. R., & Seguin, P. J. (2003). Inside Ownership, Risk Sharing and Tobin’s q-Ratios: Evidence from REITs. Real Estate Economics, 31(3), 367–404.
https://doi.org/10.1111/1540-6229.00070
Carter, D.A., Sinkey Jr, J. F. (1998). The Use of Interest Rate Derivatives by End-users: The Case of Large Community Banks. Journal of Financial Services Research, 14, 17–34 https://doi.org/10.1023/A:1008057418368
Chen, C. R., Steiner, T. L., & Whyte, A. M. (1998). Risk-taking behavior and management ownership in depository institutions. Journal of Financial Research, 21(1), 1–16. https://doi.org/10.1111/j.1475-6803.1998.tb00266.x
Chun, L.S., & Ramasamy, M. (1999). Accounting variabel as Determinants of Systematic Risk in Malaysian Common Stocks, Asian Pasific Journal of Management, 6(2), 339350. https://link.springer.com/article/10.1007%2FBF01733773
Chung, K. H., & Pruitt, S. W. (1994). Simple of Tobin ’ s Approximation q. Venture Capital, 23(3), 70–74. https://doi.org/10.2307/3665623
Daily, C. M., Dalton, D. A. N. R. & Cannella, A.A. (2003). Introduction To Special Topic Forum Corporate Governance: Decades of Dialogue and Data. Academy Oí Management Review, 28(3), 371–382. https://doi.org/10.5465/amr.2003.10196703
Elloumi, F., & Gueyie, J. (2001). Financial Distress and Corporate Governance: an empirical analysis. Corporate Governance, 1(1), 15-23.
https://doi.org/10.1108/14720700110389548
Froot, K. A., Scharfstein, D.S. & Stein, J.C. (1993). Risk Management : Coordinating Corporate Investment and Financing Policies. The Journal of Finance, 48(5), 16291658. https://doi.org/10.1111/j.1540-6261.1993.tb05123.x
Gatopoulos, G., & Loubergé, H. (2013). Combined use of foreign debt and currency derivatives under the threat of currency crises: The case of Latin American firms. Journal of International Money and Finance, 35, 54–75.
https://doi.org/10.1016/j.jimonfin.2013.01 .004
Ghozali, I. (2011). Aplikasi Analisis Multivariate dengan Program SPSS. Semarang: Universitas Diponegoro.
Guay, W. R. (1999). The impact of derivatives on firm risk: An empirical examination of new derivative users. Journal of Accounting and Economics, 26(1–3), 319–351. https://doi.org/10.1016/S0165-4101(98)00032-9
Gujarati, D.N. (2011). Econometrics By Example. New York: Palgrave Macmillan.
Hair Jr, J.F., Hult, G.T. M., Ringle, C. M., & Sarstedt, M. (2014). A Primer on Partial Least Squares Structural Equation Modeling (PLS-SEM). Thousand Oaks: SAGE Publication, Inc.
Hanafi, M. (2014). Manajemen Risiko.Yogyakarta: UPP STIM YKPN.
Hardwick, P., & Adams, M. (1999). The determinants of financial derivatives use in the United Kingdom life insurance industry. Abacus, 35(2), 163–184.
https://doi.org/10.1111/1467-6281.00039
Horne, J. C. V., & Warchowicz, J. M. (2008). Fundamentals of Financial Management.
England: Pearson Education Limited.
Hull, J. (2009). Options, Futures, and other Derivatives. USA: Pearson Education, Inc.
Jensen, M. C., & Murphy, K. J. (1990). Performance Pay and Top-Management Incentives.
Journal of Political Economy, 98(2), 225-264. https://www.jstor.org/stable/2937665
Lantara, I. W. (2010). A Survey on the Use of Derivatives in Indonesia. Gajah Mada International Journal of Business, 12(3), 295–323.
https://doi.org/10.22146/gamaijb.5504
McDonald, R. . (2006). Derivatives Markets. USA: Pearson Education, Inc.
Modigliani, F., & Miller, M. H. (1963). Income Taxes and the Cost of Capital. The American Economic Review, 53(3), 433–443. https://www.jstor.org/stable/1809167
Osuoha J. (2013). Financial Engineering, Corporate Governance and Nigeria Economic Development. Journal of Financial Risk Management, 2(4), 61-66. https://doi.org/ 10.4236/jfrm.2013.24010
Salhi, B., & Boujelbene, Y. (2012). Students and Entrepreneurship: Effect of the Training. Journal of Research in Educational Sciences, (3)5, 19-34.
https://www.ceeol.com/search/article-detail?id=33741.
Saunders, A., & Cornett, M. (2014). Financial Institution Management/ : A Risk Management Approach. New York: Mc Graw Hill.
Saunders, M., Lewis, P., & Thornhil, A. (2016). Research Methods for Business Students. Italy: Pearson Education
Smith, C. W., & Stulz, R. M. (1985). The Determinants of Firms’ Hedging Policies. Journal of Financial and Quantitative Analysis, 20(4), 391-405.
https://doi.org/10.2307/2330757
Solimun. (2010). Analisis Variabel Moderasi Dan Mediasi. Malang: Program Studi Statistika FMIPA-UB.
Sugiyono. (2017). Metode Penelitian Kuantitatif, Kualitatif dan R&D. Bandung: Alfabeta.
Tufano, P. (1996), Who Manages Risk? An Empirical Examination of Risk Management Practices in the Gold Mining Industry. The Journal of Finance, 51, 1097-1137. https://doi.org/10.1111/j.1540-6261.1996.tb04064.x
Zhang, H. (2009). Effect of Derivative Accounting Rules on Corporate Risk-Management Behavior. Journal of Accounting and Economics, Vol. 47, 244-264.
17
Discussion and feedback