Implementation of Operational Risk Management to Mitigate Employee Fraud in Banking Companies: Case Study at PT AAA
on
146 Matrik: Jurnal Manajemen, Strategi Bisnis dan Kewirausahaan Vol. 15, No. 1, Februari 2021

MATRIK: JURNAL MANAJEMEN, STRATEGI BISNIS DAN KEWIRAUSAHAAN
Homepage: https://ojs.unud.ac.id/index.php/jmbk/index
Vol. 15 No. 1, Februari (2021), 146-159
Implementation of Operational Risk Management to Mitigate
Employee Fraud in Banking Companies: Case Study at PT AAA
Dewi Hanggraeni1), Muhammad Chandika Andintyas2)
1,2) FEB Universitas Indonesia
email: dewi_hanggraeni@yahoo.com

SINTA 2
DOI : https://doi.org/10.24843/MATRIK:JMBK.2021.v15.i01.p13
ABSTRACT
This study aims to describe the potential losses due to employee internal Fraud using a case study at PT AAA in 2020 and its mitigation. The data used is the monthly loss data experienced by PT AAA for the period 2012 to 2019. The research methods used are quantitative and qualitative approaches. The quantitative method is applied by analyzing the calculation of the primary data, while the qualitative method is carried out by conducting interviews with several sources. To measure potential losses, this study uses the Monte Carlo formula and to process of calculating potential losses is assisted by Easyfit software. The results of this study indicate that the potential loss arising from operational risk due to Fraud by internal employees with a 95% confidence level is IDR 44,880,958,735,- or 9% of Net Income. This study also formulates a risk register so that it can be used as a reference for mitigating related risks to reduce potential losses and increase shareholder value.
Keyword: operational risk, internal fraud, banking
Penerapan Manajemen Risiko Operasional Untuk Memitigasi Fraud Karyawan Pada Perbankan: Studi Kasus Pada PT AAA
ABSTRAK
Penelitian ini bertujuan untuk menggambarkan potensi kerugian akibat tindakan Fraud internal karyawan dengan menggunakan studi kasus pada PT AAA di tahun 2020 beserta mitigasinya. Data yang digunakan adalah data kerugian bulanan yang dialami PT AAA periode 2012 sampai dengan 2019. Metode penelitian yang digunakan adalah metode kuantitatif dan kualitatif. Metode kuantitif dilakukan dengan melakukan analisis perhitungan terhadap data primer, sedangkan metode kualitatif dilakukan dengan melakukan wawancara terhadap beberapa narasumber. Untuk mengukur potensi kerugian, penelitian ini menggunakan rumus Monte Carlo dan proses perhitungan potensi kerugian dibantu dengan software Easyfit . Hasil penelitian ini menunjukan bahwa potensi kerugian yang berasal dari risiko operasional akibat tindakan fraud oleh internal karyawan dengan confidence level sebesar 95% adalah Rp 44.880.958.735,-, atau 9% dari laba bersih. Penelitian ini juga merumuskan risk register agar dapat menjadi acuan mitigasi risiko terkait sehingga mengurangi potensi kerugian dan meningkatkan nilai perusahaan.
Kata kunci: operational risk, internal fraud, perbankan
PRELIMINARY
The banking industry is one of the main types of business industries in the movement of the country's economy. Bank (Law of the Republic of Indonesia Number 10 of 1998 concerning Amendments to Law Number 7 of 1992 concerning Banking) is one type of industry in Indonesia that functions as a collector of funds from the public in the form of
deposits and also as a channel back to the public in the form of credit and or other forms in order to improve the community's economy. Banks will benefit from the interest distributed to the public. According to the Law of the Republic of Indonesia Number 10 of 1998, there are two types of banks, namely Commercial Banks and Rural Banks.
Banking always faces all kinds of risks. One of the risks faced by banks is operational risk. Operational Risk (POJK No1/POJK.05/2015) is a variety of risks that arise due to failures and errors in the company's internal processes, resources and other supporting sources. All aspects other than credit, liquidity and market aspects are classified as operational risk.
PT AAA is one of the banks in Indonesia that focuses on offering credit products in the regions. The company has several business units to help run business processes. In mitigating risks from business processes, PT AAA has carried out several mitigations and also backups. Reserves made by Bank AAA to date are only for credit and liquidity risk. In fact, the operational risks faced by PT AAA are no less large, especially in terms of frequency or likelihood. The main problem that often arises is employee fraud which is very detrimental. This fraudulent act will directly affect the company's profits. According to The Association of Certified Fraud Examiners (ACFE) in the 2014 Nations on Occupational Fraud & Abuse report, fraudulent acts that occur in companies reduce 5% of the revenue earned annually.
The Financial Services Authority issued the Financial Services Authority Regulation Number 39/POJK.03/2019 concerning the Implementation of Anti-Fraud Strategy for Commercial Banks where this regulation explains the obligation for banks to implement an anti-fraud strategy and reporting obligations for banks that are more comprehensive in order to provide added value. . PT AAA is one of the banks in Indonesia. PT AAA runs banking products for profit. In carrying out its business processes, PT AAA faces several challenges such as the development of information systems and fraud. The fraud that occurred at PT AAA was related to the actions of employees who violated the predetermined Standard Operating Procedure (SOP). This action is detrimental to PT AAA, both financially and other losses. This loss is included in PT AAA's loss report. The loss report is still being refined and PT AAA currently does not have a risk register that focuses on mitigating risks due to fraud.
Fraud is a result of human reason to strategize to get something more by means of false representations (S Albert; O Albert; C Albert; Zimbelman, 2012). The Association of Certified Fraud Examiners (ACFE) categorizes fraud at work into 3 (three) categories, namely misappropriation of assets (involving the theft or misuse of company assets), corruption (fraud perpetrators wrongly using their influence in business transactions to gain profit for themselves). themselves or others, contrary to their duties to their superiors or the rights of others) and reports of fraud involving falsification of the organization's financial statements.
The causes of fraud at PT AAA are caused by many things. Based on the results of interviews with PT AAA employees who are responsible for handling employee fraud, the two main causes of fraud are the opportunity and the incentive to fulfill lifestyle needs. This is in line with Cressey (1953) regarding the causes of fraud, namely the existence of opportunity and pressure. Another cause of fraud is rationalization.
RESEARCH METHODS
The design used in this study was non-experimental. Non-experimental research is a systematic empirical study in which the researcher cannot directly control the independent variables because their manifestations have emerged, or because the nature of the variables does not allow them to be manipulated (Kerlinger, 2006).
The research method used is quantitative and qualitative methods (mixed method). In this case, the case study is used. Case studies are conducted to find specific problems based on
events that occur in banking. In this study, the case study focuses on losses due to fraud based on company loss data. The loss data used covers the period from 2012 to 2019. This data is used to calculate possible losses due to fraud in 2020 (quantitative method). This study also uses data from interviews (qualitative method) as supporting data. Interviews were conducted on the management of PT AAA who is responsible for handling risk management and human resources. Research is focused on analytical research. Analytical research was conducted on data permitted by PT AAA to be used in risk analysis.
The population of this research is all employees of PT AAA who commit fraud. According to Sugiyono (2011), population is a generalization area consisting of objects or subjects that have certain qualities and characteristics that are determined by researchers to be studied and then drawn conclusions. This study uses all incidents of employee fraud recorded in the PT AAA report.
This study uses the Loss Event Database based on data on actual losses experienced by banks due to fraud. In calculating potential operational losses, one method that can be used is the Monte Carlo method (Costa, 2004).
This study uses several stages in determining the potential operational losses of PT AAA. The main approach used is the Loss Distribution Approach (LDA). This approach aims to analyze the losses experienced by the company, especially losses in the company's operational processes due to fraud. The data used is monthly loss data for the period 2012 to 2019. In measuring operational risk, more than two years of data are needed so that the application of the model in measuring losses due to operational actions can be analyzed (Cruz, 2002).
The next step is to calculate the Frequency Distribution. Frequency Distribution is related to the number of loss events that occur in a certain period of time. There are three types of distribution that can be used. The distributions are Binomial Distribution, Negative Binomial Distribution and Poisson Distribution (Costa, 2004). This study uses the Poisson Distribution with the formula
f(x) = λxe^(^ ....................................................................................(1)
where :
x = Number of events occurring
λ = The average event occurs
The third stage is to perform calculations to determine the severity distribution. Severity distribution aims to calculate the spread of the severity data (in this case the loss) so that it can determine the shape of the distribution of the data. Usually, this distribution is used to describe the spread of the data used. This distribution relates to descriptive statistics. Descriptive statistics fully describe the data used. Descriptive statistics are described in terms of mean, standard error, median, variance, mode, kurtosis, range and standard deviation. These results are used to determine a suitable distribution form that can be used in this study.
The fourth stage is calculating the Goodness of Fit Test. This stage aims to measure the distribution test to find the most suitable distribution of the existing data. There are three existing distribution tests. The test instruments are Chi-square, Kolmogorov-Smirnov and Anderson-Darling (Costa, 2004). Each test instrument is distinguished based on the form of distribution.
This study uses the Kolmogorov-Smirnov approach which has the formula
T = max| Sn(x) - f(x)∖ ..........................................................................(2)
This test is done by comparing the results used to determine whether or not the hypothesis is accepted for this test. The hypothesis of this research is:
H0 = Severity distribution of operational loss data due to fraud following the distribution tested H1 = Severity distribution of operational loss data due to fraud does not follow the distribution tested
To determine whether H0 is accepted or not, the measurement uses the Easy fit application where the calculation results will describe whether Ho is accepted or not.
This study uses the Monte Carlo loss distribution formula to calculate the Loss Distribution Approach (LDA). This formula uses data from the frequency and severity processing that has previously been done (Martin, 2009). One of the uniqueness of this formula is that it uses random numbers in determining the probability of an event occurring. This study uses 44 data which describes the loss per month due to fraud.
The last stage is to calculate Back Testing. Back Testing is performed to test the validity of the model that has been used. This test is commonly known as the Kupic test which compares the actual losses that occur with the estimated value of the calculation result of Operational Value of Risk. This calculation is done by determining the estimated value of losses over time and also the actual value of losses in the same period by comparing the two values. This comparison is commonly referred to as a binary indicator. Binary indicator is done by giving a value of 0 if the estimated loss value is greater than the actual value and 1 if the estimated loss value is smaller than the actual value. All monthly values will be added up. This sum is referred to as the failure rate. The failure rate value will be tested using the Kupic test approach (loglikelihood (LR)) with the formula
LR = -2 ln[(1 - α)7--l,X α∏ + 2ln [(1 - ^-^ X (^)v]..............................................................(3)
Where:
LR = Log Likelihood
Ratio = probability of error
V = number of estimated errors
T = number of observed data
RESULTS AND DISCUSSION
PT AAA is one of the conventional commercial banks in Indonesia, included in the book bank category 2. This company is a regional bank that focuses on regional economic development. This bank offers several products that are acceptable to the general public. PT AAA is a local government-owned bank that has a very strong market segment in its home area. The majority of the bank's income comes from the margin between the interest rates on funding and the lending offered. The products offered range from various types of credit for debtors and funding customers in the form of savings products, demand deposits, time deposits and other products. PT AAA recorded a profit of IDR 250,000,000,000 in 2019, an increase of 10% compared to the previous year. Supposedly, the profits obtained can be more optimal if PT AAA is able to mitigate operational risks, especially due to internal fraud. Losses due to fraud will reduce 1% of PT AAA's profits. This loss has the potential to continue to increase in
the next period if PT AAA does not mitigate its risks due to fraud in a systematic and consistent manner.
Losses due to fraud can be seen from the total loss per year and also the average per month. Most of the losses were caused by fraud committed by internal employees. Figure 1 describes the losses borne by PT AAA per year due to fraud.
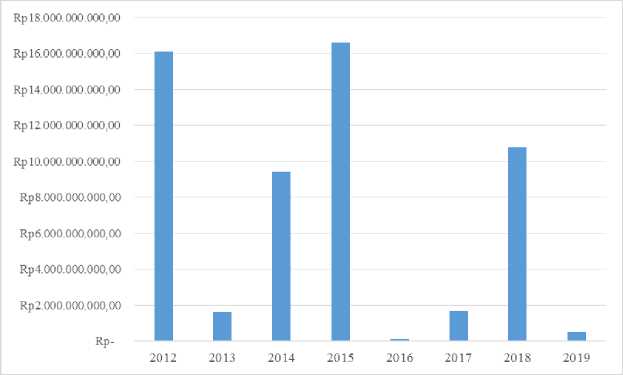
Figure 1 Data on Total Losses Due to Fraud per Year Source: PT AAA loss data (2020)
Figure 1 describes the total losses experienced by PT AAA per year due to fraud committed by internal employees. The loss in 2015 was PT AAA's biggest loss with a nominal value of more than IDR 16,000,000,000. Based on Figure 1, the smallest losses occurred in 2013, 2016 and 2019. Based on the results of interviews, the low level of losses due to fraud in that year was due to the change in manual reports to using the system. In 2013, PT AAA changed the method of reporting company assets held by employees into monthly reports, previously employees had to report once a year. This is done to control assets so that they are not misused by employees. This change was initially able to suppress employee fraud. Furthermore, many loopholes are used by employees to commit fraud because the report form is still manual. To overcome this, PT AAA began to develop a system that can prevent fraud. In 2016, the implementation of the system began to be used. Business processes that are prone to fraud are being controlled through the system. Another obstacle arises as a result of not developing this system periodically so that many business processes are still carried out manually. This caused fraud to increase again in 2017 to 2018. In 2019, PT AAA updated the system by changing all manual processes to using the system so that all transactions and company business processes can be easily monitored. This system change reduces the possibility of fraud by internal employees.
The number of fraud events in the period January 2012 to December 2019 amounted to 44 fraud events. Table 1 below describes the data on the number of incidents of fraud intervals per month. This data comes from the report of PT AAA and also the results of interviews with the management of PT AAA
Table 1: Number of fraud incidents per month
|
Month |
2012 |
2013 |
2014 |
2015 |
2016 |
2017 |
2018 |
2019 |
|
January |
0 |
0 |
0 |
1 |
1 |
0 |
1 |
0 |
|
February |
0 |
1 |
1 |
1 |
0 |
0 |
1 |
0 |
|
March |
0 |
0 |
1 |
2 |
1 |
2 |
0 |
0 |
|
April |
0 |
0 |
1 |
2 |
0 |
1 |
2 |
0 |
|
May |
0 |
1 |
1 |
0 |
0 |
0 |
0 |
0 |
|
June |
1 |
1 |
0 |
0 |
0 |
0 |
0 |
1 |
|
July |
1 |
0 |
2 |
0 |
0 |
0 |
2 |
0 |
|
August |
0 |
0 |
2 |
0 |
0 |
0 |
0 |
0 |
|
September |
1 |
1 |
1 |
0 |
0 |
2 |
1 |
1 |
|
October |
0 |
0 |
1 |
0 |
0 |
0 |
0 |
0 |
|
November |
1 |
2 |
0 |
0 |
0 |
0 |
0 |
0 |
|
December |
0 |
1 |
0 |
1 |
0 |
0 |
0 |
0 |
Source: PT AAA loss data (2020)
The fraud event is recorded as a loss event when a guilty verdict has been determined. The event will be counted in the month when the related event occurs, not at the time of decision.
This study aims to calculate the estimated loss due to fraud in banking companies. Fraud is one example of operational risk. At the Frequency Distribution stage, there are three distributions that can be used. For the calculation of fraud which is part of operational risk, the Poisson distribution can be used as a frequency distribution of operational losses (Costa, 2004).
Poisson, which is usually described by the lamda, is the average annual occurrence. The calculation of lamda in this study uses the help of Excel software. The result of the lamda calculation for internal fraud is 5.5.
Tabel 2: Statistic Descriptive
|
Keterangan |
Jumlah | |
|
Mean |
Rp |
1.295.504.631 |
|
Standard Error |
Rp |
517.002.143 |
|
Median |
Rp |
150.000.000 |
|
Mode |
Rp |
150.000.000 |
|
Standard Deviation |
Rp |
3.429.404.251 |
|
Sample Variance |
1,17608E+19 | |
|
Kurtosis |
11,07939596 | |
|
Skewness |
3,435725463 | |
|
Range |
Rp |
14.899.900.000 |
|
Minimum |
Rp |
100.000 |
|
Maximum |
Rp |
14.900.000.000 |
|
Sum |
Rp |
57.002.203.746 |
|
Count |
44 | |
|
Largest(1) |
Rp |
14.900.000.000 |
|
Smallest(1) |
Rp |
100.000 |
|
Confidence Level (95.0%) |
Rp |
1.042.634.190 |
Source: research processing (2020)
The Severity distribution uses monthly loss data in the form of nominal rupiah which describes the loss. This distribution is used to determine the right parameters in modeling operational risk losses. This distribution relates to descriptive statistics. Descriptive statistics fully describe the data used. Descriptive statistics are described in terms of mean, standard error, median, variance, mode, kurtosis, range and standard deviation. These results are used to determine a suitable distribution form that can be used in this study. In Table 2, descriptive statistical data from this test will be presented.
Table 2 describes the descriptive statistics of PT AAA's loss data due to internal fraud. The table illustrates that the mean value is greater than the median and mode. These results indicate that the data has a positive asymmetry distribution. This distribution describes a curve where the curve is skewed to the right. The skewness result in table 2 produces a number greater than 0 so that the distribution is skewed to the right. The value of kurtosis in descriptive statistics produces a number more than 4 so that the distribution is in the form of a taper (leptokurtic). These results indicate that this distribution tends to be in the form of LogNormal, Pareto or Gamma.
The Goodness of Fit Test stage is used to measure the distribution test to find the most suitable distribution of the existing data. There are three existing distribution tests, namely Chisquare, Kolmogorov-Smirnov and Anderson-Darling (Costa, 2004). Each test instrument is distinguished based on the form of distribution. This stage is carried out before performing the OpVar at Risk calculation using the loss distribution approach method. This stage aims to minimize errors in identifying the distribution of losses due to operational processes which will result in errors in calculating capital requirements and reserves for operational risk. The test at this stage was carried out with the help of Easyfit software to process 44 data.
Calculations using the Easy Fit application provide information that the correct distribution in this study is the Log Normal distribution. The critical value generated in this calculation is 0.10981. Critical Value Log Normal is smaller than Critical Value based on statistical tests with the Kolmogorov Smirnov distribution. Based on these calculations, H0 is accepted so that the Severitas distribution of the operational loss data due to fraud follows the distribution being tested.
This study applies the Monte Carlo loss distribution formula. This formula uses data from the frequency and severity processing that has previously been done (Martin, 2009). One of the uniqueness of this formula is that it uses random numbers to determine the probability of an event occurring. This study uses 44 data that describe monthly losses due to fraud. This calculation uses the help of the Excel application. The simulations carried out in this study were 15 times and the maximum event was 15 so as to produce conditions that followed severity. The results of this calculation will determine the picture of losses that will be experienced by PT AAA due to fraud.
Table 3: Losses
|
Confidence Level |
Pencadangan | |
|
99,9% |
Rp |
771.377.979.615 |
|
99,0% |
Rp |
154.822.495.008 |
|
95,0% |
Rp |
44.880.958.735 |
|
90,0% |
Rp |
24.639.233.072 |
Source: research processing (2020)
The next step is to calculate the potential loss using the Monte Carlo method. Based on table 3, with a 95% confidence level, the loss received by the company due to employee fraud
caused a loss of Rp. 44,880,958,735, or about 9% of the company's net profit. This test also produces a maximum possible number of incidents (severity) of 15 times the incidence of fraud in the next period where the mean used is 18.705 and the standard deviation is 2.4398. This value is the value derived from the Normal Log test.
This study uses 5,000 simulations where the probability is a random number. Severity is calculated using the excel formula “=loginv (prob ; mean ; std.deviation)” which is done 5,000 times. This experiment was carried out 15 times, but if the number of frequencies is less than the number of occurrences, it does not need to be calculated. From the calculation results, with a confidence level of 99.99%, the required reserve is Rp. 771,377,979,615, or about 1.5% of Gross Income.
Table 4 Calculation of Back Testing
|
Years |
Month |
Variable Operational |
Losses Due to Fraud |
Difference |
Binary Indica tor | |||
|
January |
Rp |
26.337.148.493 |
Rp |
4.000.000 |
Rp |
26.333.148.493 |
0 | |
|
February |
Rp |
26.337.148.493 |
Rp |
89.368.821 |
Rp |
26.247.779.672 |
0 | |
|
March |
Rp |
26.337.148.493 |
Rp |
- |
Rp |
26.337.148.493 |
0 | |
|
April |
Rp |
26.337.148.493 |
Rp |
5.395.000 |
Rp |
26.331.753.493 |
0 | |
|
May |
Rp |
26.337.148.493 |
Rp |
- |
Rp |
26.337.148.493 |
0 | |
|
2018 |
June |
Rp |
26.337.148.493 |
Rp |
- |
Rp |
26.337.148.493 |
0 |
|
July |
Rp |
26.337.148.493 |
Rp |
253.013.929 |
Rp |
26.084.134.564 |
0 | |
|
August |
Rp |
26.337.148.493 |
Rp |
- |
Rp |
26.337.148.493 |
0 | |
|
September |
Rp |
26.337.148.493 |
Rp |
10.468.345.679 |
Rp |
15.868.802.814 |
0 | |
|
October |
Rp |
26.337.148.493 |
Rp |
- |
Rp |
26.337.148.493 |
0 | |
|
November |
Rp |
26.337.148.493 |
Rp |
- |
Rp |
26.337.148.493 |
0 | |
|
December |
Rp |
26.337.148.493 |
Rp |
- |
Rp |
26.337.148.493 |
0 | |
|
January |
Rp |
52.601.515.407 |
Rp |
- |
Rp |
52.601.515.407 |
0 | |
|
February |
Rp |
52.601.515.407 |
Rp |
- |
Rp |
52.601.515.407 |
0 | |
|
March |
Rp |
52.601.515.407 |
Rp |
- |
Rp |
52.601.515.407 |
0 | |
|
April |
Rp |
52.601.515.407 |
Rp |
- |
Rp |
52.601.515.407 |
0 | |
|
May |
Rp |
52.601.515.407 |
Rp |
- |
Rp |
52.601.515.407 |
0 | |
|
2019 |
June |
Rp |
52.601.515.407 |
Rp |
407.815.703 |
Rp |
52.193.699.704 |
0 |
|
July |
Rp |
52.601.515.407 |
Rp |
- |
Rp |
52.601.515.407 |
0 | |
|
August |
Rp |
52.601.515.407 |
Rp |
- |
Rp |
52.601.515.407 |
0 | |
|
September |
Rp |
52.601.515.407 |
Rp |
116.500.000 |
Rp |
52.485.015.407 |
0 | |
|
October |
Rp |
52.601.515.407 |
Rp |
- |
Rp |
52.601.515.407 |
0 | |
|
November |
Rp |
52.601.515.407 |
Rp |
- |
Rp |
52.601.515.407 |
0 | |
|
December |
Rp |
52.601.515.407 |
Rp |
- |
Rp |
52.601.515.407 |
0 | |
Source: researcher processing based on PT AAA loss data (2020)
Back Testing is done to test the validity of the model that has been used. This test is commonly known as the Kupic test, which compares the actual losses with the estimated results of the Operational Value of Risk calculation. This calculation is done by determining the estimated value of losses over time and also the actual value of losses in the same period by comparing the two values. This comparison is commonly referred to as a binary indicator. Binary indicator is done by giving a value of 0 if the estimated loss value is greater than the actual value and assigning a value of 1 if the estimated loss value is smaller than the actual
value. These results will be summed which results in the failure rate. The failure rate value will be tested using the Kupic test approach (loglikelihood (LR)). This test uses a critical value of 95%, which is 3.84. The results of the LR calculation are in table 4.
From the data in table 4, it can be seen that there is no negative difference between the OpVar calculation using previous data and the actual occurrence of fraud. The magnitude of the Loglikehood Ratio is 0 which is lower than the 95% Critical Value of 3.84 so that the model used is valid.
Losses due to fraudulent actions reduce the profits received by PT AAA. This may continue to be experienced by PT AAA if no mitigation is carried out. PT AAA needs to develop an existing report by compiling mitigation measures for each fraud incident. Based on the results of interviews with PT AAA management, there were several incidents of fraud at PT AAA such as embezzlement of company assets, misuse of company assets, leaking company secrets, misuse of passwords and other fraud incidents. To mitigate these incidents, it is necessary to add to the risk register including more detailed mitigations for each fraud incident. Table 5 below is a table of risk registers for fraud incidents developed based on the results of interviews.
Tabel 5 Risk Register
|
INCIDENT REASON CONSEQUENCE FREQ. SEV. MITIGATION | |
|
COMPANY ASSET EMBOLATION |
If it is required to be taken out of the office, it must be reported and recorded in the IT Division.
easy to lose inventory report Lack of supervision over company Very
assets given to employees often difficult to employees track • • If an employee damages a given asset, the employee is required to replace it according to the damaged asset (needs to be investigated by the IT Division) |
|
ABUSE OF CORPORATE ASSETS |
• • Assets are
company assets given to to loss and company's facilities employees damage • • If an employee damages a given asset, they must replace it
employees can support Vulnerable the IT Division) employees' daily activities assets for • • Employees make installments to pay off company facilities outside of work. personal so that in the future they can be privately owned claim |
|
EMPLOYEES LEAVE COMPANY SECRETS |
Seldom Very
to data confidentiality company data to
• • Company data is easy to competitors hardware access • • Data can
• • Employee mentality be sold to e-mail (external e-mail may not be used) |
|
INCIDENT REASON CONSEQUENCE FREQ. SEV. MITIGATION | |
|
PASSWORD ABUSE |
regularly updated often Information
is easily individual employees • • Emphasize to employees that passwords are private • Passwords
items that are easily update passwords secrets can accessible to the public be shared
selection |
|
FAKE REPORT |
data
data for personal gain • • Mistakes • • Double checking in making financial statements
reporting the company's strategy |
|
MONEY EMPLOYMENT |
Seldom Very • • Financial loss for the eavy
transaction records • • • Employees may not receive funds directly from customers
name |
INCIDENT REASON CONSEQUENCE FREQ. SEV. MITIGATION
|
FRAUD AGAINST CUSTOMERS |
loss for the heavy company • • Tightening the recruitment process for certain categories of
employees
not been implemented the
clearly company's
name • • There are lawsuits |
|
FRAUD AGAINST ORGANIZATIONS BY COOPERATION WITH CUSTOMERS |
loss for the heavy
• • The company's SOP has • • employees not been implemented Worsening
clearly the
criminal groups name • • There are lawsuits |
|
CUSTOMER DATA THEFT |
• • Financial Seldom Heavy loss for the
company data • • employees
data e • • Strengthened audit process company's
name • • There are lawsuits |
|
TRAVEL FRAUD |
company data
Losses • • Punishment for employees who commit this action the employee concerned
|
CONCLUSION
Fraud by PT AAA employees resulted in significant losses for the company. The causes of internal fraud include lack of strict supervision, password problems, employee integrity, SOPs are not reviewed periodically and a weak reward and punishment system. This fraud should be mitigated by PT AAA, thereby reducing potential losses, thereby increasing profits. This study uses 5000 trials where the existing probability is a random number. With a confidence level of 99.99%, the required reserve is IDR 771,377,979,615,-. With a 95% confidence level, the total potential loss due to employee fraud that occurred in 2020 is IDR 44,880,958,735,-, or about 9% of net profit.
To reduce potential losses due to employee fraud in the future, PT AAA needs to develop the current report. The current report needs to be added with a more detailed and comprehensive risk register, especially related to fraud so that PT AAA is able to mitigate the risks that may occur. The Risk Register must be developed continuously because there are potential new risks that will come, along with the increasingly complex problems and intense competition. In addition, reserves due to employee fraud need to be carried out and monitored periodically.
REFERENSI
Abdymomunov,Azamat., Mihov, Atanas (2017). Operational Risk and Risk Management Quality:Evidence from U.S. Bank Holding Companies”
Albrecht, W. S., Albrecht, C.O., Albrecht , C.C. and Zimbelman, Mark F. Fraud “Examination 4th Edition. Cengage Learning”. Ohio USA: Mason, 2011.
Christensen, Larry B. 2007. Experimental Methodology 10th Edition. New York :Pearson Education, Inc
Cruz, M. G. (2002). Modelling, Measuring and Hedging Operational Risk. John Wiley & Sons, Ltd., West Sussex.
Cumming., Douglas., Leung, Y T., Eue, Oliver. (2015).” Gender Diversity and Security Fraud”. 58. 1572-1593
Daxecter., Ursula., Salvatore, jessica Di., Ruggeri, Andrea. (2019). “Fraud Is What People Make of It: Election Fraud, Perceived Fraud, and Protesting in Nigeria”. 63. 20982127
Dyck, Alexander., Morse, Adair., Zingales, Luigi., (2010)“Who Blows the Whistle on Corporate Fraud?”.65. 2213 - 2253
Flouris, Triant., & Yilmaz, Kucuk. (2010),” The Risk Management Framework to Strategic
Human Resource Management”. 93. 28
Girling, Phillipa. “Operational Risk Management : A Complete Guide to a Successful Operational Risk Framework”. New Jersey : John Wiley & Sons, Inc.,"
Kaspereit, Thomas., Lopatta, Kerstin., Pakhchanyan, Suren & Prokop, Jorg. (2017).” Spillover effects of large operational losses in”. 18. 252 - 267
Kerlinger, Fred N. 2006. Asas-asas Penelitian Behavioral Edisi Ketiga. Yogyakarta : Gajah Mada University Press.
Lowers & Associates. 2013. “5 Critical Areas of Human Capital Risk [Infographic]”. Diakses melalui https://blog.lowersrisk.com/human-capital-risk/ tanggal 09 Juni 2016 pukul 21.13
Murphy, Pamela R., Dacin, Tina. (2011). “Psychological Pathways to Fraud: Understanding and Preventing Fraud in Organizations. Journal of Business Ethics. 101.601–618
Meyer, Marius., Roodt, Gert. & Robbins, Michael. (2011).: Human resources risk management: Governing people risks for improved performance”. 9. e1 - e12
Martin, Juse Luis. (2009).”Comparative Analysis of Operational Risk Approaches within Basel Regulatory Framework : Case Study of Spanish Saving Bank”. Journal of Financial Management and Analysis, 22, 1-15
Otoritas Jasa Keuangan Republik Indonesia. 2016. Peraturan Otoritas Jasa Keuangan Nomor 18/POJK.03/2016 tentang Penerapan Manajemen Risiko Bagi Bank Umum. Diakses melalui https://www.ojk.go.id/id/kanal/perbankan/regulasi/peraturan-
ojk/Documents/Pages/POJK-Nomor-18.POJK.03.2016/SAL%20-%20POJK%20Manajemen%20Risiko%20.pdf
https://www.acfe.com/cost-of-Fraud.aspx (diakses pada 24 November 2019)
Richard, Griffith. (2019). “Fraud in the NHS.”. 19. 1343–1356
Ruth, Saskia M Van., Huisman, Wim., Luning, Pieternel A. (2017).” Food Fraud vulnerability and its key factors”. 67. 70-75
Sugiyono. (2011). “Metode Penelitian Kuantitatif, Kualitatif dan R&D”. Bandung: Afabeta
Yan Huang, Shaoi., Lin, Chi Chen., Chiu, An-an., & Yen, David. (2016). “Fraud detection using Fraud triangle risk factors”.19. 1343 - 1356
Yu., Frank and Yu., Xiayun. (2011). “Corporate Lobbying and Fraud Detection”. The Journal of Financial and Quantitative Analysis. 46. 1865-1891
Discussion and feedback