Opportunities for the application of Red-edge reflectance-based indices in coastal vegetation and agro-ecological studies
on
Journal of Marine and Aquatic Sciences 5(2), 251-259 (2019)
Opportunities for the application of Red-edge reflectancebased indices in coastal vegetation and agro-ecological studies
Laily Mukaromah a*, Abd. Rahman As-syakur b, Erwin Prastowo c
a Research Center for Plant Conservation and Botanic Gardens - Indonesian Institute of Sciences (LIPI), Indonesia b Marine Science Department, Faculty of Marine and Fisheries, Udayana University, Bukit Jimbaran, Bali 80361, Indonesia c Indonesian Coffee and Cocoa Research Institute (ICCRI), Jalan PB. Sudirman 90, Jember 68118, Indonesia
* Corresponding author. Tel.: +62-343-615033
E-mail: laily.mukarromah@gmail.com
Received: 11 October 2019; Accepted: 29 November 2019; Available online: 30 November 2019
Abstract
Remote sensing is an advanced tool that provides electromagnetic information about the Earth's surface and atmosphere. In ecological studies, the applications of vegetation indices (VIs) derived from remote sensing data have continued to increase, especially in capturing and monitoring vegetation properties and environmental changes. This study reviews the application of VIs with special focus on red-edge based indices in the evaluating coastal landscapes and other conservation studies. The spectral characteristics of vegetation is briefly reviewed in order to exploit the potential information of the reflectance spectrum, and the possible key role of vegetation indices in future research of coastal vegetation as well as resilience indicator in the ever-changing landscapes.
Keywords: red edge-based indices; coastal vegetation; dynamic environments; repetitive coverage; conservation research
Abstrak
Penginderaan jauh adalah salah satu teknologi yang mampu menyajikan informasi tangkapan gelombang elektromagnetik tentang permukaan dan atmosfer Bumi. Pada studi-studi yang terkait dengan ekologi, pengaplikasian indeks-indeks vegetasi yang diperoleh dari data penginderaan jauh terus mengalami peningkatan, terutama terkait dengan kemampuannya menangkap dan memonitor sifat-sifat tutupan vegetasi serta perubahan lingkungan. Studi ini mencoba mereview secara singkat berbagai pemanfaatan indeks-indeks vegetasi, khususnya indeks vegetasi yang berbasis atau menggunakan panjang panjang gelombang red-edge terkait dengan kemampuannya mengevaluasi lanskap pantai dan studi konservasi lainnya. Karakteristik pantulan spektral vegetasi ditinjau secara mendalam untuk mengetahui kemampuannya dalam memberikan informasi sifat-sifat vegetasi, serta kemungkinan peran dari indeks-indeks vegetasi tersebut untuk penelitian-penelitian selanjutnya, khusus terkait dengan vegetasi pantai serta indikator ketahanan lanskap yang selalu berubah.
Kata Kunci: indeks berbasis red-edge; vegetasi pesisir; lingkungan yang dinamis; cakupan berulang; penelitian konservasi
Remote sensing is one of the most cost-effective approaches that provide valuable insights for investigating and interpolating earth surface features and detecting change (Medina et al., 2019; Pettorelli et al., 2013). Remotely-sensed data using both airborne and satellite platforms have raised a novel prospect as proxies of ecosystems properties, including conservation and monitoring
of biodiversity, forestry, agriculture, coastal and marine ecosystems, and other related fields (Hossain et al., 2019; Goetz & Dubayah 2011; Zolkos et al., 2013). In recent decades, hyperspectral sensors have offered both relatively higher spectral and spatial resolution than previously available, allowing the extraction of more detailed information on spectral variability of the landscape features (Salas & Henebry, 2014; Weng et al., 2008; Thenkabail et al., 2000).
Advances in remote sensing sensors combined with machine learning algorithms have proved to be the most robust approaches for detecting, mapping, and monitoring complex nature patterns and dynamic of vegetation as well as their biophysical and structural properties (Klemas, 2012; Husnayaen et al., 2018; Verrelst et al., 2019).
Numerous approaches have been developed for the purpose of extracting remote sensing information relevant to particular indicator of earth components across large spatial extents (Li et al., 2018; Pettorelli et al. 2005). Vegetation Indices (VIs) derived from remote sensing data are among advanced approaches and techniques developed by scientists and practitioners for quantitative and qualitative evaluation of vegetation, such as vegetation cover, vigor, growth stages, forest health and dynamics (Kross et al., 2015; Pettorelli et al., 2005; Zhang et al., 2018). Vegetation indices (VIs) are spectral transformations of two or more bands designed to enhance spectral features sensitive to a vegetation characteristic and enable data interpretation of vegetation surface, allowing reliable spatial and temporal inter-comparisons of vegetation and other earth components, including phenological, biophysical, and structural parameters of vegetation (Li et al., 2018; Xu et al., 2019).
In this study, we present an overview on the application of vegetation indices (VIs) in recent ecological and conservation studies. Particular emphasis was given to the potential use of red-edge spectral reflectance-based indices for investigating and mapping coastal vegetation.
Coastal ecosystems provide imperative functions that support a diverse array of life forms and numerous goods and services to human well-being and the environment. These services include biodiversity, regulation (nutrient regulation, climate regulation, carbon sequestration, detoxification of polluted waters), provision (energy resources, natural products, supply of food), support (buffering from natural hazards, marine life nursery functions, shoreline stabilisation), tourism and cultural services (recreation, culture and amenity) (Barbier et al., 2011; Nehren et al., 2016; Unsworth et al., 2018).
Despite such benefits and services, coastal zones are currently identified as one of the most threatened ecosystems. Degradation of coastal ecosystems cause biodiversity loss, landscape modifications, and habitat degradation; and thereby threatens the capacity of coastal ecosystems to provide good and services that contribute to human wellbeing (Husnayaen et al., 2018; Ferrol-Schulte, et al. 2015; Gilman et al., 2008).
Coastal ecosystems are increasingly being threatened by human pressure, such as tourism, urban development, pollution, and farming practices (Ciccarelli, 2014). Environmental changes will cause serious long-term consequences along with the potential impacts of climate change relevant to coastal ecosystems, including variations in temperature and associated rise in sea level, changes in precipitation, ocean circulation, wave conditions, storm surge, and ocean acidification due to higher levels of CO2 (Lotze at al., 2006). In this case, anthropogenic climate change can alter the atmospheric composition, resulting in variations and change the intricate dynamics of the coastal landscapes (Frosini et al., 2012). Moreover, natural forcing drivers, such as coastal hazards (e.g., coastal erosion, flooding), can drive the probability and severity of which is expected to increase with climate change (Delgado-Fernandez et al., 2019). Under the influence of complex mechanisms and high pressures of both natural and anthropogenic stressors, protecting coastal ecosystems therefore requires an understanding of the nature of coastal systems and the dynamic way these systems evolve to prevailing changing environments.
Satellite and airborne remote sensors have great abilities to detect, measure, and map coastal ecosystems and their changes at appropriate scales and resolutions; minimizing the need for extensive field-based measurements (Carranza et al., 2008; Lyons et al., 2012). However, spectral responses of vegetation provide one of the greatest challenges for remote sensing interpretation in several ecosystems since the spectral response of vegetated areas presents a complex mixture of vegetation, soil brightness, environmental effects, shadow, soil color and moisture (Ollinger, 2011), especially in coastal systems. Coastal ecosystems exhibit vegetation mosaic and complex relationships between the physical and biological
processes that form dynamic geomorphic structures at with extreme variations in spatial complexity and temporal variability (Pinna et al., 2019). Due to their unique position between marine and terrestrial environment, coastal zones constitute complex transitional systems subjected to variety of natural process and environmental drivers such as topography, soil salinity, substrate instability, marine aerosol, wind and aeolian processes (De Luca et al., 2011). The recent development of remote sensing sensors and data analysis techniques offer an opportunity to detect and monitor biophysical features of landscape components, particularly coastal vegetation.
The spectral signatures, patterns and heterogeneity recorded by remote-sensing techniques have been widely exploited for investigating and interpolating vegetation properties. The main electromagnetic spectrum that are relevant to the applications of vegetation remote sensing are the following: (i) the visible spectra, which are composed of the blue (450–495 nm), green (495-570 nm), and red (620–750 nm) wavelength regions; and (ii) the near and mid infrared band (850–1700 nm) (Figure 1). Numerous studies have exploited spectrum of possibilities associated with vegetation indices (VIs), and in particular the Normalized Difference Vegetation Index (NDVI). NDVI, which is computed as ratio-based vegetation indices using visible (red) and Near Infrared, is highly associated with photosynthetically active radiation. The reflectance within the visible wavelength, especially red and blue, is associated to absorption of two major chlorophyll pigments (i.e. chlorophyll a and b), whereas reflectance at the NIR band is highly related with the leaf structure (e.g. plant geometrical and internal biophysical structure) rather than pigment composition (Miller et al., 1990; Kumar et al., 2002).
Normalized Difference Vegetation Index (NDVI) is the most well-known and widely used vegetation index, particularly in research related to regional and global vegetation assessments. This greenness index can be applied as robust indicator of photosynthetic capacity, leaf area index (LAI), net primary production, carbon assimilation and evapotranspiration, among other applications
(e.g. Kawabata et al., 2001; Schloss et al., 1999). However, NDVI commonly saturate at moderate-to-dense canopies. NDVI does have some limitations, especially when plant species or vegetation are reaching mature stage with complete canopy closure or having high biomass and leaf area index (LAI) (Gitelson et al., 2003). This index is reported to be sensitive to the effects of soil brightness, soil color, atmosphere, cloud and cloud shadow, and leaf canopy shadow (Buma & Lee, 2019; Xue and Su, 2017).
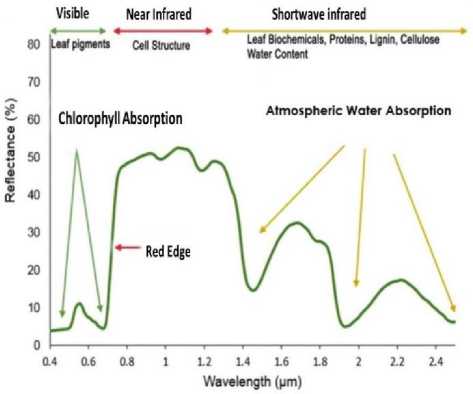
Figure 1. Spectral reflectance curve of vegetation showing energy wavelength, absorption features and vegetation components controlling vegetation reflectance characteristics (Roman & Ursu, 2016).
Red edge is also regarded as one of the most obvious characteristics of green vegetation, since it is strongly correlated with chlorophyll content (Baranoski & Rokne, 2005). Red edge approximately refers to 680 -740 nm in the electromagnetic spectrum, reflecting the spectrum of transition platform from the strong absorption of red light to the near-infrared multiple scattering of vegetation chlorophyll (Horler et al., 1983). Red edge parameters include red edge position, red edge slope, red edge area, red edge average refectivity, red edge amplitude, ratio of red edge amplitude and minimum amplitude. A high correlation was found between both amplitude of the red edge peak (drr e) and the area of the red edge peak (σ680–780 nm) with LAI (leaf area index), while the wavelength of the red edge peak (λre) was the best estimator of chlorophyll content (Filella & Penuelas, 1994). Red-edge position is reported to be less sensitive to the changes of
canopy structure, plant coverage, and leaf properties (Cho et al., 2008; Pu et al., 2003).
Table 1
Red-edge spectral reflectance-based indices, references, and equations.
|
Index |
Acronym |
Equation |
Reference |
|
Red-edge |
NDVIred |
(NIR - Red Edge)/ |
Gitelson and |
|
normalized difference vegetation index |
edge |
(NIR + Red Edge) |
Merzlyak, 1994 |
|
Red-edge simple ratio vegetation index |
RERVI |
RERVI= ρ780/ρ730 |
Cao et al., 2015 |
|
Normalized difference red-edge |
NDRE |
NDRE= (ρ780-ρ730)/ (ρ780+ρ730) |
Peng and Gitelson, 2012 |
|
Red-edge renormalized difference vegetation index |
RERDVI |
RERDVI= (ρ780-ρ730)/ √ρ780+ρ730) |
Cao et al., 2015 |
|
Red-edge difference vegetation index |
REDVI |
REDVI= ρ780-ρ730 |
Cao et al., 2015 |
|
Red-edge soil adjusted vegetation index |
RESAVI |
RESAVI= 1.5*[(ρ780-ρ730)/ √(ρ780+ρ730+0.5)] |
Huete, 1988 |
|
Red-edge optimal soil adjusted vegetation index |
REOSAVI |
REOSAVI= (1+0.16)(ρ780-ρ730) / (ρ780+ρ730+0.16) |
Cao et al., 2013 |
|
Red-edge wide dynamic range vegetation index |
REWDRVI REWDRVI= (0.15*ρ780-ρ730)/ (0.15*ρ780+ρ730) |
Gitelson, 2004 | |
|
Red-edge chlorophyll index |
CIre |
CIRE= ρ780/ρ730-1 |
Gitelson et al., 2005 |
The use of red-edge based indices has been reported in research especially related to chlorophyll concentration and nutritional status. Table 1 shows several vegetation indices that have been developed on the red-edge region. The derivative-based red-edge indices were reported to be more sensitive to changes on both leaf chlorophyll content and the LAI at dense plant canopy or biomass (Pu et al., 2003; Cho et al.,
2008). This higher sensitivity can be attributed to derivative analysis which can magnify signal properties at an absorption region and also changes of scattering properties at longer wavelengths (Boochs et al., 1990). The advantage red-edge reflectance is highlighted due to its position being between the bands where strong absorption of light by plant pigments and high leaf reflection occur. However, indices that incorporate the reflectance of red-edge bands were mostly derived from narrow and field spectroradiometers, medium resolution spectrometers, and airborne spectrographic imagers (e.g. Viña et al., 011; Nguy-Robertson et al., 2012; Haboudane et al., 2004).
-
4. Current contributions of Red Edge based indices to coastal vegetation mapping and conservation studies
Several studies have evaluated the sensitivity of VIs derived from the red-edge band for mangrove forests. Zhu et al. (2017) developed an estimation model of LAI of mangrove forests based on WorldView-2 (WV2) imagery. They demonstrated that for all machine-learning algorithms used in their study (i.e. artificial neural network regression, support vector regression, and random forest regression), the spectral transformations of the red-edge band on WV2 imagery were consistently had the highest prediction accuracy compared with other traditional bands of WV2, such as near-infrared-1 and near-infrared-2 band. Similarly, Castillo et al. (2017) demonstrated that based on biophysical variable Leaf Area Index (LAI) derived from Sentinel-2, red edgebased Inverted Red-Edge Chlorophyll Index was more accurate in predicting the overall aboveground biomass of mangroves in Philippines. Other study highlighted the potential use of Red Edge NDVI for mangrove species mapping in Malaysia, using Maximum Likelihood Classifier based on the RapidEye satellite imagery (Roslani et al., 2014).
Mukaromah (2017) highlighted the applicability of vegetation index computed using algorithm based on the red-edge band in combination with ancillary and field data to classify and map comprehensive cover of various vegetation on Rottnest Island. The Red Edge Normalized Vegetation Index (Red Edge NDVI), also known as NDVI705, is a narrowband greenness modified from NDVI, and is measured by the ratio of
within-leaf scattering and the effect of leaves' chlorophyll content. The Red Edge NDVI is applied by using bands along the red edge instead of the main absorption and reflectance peaks. Compared to other vegetation indices, Red Edge NDVI provide an increased sensitivity in detecting plant physiological status at low coverage plant biomass. Testing on HyMap imagery, this study also demonstrated that several sites of vegetation have Normalized Vegetation Index (NDVI) values below zero. The range of NDVI values for vegetation should be between 0 and 1, with the higher value attributed to healthy-dense vegetation and the lower value related to sparse vegetation. The low value (NDVI values below zero) on the HyMap image in this study reflects the low biomass and vegetation cover of the most sparse and disturbed heath communities (the negative value of NDVI should be represented water and built-up area). NDVI may reflect a sensitive response to green vegetation even for low vegetation covered areas; however, this index does not successfully differentiate the densely vegetated from the sparsely vegetated area (Adams and Gillespie, 2006). The findings of this study indicated that red edge band in the HyMap imagery has potential for subsequent mapping methods, while enable the enhanced characterization of vegetation biophysical properties and land surface condition. These findings are vital for vegetation monitoring, especially those of sparse and dry heathlands. The Red Edge NDVI hyperspectral index is reported to be highly sensitive to changes in canopy foliage, gap fraction, and senescence phenological stages, and has the advantage of not being affected by leaf surface reflectance (Gupta et al., 2003; Jung et al., 2006). Other studies reported that most VIs that are computed on the red-edge region attempt to minimalizing the effects of backgrounds caused by variations in soil reflectance (Dorigo et al., 2007; Glenn et al., 2008). Jung et al. (2006) also indicated that Red Edge NDVI is very useful as a sensitive environmental indicator for detecting vegetation stress, for instance caused by drought and disease. While HyMap may cost exorbitant for extensive planning and synoptically monitoring of large regions, this airborne hyperspectral sensor enables to evaluate fine scale landscape assessment.
There are several existing studies that use Red Edge parameter to improve the precision agriculture and yield prediction (Cui & Kerekes,
2018; Chlingaryan et al., 2018; Cho and Skidmore, 2006). Based on the red-edge inflection point (REIP) computed from derivative analysis, Kanke et al. (2016) evaluated grain yield prediction of two rice varieties with different canopy structure and other agronomic parameters (biomass, N uptake and plant coverage). Red-edge inflection point (REIP) defined as the maximum of the first derivative reflectance between the red and NIR regions. They calculated REIP based on the maximum first derivative analysis by polynomial fitting technique (REIPDF), linear interpolation technique (REIPLI), linear extrapolation technique (REIPLE), and the Lagrangian technique. They demonstrated that REIP had a strong correlation with agronomic parameters (i.e. biomass, N uptake, and grain yield), and this relationship is stronger than those of red-based indices. Van der Meer and De Jong (2006) also reported similar findings that REIP is significantly related with N concentration particularly at dense plant canopy ground coverage. Similarly, other studies also reported that reflectance at the REIP can be used as a good indicator of biomass, N content, and chlorophyll content (Lukas et al., 2016; Raper & Varco 2015).
Red edge-based indices have significantly enhanced the sensitivity of chlorophyll concentration and allowing biophysical measurements, including biomass estimation, nitrogen content and leaf area index (LAI). Strong correlation of red edge with chlorophyll content also provide more sensitivity to detect dry and sparse vegetation, making this index a useful indicator of environmental stress. Vegetation index computed using algorithm based on the red-edge band could also potentially be used to strengthen NDVI as red edge is strongly correlated with both leaf chlorophyll content and leaf area index (LAI), especially at dense plant canopy or biomass. With the development of remote sensing sensors, specific red edge indices can be developed to improve the capability of robustness against chlorophyll change, providing high-quality reference information and broadening research areas to address rapid environmental changes and continuous vegetation estimates in the near future, especially in coastal landscapes that constitute
complex vegetation mosaics subjected to constantly changing environments.
References
Adams, J. B. and A. R. Gillespie. 2006. Remote sensing of landscapes with spectral images: a physical modelling approach. Cambridge, UK: Cambridge University Press.
Baranoski, G. V. G., & Rokne, J. G. (2005). A practical approach for estimating the red edge position of plant leaf reflectance. International Journal of Remote Sensing, 26(3), 503-521.
Barbier, E. B., Hacker, S. D., Kennedy, C., Koch, E. W., Stier, A. C., & Silliman, B. R. (2011). The value of estuarine and coastal ecosystem services. Ecological monographs, 81(2), 169-193.
Boochs, F., Kupfer, G., Dockter, K., & Kuhbauch, W. (1990). Shape of the red-edge as vitality indicator for plants. International Journal of Remote Sensing, 11, 1741–1753.
Buma, W. G., & Lee, S. I. (2019). Multispectral ImageBased Estimation of Drought Patterns and Intensity around Lake Chad, Africa. Remote Sensing, 11(21), 2534.
Cao, Q., Miao, Y., Shen, J., Yu, W., Yuan, F., Cheng, et al. (2015). Improving in-season estimation of rice yield potential and responsiveness to topdressing nitrogen application with Crop Circle active crop canopy sensor. Precision Agriculture, 17(2), 136-154.
Cao, Q., Miao, Y., Wang, H., Huang, S., Cheng, S., Khosla, R., et al. (2013). Non-destructive estimation of rice plant nitrogen status with Crop Circle
multispectral active canopy sensor. Field Crops
Research, 154, 133–144.
Carranza, M. L., Acosta, A. T., Stanisci, A., Pirone, G., & Ciaschetti, G. (2008). Ecosystem classification for EU habitat distribution assessment in sandy coastal environments: An application in central
Italy. Environmental monitoring and assessment, 140(1-3), 99-107.
Castillo, J. A. A., Apan, A. A., Maraseni, T. N., & Salmo III, S. G. (2017). Estimation and mapping of aboveground biomass of mangrove forests and their replacement land uses in the Philippines using Sentinel imagery. ISPRS Journal of Photogrammetry and Remote Sensing, 134, 70-85.
Chlingaryan, A., Sukkarieh, S., & Whelan, B. (2018). Machine learning approaches for crop yield prediction and nitrogen status estimation in precision agriculture: A review. Computers and electronics in agriculture, 151, 61-69.
Cho, M. A., A. K. Skidmore, and C. Atzberger. 2008. Towards red-edge positions less sensitive to canopy biophysical parameters for leaf chlorophyll
estimation using properties optique spectrales des feuilles (PROSPECT) and scattering by arbitrarily inclined leaves (SAILH) simulated data. International Journal of Remote Sensing 29:8: 2241-2255.
Cho, M.A. and A. Skidmore. 2006. A new technique for extracting the red edge position from hyperspectral data: The linear extrapolation method. Remote Sensing of Environment 101 (2):181-193.
Ciccarelli, D. (2014). Mediterranean coastal sand dune vegetation: influence of natural and anthropogenic factors. Environmental management, 54(2), 194-204.
Cui, Z., & Kerekes, J. (2018). Potential of red edge spectral bands in future landsat satellites on
agroecosystem canopy green leaf area index retrieval. Remote Sensing, 10(9), 1458.
Darvishzadeh, R., Atzberger, C., Skidmore, A. K., & Abkar, A. A. (2009). Leaf Area Index derivation from hyperspectral vegetation indicesand the red edge position. International Journal of Remote Sensing, 30(23), 6199-6218.
De Luca, E., Novelli, C., Barbato, F., Menegoni, P., Iannetta, M., & Nascetti, G. (2011). Coastal dune systems and disturbance factors: monitoring and analysis in central Italy. Environmental monitoring and assessment, 183(1-4), 437-450.
Delgado-Fernandez, I., O'Keeffe, N., & Davidson-Arnott, R. G. (2019). Natural and human controls on dune vegetation cover and disturbance. Science of The Total Environment, 672, 643-656.
Dorigo, W. A., Zurita-Milla, R., de Wit, A. J., Brazile, J., Singh, R., & Schaepman, M. E. (2007). A review on reflective remote sensing and data assimilation techniques for enhanced agroecosystem
modeling. International journal of applied earth observation and geoinformation, 9(2), 165-193.
Ferrol-Schulte, D., Gorris, P., Baitoningsih, W., Adhuri, D. S., & Ferse, S. C. (2015). Coastal livelihood
vulnerability to marine resource degradation: A review of the Indonesian national coastal and marine policy framework. Marine Policy, 52, 163-171.
Filella, I., & Penuelas, J. (1994). The red edge position and shape as indicators of plant chlorophyll content, biomass and hydric status. International Journal of Remote Sensing, 15(7), 1459-1470.
Frosini, S., Lardicci, C., & Balestri, E. (2012). Global change and response of coastal dune plants to the combined effects of increased sand accretion (burial) and nutrient availability. PLoS One, 7(10), e47561.
Gilman, E. L., Ellison, J., Duke, N. C., & Field, C. (2008). Threats to mangroves from climate change and adaptation options: a review. Aquatic botany, 89(2), 237-250.
Gitelson, A. A. (2004). Wide dynamic range vegetation index for remote quantification of biophysical
characteristics of vegetation. Journal of Plant Physiology, 161, 165–173.
Gitelson, A. A., Vina, A., Ciganda, V., Rundquist, C. D., & Arkebauer, J. T. (2005). Remote estimation of canopy chlorophyll content in crops. Geophysical Research Letters, 32 (8).
Gitelson AA, Merzlyak MN. 1994. Quantitative estimation of chlorophyll-a using reflectance spectra: experiments with autumn chestnut and maple leaves. Journal of Photochemical Phytobiology 22: 247–252.
Gitelson, A. A., Gritz, Y., & Merzlyak, M. N. (2003). Relationships between leaf chlorophyll content and spectral reflectance and algorithms for non
destructive chlorophyll assessment in higher plant leaves. Journal of plant physiology, 160(3), 271-282.
Glenn, E. P., Huete, A. R., Nagler, P. L., & Nelson, S. G. (2008). Relationship between remotely-sensed vegetation indices, canopy attributes and plant physiological processes: What vegetation indices can and cannot tell us about the landscape. Sensors, 8(4), 2136-2160.
Goetz, S., & Dubayah, R. (2011). Advances in remote sensing technology and implications for measuring and monitoring forest carbon stocks and change. Carbon Management, 2(3), 231-244.
Gupta, R. K., D. Vijayan, and T. S. Prasad. 2003. Comparative analysis of red-edge hyperspectral indices. Advances in Space Research 32 (11):2217-2222.
Haboudane, D., Miller, J. R., Pattey, E., Zarco-Tejada, P. J., & Strachan, I. B. (2004). Hyperspectral vegetation indices and novel algorithms for predicting green LAI of crop canopies: Modeling and validation in the context of precision agriculture. Remote sensing of environment, 90(3), 337-352.
Horler, D. N. H., Dockray, M., & Barber, J. (1983). The red edge of plant leaf reflectance. International Journal of Remote Sensing, 4(2), 273-288.
Hossain, M. S., Hashim, M., Bujang, J. S., Zakaria, M. H., & Muslim, A. M. (2019). Assessment of the impact of coastal reclamation activities on seagrass meadows in Sungai Pulai estuary, Malaysia, using Landsat data (1994–2017). International Journal of Remote
Sensing, 40(9), 3571-3605.
Huete, A. R. (1988). A soil adjusted vegetation index. Remote Sensing of Environment, 25, 295–309.
Husnayaen, H., Rimba, A. B., Osawa, T., Parwata, I. N. S., As-syakur, A. R., Kasim, F., & Astarini, I. A. (2018). Physical assessment of coastal vulnerability under enhanced land subsidence in Semarang, Indonesia, using multi-sensor satellite data. Advances in Space Research, 61(8), 2159-2179.
Jung A, Kardevan P, Tőkei L (2006): Hyperspectral Technology in Vegetation Analysis. Progress in Agricultural Engineering Sciences 2(1), 93-115. DOI: 10.1556/Progress.2.2006.1.5
Kanke, Y., Tubaña, B., Dalen, M., & Harrell, D. (2016). Evaluation of red and red-edge reflectance-based vegetation indices for rice biomass and grain yield prediction models in paddy fields. Precision agriculture, 17(5), 507-530.
Kawabata, A., Ichii, K., & Yamaguchi, Y. (2001). Global monitoring of interannual changes in vegetation activities using NDVI and its relationships to temperature and precipitation. International journal of remote sensing, 22(7), 1377-1382.
Klemas, V. (2012). Airborne remote sensing of coastal features and processes: An overview. Journal of Coastal Research, 29(2), 239-255.
Kross, A., McNairn, H., Lapen, D., Sunohara, M., & Champagne, C. (2015). Assessment of RapidEye vegetation indices for estimation of leaf area index and biomass in corn and soybean crops. International Journal of Applied Earth Observation and Geoinformation, 34, 235-248.
Kumar, L., Schmidt, K., Dury, S., & Skidmore, A. (2002). Imaging spectrometry and vegetation science. In Imaging spectrometry (pp. 111-155). Springer, Dordrecht.
Lamb, D. W., M. Steyn-Ross, P. Schaare, and M. M. Hanna. 2002. Estimating leaf nitrogen concentration in ryegrass (Lolium spp.) pasture using the chlorophyll red-edge: Theoretical modeling and experimental observations. International Journal of Remote Sensing 23: 3619-3648.
Li, C., Zhu, X., Wei, Y., Cao, S., Guo, X., Yu, X., & Chang, C. (2018). Estimating apple tree canopy chlorophyll content based on Sentinel-2A remote sensing imaging. Scientific reports, 8(1), 3756.
Lotze, H. K., Lenihan, H. S., Bourque, B. J., Bradbury, R. H., Cooke, R. G., Kay, M. C., ... & Jackson, J. B. (2006). Depletion, degradation, and recovery potential of estuaries and coastal seas. Science, 312(5781), 1806
1809.
Lyons, M. B., Phinn, S. R., & Roelfsema, C. M. (2012). Long term land cover and seagrass mapping using Landsat and object-based image analysis from 1972 to 2010 in the coastal environment of South East Queensland, Australia. ISPRS Journal of
Photogrammetry and Remote Sensing, 71, 34-46.
Lukas, V., Novák, J., Neudert, L., Svobodova, I., Rodriguez-Moreno, F., Edrees, M., & Kren, J. (2016). The combination of UAV survey and landsat imagery for monitoring of crop vigor in precision agriculture. International Archives of the
Photogrammetry, Remote Sensing and Spatial Information Sciences, 8.
Meer, F. V. D., & De Jong, S. M. (2006). Imaging
spectrometry for agriculture applications. In G.J.P.W. Clevers and R. Jongschaap (Eds), Imaging
spectrometry: Basic principal and prospective application, 157-197. Dordrecht, The Netherlands: Springer.
Miller, J. R., Hare, E. W., & Wu, J. (1990). Quantitative characterization of the vegetation red edge reflectance 1. An inverted-Gaussian reflectance model. Remote Sensing, 11(10), 1755-1773.
Mukaromah, L. (2017). HyMap airborne hyperspectral imagery and field-based ecological analysis for plant community assessment on Rottnest Island, Western Australia (Doctoral dissertation, Murdoch University).
Nehren, U., Thai, H. H. D., Marfai, M. A., Raedig, C., Alfonso, S., Sartohadi, J., & Castro, C. (2016).
Ecosystem services of coastal dune systems for hazard mitigation: Case studies from Vietnam, Indonesia, and Chile. In Ecosystem-based disaster risk reduction and adaptation in practice (pp. 401-433). Springer, Cham.
Nicolas, T., Philippe, V., & HUANG, W. J. (2010). New index for crop canopy fresh biomass estimation. Spectroscopy and Spectral Analysis, 30(2), 512-517.
Nguy-Robertson, A., Gitelson, A., Peng, Y., Viña, A., Arkebauer, T., & Rundquist, D. (2012). Green leaf area index estimation in maize and soybean: Combining vegetation indices to achieve maximal sensitivity. Agronomy Journal, 104(5), 1336-1347.
Ollinger, S. V. (2011). Sources of variability in canopy reflectance and the convergent properties of plants. New Phytologist, 189(2), 375-394.
Pinna, M. S., Bacchetta, G., Cogoni, D., & Fenu, G. (2019). Is vegetation an indicator for evaluating the impact of tourism on the conservation status of Mediterranean coastal dunes? Science of The Total Environment, 674, 255-263.
Peng, Y., & Gitelson, A. A. (2012). Remote estimation of gross primary productivity in soybean and maize based on total crop chlorophyll content. Remote Sensing of Environment, 117, 440–448.
Pettorelli, N., Vik, J. O., Mysterud, A., Gaillard, J. M., Tucker, C. J., & Stenseth, N. C. (2005). Using the satellite-derived NDVI to assess ecological responses to environmental change. Trends in ecology &
evolution, 20(9), 503-510.
Pettorelli, N. (2013). Satellite data-based indices to monitor land use and habitat changes. Biodiversity Monitoring and Conservation: Bridging the Gaps between Global Commitment and Location Action, 97-119.
Pu, R., Gong, P., Biging, G. S., & Larrieu, M. R. (2003). Extraction of red edge optical parameters from Hyperion data for estimation of forest leaf area index. IEEE Transactions on geoscience and remote sensing, 41(4), 916-921.
Raper, T. B., & Varco, J. J. (2015). Canopy-scale
wavelength and vegetative index sensitivities to cotton growth parameters and nitrogen status. Precision Agriculture, 16(1), 62-76.
Roman, A., & Ursu, T. (2016). Multispectral satellite imagery and airborne laser scanning techniques for the detection of archaeological vegetation marks. In Landscape Archaeology on The Northern Frontier of The Roman Empire at Porolissum-An
Interdisciplinary Research Project. Mega Publishing House, pp.141-152
Roslani, M. A., Mustapha, M. A., Lihan, T., & Wan, W. A. (2014). Applicability of Rapideye satellite imagery in mapping mangrove vegetation species at Matang mangrove forest reserve, Perak, Malaysia. Journal of Environmental Science and Technology, 7(2), 123-136.
Salas, E., & Henebry, G. (2014). A new approach for the analysis of hyperspectral data: Theory and sensitivity analysis of the Moment Distance Method. Remote sensing, 6(1), 20-41.
Schloss, A. L., Kicklighter, D. W., Kaduk, J., Wittenberg, U., & Intercomparison, T. P. O. T. P. N. M. (1999). Comparing global models of terrestrial net primary productivity (NPP): comparison of NPP to climate and the Normalized Difference Vegetation Index (NDVI). Global Change Biology, 5(S1), 25-34.
Thenkabail, P. S., Smith, R. B., & DePauw, E. (2000). Hyperspectral vegetation indices and their relationships with agricultural crop characteristics. Remote Sensing of Environment, 71, 158–182
Unsworth, R. K., Ambo-Rappe, R., Jones, B. L., La Nafie, Y. A., Irawan, A., Hernawan, U. E., ... & Cullen-Unsworth, L. C. (2018). Indonesia's globally significant seagrass meadows are under widespread threat. Science of the Total Environment, 634, 279-286.
Verrelst, J., Malenovský, Z., Van der Tol, C., Camps-Valls, G., Gastellu-Etchegorry, J. P., Lewis, P., ... & Moreno, J. (2019). Quantifying vegetation biophysical variables from imaging spectroscopy data: a review on retrieval methods. Surveys in Geophysics, 40(3), 589629.
Viña, A., Gitelson, A. A., Nguy-Robertson, A. L., & Peng, Y. (2011). Comparison of different vegetation indices for the remote assessment of green leaf area index of crops. Remote Sensing of Environment, 115(12), 34683478.
Weng, Q., Hu, X., & Lu, D. (2008). Extracting impervious surfaces from medium spatial resolution multispectral and hyperspectral imagery: a
comparison. International Journal of Remote
Sensing, 29(11), 3209-3232.
Xu, N., Tian, J., Tian, Q., Xu, K., & Tang, S. (2019). Analysis of Vegetation Red Edge with Different Illuminated/Shaded Canopy Proportions and to
Construct Normalized Difference Canopy Shadow Index. Remote Sensing, 11(10), 1192.
Xue, J., & Su, B. (2017). Significant remote sensing
vegetation indices: A review of developments and applications. Journal of Sensors, 2017.
Zhang, Z., Liu, M., Liu, X., & Zhou, G. (2018). A new vegetation index based on multitemporal Sentinel-2 images for discriminating heavy metal stress levels in rice. Sensors, 18(7), 2172.
Zhu, Y., Liu, K., Liu, L., Myint, S., Wang, S., Liu, H., & He, Z. (2017). Exploring the potential of worldview-2 red-edge band-based vegetation indices for estimation of mangrove leaf area index with machine learning algorithms. Remote Sensing, 9(10), 1060.
Zolkos, S. G., Goetz, S. J., & Dubayah, R. (2013). A metaanalysis of terrestrial aboveground biomass estimation using lidar remote sensing. Remote Sensing of Environment, 128, 289-298.
© 2019 by the authors; licensee Udayana University, Indonesia. This article is an open access article distributed under the terms and conditions of the Creative Commons Attribution license (http://creativecommons.org/licenses/by/3.0/).
J. Mar. Aquat. Sci. 5: 251-259 (2019)
Discussion and feedback