Growth Pattern of Skipjack Tuna (Katsuwonus Pelamis) Landed in PPI Kedonganan Bali
on
Journal of Marine and Aquatic Sciences 5(2), 211-218 (2019)
Growth Pattern of Skipjack Tuna (Katsuwonus Pelamis) Landed in PPI Kedonganan Bali
I Gusti Ayu Febiana Putri Wardeni a*, Pande Gde Sasmita Julyantoro a, Rani Ekawaty a
a Aquatic Resources Management Study Programme, Faculty of Marine Science and Fisheries, Udayana University, Jimbaran, Badung, Bali-Indonesia
* Correspondence author. Phone.: +6285710328040
E-mail: ayufebianaputriw@yahoo.com
Diterima (received) 5 Desember 2017; disetujui (accepted) 12 Juni 2018; tersedia secara online (available online) 13 Juni 2019
Abstrak
Ikan Cakalang (Katsuwonus Pelamis) merupakan salah satu ikan pelagis besar dalam sumberdaya perikanan yang bernilai ekonomis tinggi dan berperan penting pada kegiatan ekspor di Indonesia. Kegiatan penangkapan yang dilakukan untuk memenuhi permintaan masyarakat dapat menyebabkan keberadaan Ikan Cakalang terancam. Untuk menjaga kelestariannya, perlu dilakukan penelitian mengenai pola pertumbuhan Ikan Cakalang yang dapat dijadikan data untuk rencana pengelolaan yang sesuai. Penelitian dilakukan pada bulan Februari hingga April 2017 di PPI Kedonganan, Kuta Badung, Bali. Metode pengambilan sampel ikan yang digunakan yaitu simple random sampling. Hasil penelitian menunjukkan alat tangkap yang digunakan yaitu jaring insang (gillnet) dan pancing (handline). Penelitian menunjukkan bahwa sebaran frekuensi panjang Ikan Cakalang tertinggi terdapat pada selang kelas panjang 315-337mm yang berarti ikan yang tertangkap tergolong masih muda. Pola pertumbuhan Ikan Cakalang yaitu allometrik negatif yang merupakan pertambahan panjang lebih cepat dari pertambahan bobot. Parameter pertumbuhan Ikan Cakalang diperoleh panjang asimtotik (Linf) sebesar 875.2mm, koefisien pertumbuhan (K) sebesar 0.09, dan umur teoritis (t0) sebesar -0.78. Kondisi Ikan Cakalang memiliki tubuh yang kecil yang mana faktor kondisi pada seluruh pengamatan berkisar 0.8783-1.7269. Data yang telah diiperoleh dalam penelitian ini dapat dijadikan acuan untuk menentukan upaya pengelolaan yang tepat.
Kata Kunci: ikan cakalang; PPI Kedonganan; panjang; bobot; pertumbuhan.
Abstract
Skipjack Tuna (Katsuwonus Pelamis) is one of the big pelagic fish in fishery resources that has high economic value and plays an important role in export activity in Indonesia. Catch activities for consumption needs for people could threatened of Skipjack Tuna availability. The growth pattern of Skipjack Tuna is needed to used as references for the appropriate management plan to protect Skipjack Tuna. The research was conducted from February to April 2017 at PPI Kedonganan, Kuta District, Badung, Bali. The fish were collected by simple random sampling method. This study showed that gillnet and handline were used as fishing gears. The length frequency distributions were in the long-range of 315-337 mm means the catch fish is still young. The growth pattern of Skipjack Tuna was negative allometric means length growth was faster than weight growth. The growth parameters of Skipjack Tuna were obtained by the asymptotic length (Linf) of 875.2 mm, growth coefficient (K) of 0.09, and theoretical age (t0) of -0.78. Skipjack Tuna have small body size with condition factors were ranged from 0.8783-1.7269. It can be concluded that these methods can be used to determine the appropriate management efforts.
Keywords: skipjack tuna; Kedonganan Fish Landing Base; length; weight; growth.
Skipjack Tuna (Katsuwonus Pelamis) is belong to the
Scombridae family located in all of tropical and
subtropical oceans (Tilohe et al., 2014). Fish Skipjack is one type of fishery resources that play an important role in the export activities in Indonesia and as ingredients of domestic consumption
(Budiasih et al., 2015). The distribution area of Skipjack Tuna in Indonesian waters is quite wide and spread out all across Indonesian waters. The area were included Indian Ocean waters (including West Sumatra waters, South Java waters, Bali and Nusa Tenggara), East Indonesia waters (including Cellebes Sea, Mollucas, Arafuru, Banda, Flores and Makassar Straits) and Pasific Ocean waters (North Irian Jaya waters) with the largest dispersal area around the equator (Uktolseja et al., 1989). Skipjack Tuna distribution are so wide that it lead to the high production of Indonesian capture fisheries. It can be influence the economic growth rate in marine and fisheries sector. In order to meet the market demand,
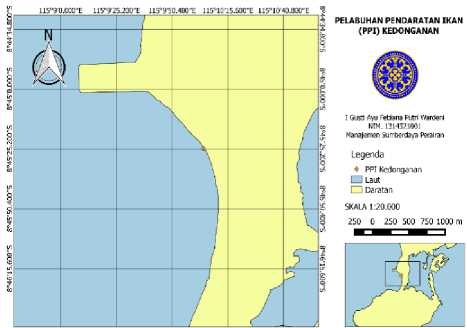
IisaSUCOOivE 115"9r25.200*E IlSo^StbIOCE IlSaIOiS-SOCE 115a10,40.800'E
Figure 1. Research Location Map
people keep on fish continuously which lead to high exploitation. Therefore, protection of Skipjack Tuna that still available in nature are urgently needed. It can be conducted basicly by investigate the biological aspects of the fish with one of it is the fish growth.
PPI Kedonganan is one of the fish landing base in Bali Province. PPI Kedonganan located at Kedonganan Beach, South Kuta District, Badung. It used as a place for fisheries resources management in Bali Province especially in the Southern Bali. Instead of being a place for fisheries resources management, PPI Kedonganan have traditional and modern fish market in the area.
This study was aimed to find the growth pattern of Skipjack Tuna (Katsuwonus Pelamis) based on length-weight relationship, length frequency distribution, condition factor and growth parameter and also to find the condition of Skipjack Tuna fishery at PPI Kedonganan. The result can be used as data base for a determinant plan of fisheries management efforts especially for Skipjack Tina (Katsuwonus Pelamis) that landed at PPI Kedonganan Bali.
The research was conducted at PPI Kedonganan, Kuta District, Badung, Bali. Data collection was done for three months, from February to April 2017 with data collection interval every two weeks. The data was collected from catch of Skipjack Tuna that landed in PPI Kedonganan.
-
2.2 Materials
Measurement of fish length and weight was conducted in PPI Kedonganan directly. The research tools were using fabric meter with 0.1 cm accuracy, ruler, stationery, camera, white paper, base board and digital scale with 1 gram accuracy. Meanwhile, research materials used Skipjack Tuna from fisherman catch who landed at PPI Kedonganan.
-
2.3 Research time
The method used in this research was descriptive method with survey method for data collection. Descriptive method intend to explain or describe the facts that exist systematically, factually and accurately (Aji et al., 2013). There were two types of data used including, primary data and secondary data. Primary data is length and weight measurements of fish that were conducted at PPI Kedonganan, while secondary data is Skipjack Tuna catch production for the last 5 years was obtained from PPI Kedonganan database. Steps for sampling at PPI Kedonganan is describe as follow: a. Fish Sampling
The fish were sample used simple random sampling method by taking out of Skipjack Tuna from some fish baskets randomly. The number of sampling fish were ± 60 specimens Skipjack Tuna for each sampling data.
-
b. Length and Weight Measurement
Skipjack Tuna samples were taken from PPI Kedonganan then measured its length and weight of those fish. The obtained data was used for the growth pattern of Skipjack Tuna. The length of the
fish was measured from the tip of the snout to the end of the middle caudal fin (forked length/FL).
-
2.4 Data analysis
-
2.4.1. Length frequency distribution
-
Length frequency distribution data are collected from the length data of forked length of Skipjack Tuna. There are some steps to study length frequency distribution (Walpole, 1992) such as: by determined the number of required class interval; determined the territory; divided the territory with the number of classes to estimate the interval class width; determined the lower limit class for the first interval and then the lower limit class to get the upper limit class, then added the class width to the lower limit class to get the upper limit class; listed all class limits and limit class by adding class widths to limits and previous interval limits; determined the midpoint class for each interval by averaging the class limit; determined the frequency for each class; added up the frequency column then check if the result is equal to the total number of observations.
The determination of the number of classes can be calculated using the Sturges formula (Walpole, 1962):
K = 1 + 3.32 logn
(1)
where K is total class; and n is total of data observation.
To calculate the range of data / region using the formula:
Range = max data - min data
To calculate interval class using the formula:
Range Interval=
Total class
(3)
-
2.4.2. Length weight relationship
Weights can be considered as a function of length. Length-weight relationship can be performed by the formula (Effendie, 2002):
W = aLb
(4)
where W is weight (gram); L is forked length (millimeter); a and b are constants.
-
2.4.3. Growth parameters
The growth model associated with the length fish in which the formula is expressed by Von Bertalanffy, then called the Von Bertalanffy Model was (Sparre and Venema, 1999):
Lt = Linf (1 - e(-k(t-to)))
(5)
where Lt is length at age t (millimeter); t is observed age; Linf is length of oldest individuals in the stock (millimeter); K is constant parameter relating to the growth rate (years); and t0 is theoretical age when the length= 0 (or in other words where the curve cuts the x-axis).
To find the value of Linf and K were using Ford-Walford method which is the growth transformation from Von Bertalanffy method. The equations are:
Ln+ι = Linf (1 - e- k ) + Lte- k (6)
The values of Linf and K using the following formula:
Linf =
a
1—b
K = - ln b
(7)
(8)
To find the theoretical age (t0) was using Pauly empirical equation (1984). The equations are:
Log -(t0) = -0.3922 - 0.2752LogL -1.038LogK (9)
-
2.4.4. Condition factor
The condition factor was calculated based on the length and weight of the fish by using the following formula (Effendie, 2002). If the value of b = 3 (type of growth is isometric), then the formula was using:
105W (gram)
K = Lg mm) (10)
If the value of b ≠ 3 (growth type is allometric), then the formula was using:
W K =
aLb
(11)
where K is condition factor; W is weight (gram); L is length (millimeter); a and b are constants.
PPI Kedonganan located at Kedonganan Village, South Kuta District, Badung Regency, Bali Province. PPI Kedonganan is under the working area of Marine and Fisheries Badung Regency Office. PPI Kedonganan is a trading place for fishery products from several Indonesian waters such as Southern Java, Lombok, Bali, and Indian Ocean. Instead of being trading place for fishery products, PPI Kedonganan also record the data of catch fisheries landed at PPI Kedonganan. The catch production data of Skipjack Tuna in PPI Kedonganan graph as shown below:
This handline have 35 pieces hooks of 9 size with length of ± 70 m and depth of 30-60 m. The local name of this handline is known by local fishermen as a “pancing bulu” because it has synthetic bait that similar to chicken feathers or smooth raffia pieces.
-
3.3 Length frequency distribution
Total data of Skipjack Tuna have been observed as many as 318 specimens came from different catch areas. The fish sampling does not distinguish the sex of fish. The length frequency distribution was analyzed using Microsoft Excel 2013 software. The length frequency distribution of Skipjack Tuna graph as shown below:

Figure 2. Graph of Catch Fisheries Production at PPI Kedonganan
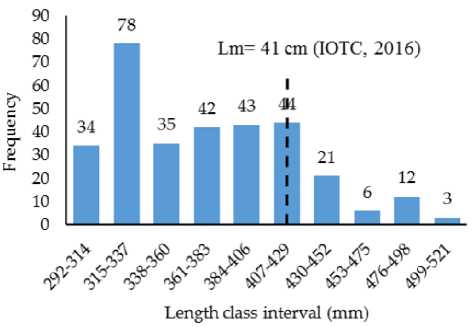
Figure 3. Graph of Distribution of Skipjack Tuna Length Frequency
Catch production data in PPI Kedonganan have been recorded since 2011. It can be assumed that the recording of catch production data only available for the last 5 years (Ekawaty et al., 2015). In the graph above indicated the catch fisheries production at PPI Kedonganan in the last 5 (five) years. Skipjack Tuna (Katsuwonus Pelamis) is one of the most dominant catches in addition to other fish. Skipjack Tuna catch area which landed in PPI Kedonganan came from several different areas such as Southern Java, Lombok, Bali, Sulawesi and Indian Ocean.
-
3.2 Fishing gears
The fishing gear used to catch the Skipjack Tuna in PPI Kedonganan are gillnet and handline. The gill net has a mesh size of 4 inches with length of 700 m with depth of 16 m. Meanwhile, the handline consists of hook, fishing lines and synthetic bait.
In length frequency distribution of Skipjack Tuna graph was obtained the length of fish range from 292-521 mm where the highest length class was found in length class interval of 315-337 mm with the total fish of 78 specimens and the lowest length class was found in length class interval of 499-521 mm with the total fish of 3 specimens. Age group as many as 4 age groups. The results were different from the results of research was conducted by Baso (2017) in Bone Bay waters in the rumpon areas obtained by length frequency interval was dominated by the 502-522 mm with the total fish of 121 specimens and the lowest length class was found in length class interval 422-442 mm with the total fish of 9 specimens. This size differences can occur because the Lm values is vary. Individuals who come from one age class or the same length class, do not always reach the first length of mature at the same size (Nurdin et al., 2012). Based on the Lm (first size mature) value of 410 mm or 41 cm
(IOTC, 2016), the total of Skipjack Tuna caught and smaller than the size of the first mature is 272 specimens or 85%. It can be assumed that has been growth overfishing which is a fishing activity was conducted before the fish can grow to a size where further increase of growth will be able to make balance with the decrease of stock caused by natural mortality (example predation) (Zamani et al., 2011).
-
3.4 Length-weight relationship
Length-weight relationship of Skipjack Tuna were analyzed by using the length data in millimeter (mm) and the weight in gram (g). It was to showed the relation of length and weight of the Skipjack Tuna landed at PPI Kedonganan. Length-weight relationship was analyzed using Microsoft Excel 2013 software. The length-weight relationship of Skipjack Tuna graph as shown below:
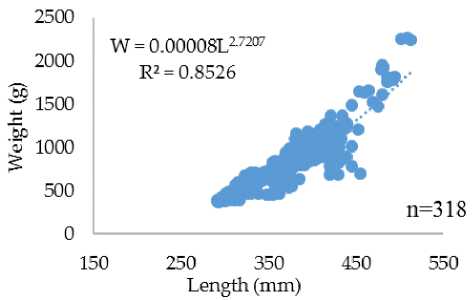
Figure 4. Graph of Relationship Length-Weight of Skipjack Tuna
The observation result for length-weight relationship of Skipjack Tuna obtained through equation of W = 0.00008L2.7207 with the correlation determination (R2) of 0.8526. This correlation determination (R2) means the model represented real in nature of 85.2%. If the determination value is higher then the length-weight relationship is close (Muttaqin et al., 2016). After t-test, it resulted with thit > ttab in rejection H0 so that the growth pattern of Skipjack Tuna is negative allometric with b value of 2.7207. Similar growth pattern of Skipjack Tuna was also obtained on Skipjack Tuna landed at Tulehu Ambon Port of negative allometric with b value of 2.751 (Nugraha et al., 2010), Prigi waters of East Java is negative allometric with b value of 2.733 (Nurdin et al., 2012). However, different research results were found in PPS Cilacap Central Java is isometric with b value of 3.0 (Satria, 2015) and
positive allometric with b value of 3.1982 in PPN Palabuhanratu West Java (Fadhillah, 2010). The growth pattern of the Skipjack Tuna landed in PPI Kedonganan were not the same as the growth pattern in some areas of Indonesian waters. These was probably caused by the availability of food, climate, fishing grounds and the sex of fish. In addition, the size of fish samples can be affected by the results obtained. This is in accordance with the statement of Fuadi et al (2016) that differences in growth patterns can be due to the number and variation of different fish sizes observed. Lengthweight relationship affect of Skipjack Tuna is also caused by several factors such as habitat, environment, season, type of food, mature gonad, health and sex (Hossain, 2010).
-
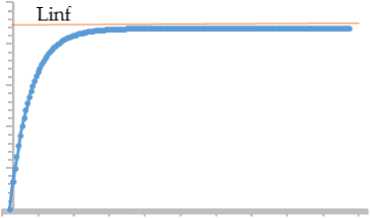
3.5 Growth parameters
Estimation of fish growth from body length and weight of individual that is to know growth rate of fish and to explain change amount of fish stock in nature caused by influence of catch fishery dynamics (Nursinar et al., 2015). Calculation of fish growth parameters using Ford-Walford and Von Bertalanffy method which were analyzed with Microsoft Excel 2013 software. The growth parameters of Skipjack Tuna graph as shown below:
10∞
800
E'
S 600 ⅞ 400
O) “ 200
0
-
-5 15 35 55 75 95 115 135 155 175 195 Age (month)
Figure 5. Graph of Skipjack Tuna Growth
Calculation of fish growth parameters using Ford-Walford method. The observation result was obtained asymtotic length (Linf) value of 875.2 mm, growth coefficient (K) of 0.09, and theoretical age (t0) of -0.78. Based on the value of Skipjack Tuna growth parameters that have been obtained (Linf, K and t0), the Von Bertalanffy growth curve of Skipjack Tuna produced the equation of Lt = 875.2 (1-e(-0.09 (t+0.78)). The results were different from the results of research was conducted by Baso (2017) in
Bone Bay waters in the rumpon areas obtained by the value of Skipjack Tuna growth parameter of asymtotic length (Linf) of 839.15 mm or 83.91 cm, growth coefficient (K) of 0.31589, and theoretical age (t0) of 0.34 with the growth equation obtained of Lt = 839.15 (1-e(-0.31589 (t + 0.3474)). The coefficient of Skipjack Tuna growth in PPI Kedonganan is smaller than growth coefficient in Baso research (2017). So it can be told that the growth of Skipjack Tuna was slowed. The K value indicate that speed of individual fish to achieve asymptotic length, so if the K value gets bigger then the asymptotic length value gets faster or the shorter the life of fish (Rochman et al, 2015). Different research of resulted in this research was possibility due to various factors affecting fish growth. The difference of the growth parameters (Linf and K) to the same fish species and different locations can be affected by environmental factors of each water such as food availability, water temperature, dissolved oxygen, fish size and gonad maturity (Jamal et al., 2011).
-
3.6 Condition factor
The condition factor is one of important things in growth. The condition factor indicated the state of fish viewed in physical capacity to survive and reproduce expressed in numeral based on length and weight data of the fish (Effendie, 2002). The condition factors value obtained during the research on each observation were fluctuated. The average value of the highest Skipjack Tuna condition factor was in the second observation of 1.72±0.14, whereas the average value of the lowest Skipjack Tuna condition factor was in the fifth observation of 0.87±0.06. The condition factor of Skipjack Tuna graph as shown in:

Figure 6. Graph of Skipjack Tuna Condition Factor
The average value of Skipjack Tuna condition factor ranged from 0.87-1.72 so it can be assumed that the Skipjack Tuna landed in PPI Kedonganan have small body size. Research was conducted by Anggraeni et al (2015) in PPP Sadeng Gunungkidul Regency of Yogyakarta obtained the average value of the condition factor of 1.20. Difference of condition factor values possibility caused by the fish samples have varying sizes and in this research the fish was not distinguished between male and female. In addition, the differences location waters affected the value of which condition factors when the food source in a high water then the value of the condition factor has increased. This is in accordance with Alamsyah et al (2013) statement that condition factor is influenced by index of gonad maturity, food, age of fish, sex and population density in waters.
-
3.7 Fisheries management
The results research of the Skipjack Tuna landed in PPI Kedonganan showed that condition the fish catch were caught in a still small and young. These can be seen from the frequency of Skipjack Tuna was the most widely caught by 272 specimens or 85%, which size is smaller than the size of the first Skipper Tuna mature of 410 mm or 41 cm (IOTC, 2016). While, the young Skipjack Tuna can be seen from the growth patterns obtained allometric negative. This research was conducted from February to April 2017 and the catch of Skipjack Tuna used in this research were classified as young fish. It can be assumed that this research was conducted during the fishing season when Skipjack Tuna was caught low (small and doing grow). According to Satria (2015), the catching season of Skipjack Tuna with low catch during January to May, while the catching season of Skipjack Tuna with high catch during June to October (peak in August to September). Therefore, it can be seen that the condition of Skipjack Tuna was landed in PPI Kedonganan Bali experience excess catching growth (growth overfishing).
Management of fishery resources needs to be performed to reduce the exploitation of fish, especially Skipjack Tuna landed in PPI Kedonganan. Skipjack Tuna production landed in PPI Kedonganan was high enough so that it can be assumed that demand of Skipjack Tuna always be every year. Some alternative efforts of fisheries management that can be performed in PPI
Kedonganan Bali is effort control of Skipjack Tuna to reduce the catch of immature Skipjack Tuna such as establishing catch size above 41 cm, arrange fishing grounds means do not catch in spawning ground, limit the number of catch, and do not add new fleet to catch Skipjack Tuna. In addition, the role and self-awareness of fisheries is needed to realize sustainable fisheries development.
The highest length frequency distribution of Skipjack Tuna was obtained in the length class interval of 315-337 mm. Total of Skipjack Tuna caught and smaller than the size of the first mature gonad (41 cm) is 272 specimens or 85%. The growth pattern of Skipjack Tuna landed in PPI Kedonganan Bali was allometric negative means length growth was faster than weight growth with the growth equation of W = 0.0000L2.7207. The growth
equation of Von Bertalanffy on Skipjack Tuna was Lt = 875.2 (1-e(-0.09 (t+0.78)) with asymtotic length (Linf) of 875.2 mm, growth coefficient (K) of 0.09, and age theoretical (t0) of -0.78. Skipjack Tuna have small body size with condition factors were ranged from 0.8783-1.7269. Fishery condition of Skipjack Tuna have excessive growth overfishing. Some alternative efforts of fisheries management for growth overfishing conditions were efforts controls of Skipjack Tuna to reduce the catching of immature Skipjack Tuna such as establishing catch size above 41 cm, arrange fishing grounds means do not catch in spawning ground, limiting the number of catches, and do not add new fleets to catch Skipjack Tuna.
Acknowledgement
I gratefully acknowledge to the Head of PPI Kedonganan for their kindness and help of this research. I thank Pande Gde Sasmita Julyantoro and Rani Ekawaty for their support and help of this research. I thank numerous friends of Aquatic Resources Management and fisherman in PPI Kedonganan whose help in sampling Skipjack Tuna for this research. I also thank the parents for their support and pray for this research.
Literature cited
Aji, I. N., Wibowo, B. A., & Asriyanto. (2013). Analisis faktor produksi hasil tangkapan alat tangkap cantrang di Pangkalan Pendaratan Ikan Bulu Kabupaten Tuban.
Journal of Fisheries Resources Utilization Management and Technology, 2(4), 50-58.
Alamsyah, A. S., Sara, L., & Mustafa, A. (2013). Studi biologi reproduksi ikan kerapu sunu (Plectropomus areolatus) pada musim tangkap. Jurnal Mina Laut Indonesia, 1(1), 73-83.
Anggraeni, R., Solichin, A., & Saputra, S. W. (2015). Beberapa Aspek Biologi Ikan Cakalang (Katsuwonus Pelamis) dalam Kaitannya untuk Pengelolaan
Perikanan di PPP Sadeng Kabupaten Gunungkidul Yogyakarta. Management of Aquatic Resources Journal, 4(3), 230-239.
Baso, H. S. (2017). Analisis struktur populasi ikan cakalang (Katsuwonus Pelamis) pada daerah rumpon terhadap tekanan eksploitasi di Perairan Teluk Bone. Ecosystem Journal, 17(1), 604-611
Budiasih, D., & Dewi D. A. N. N. (2015). CPUE dan tingkat pemanfaatan perikanan cakalang (Katsuwonus Pelamis) di sekitar Teluk Palabuhanratu, Kabupaten Sukabumi, Jawa Barat. Jurnal Agriekonomika, 4(1), 37-49.
Effendie M. I. (2002). Biologi Perikanan. Yogyakarta, Indonesia: Penerbit Yayasan Pustaka Nusantara
Yogyakarta.
Ekawaty, R., & Ulinuha, D. (2015). Studi aspek biologi dan reproduksi tongkol komo (Euthynnus affinis) yang didaratkan di PPI Kedonganan, Bali. Dalam Prosiding Seminar Nasional Sains dan Teknologi II 2015. Kuta, Indonesia, 29-30 Oktober 2015 (pp. 1049-1056).
Fadhilah, L. N. (2010). Pendugaan pertumbuhan dan mortalitas ikan cakalang (Katsuwonus Pelamis Linnaeus, 1758) yang didaratkan di PPN Palabuhanratu, Kabupaten Sukabumi, Provinsi Jawabarat. Skripsi. Bogor, Indonesia: Departemen Manajemen Sumberdaya Perairan, Fakultas Perikanan dan Ilmu Kelautan, Institut Pertanian Bogor.
Fuadi, Z., Dewiyanti I., & Purnawan S. (2016). Hubungan panjang berat ikan yang tertangkap di Krueng Simpoe, Kabupaten Bireun, Aceh. Jurnal Ilmiah Mahasiswa Kelautan dan Perikanan Unsyiah, 1(1), 169-176.
Hossain, Y. (2010). Length-weight, Length-length relationship and condition factors of three Schibid Catfish from The Padma River, Northwestern Bangladesh. Asian Fisheries Science, (23), 329-339.
Indian Ocean Tuna Commission (IOTC). (2016). Skipjack Tuna (Katsuwonus Pelamis). [online] Tersedia di:
http://www.iotc.org/science/status-summary-species-tuna-and-tuna-species-under-iotc-mandate-well-other-species-impacted-iotc, [diakses: 12 Januari 2018].
Jamal, M., Sondita, M. F. A., Haluan, J., & Wiryawan, B.
-
(2011) . Pemanfaatan data biologi ikan cakalang (Katsuwonus Pelamis) dalam rangka pengelolaan perikanan bertanggung jawab di Perairan Teluk Bone. Jurnal Natur Indonesia, 14(1), 107-113.
Muttaqin, Z., Dewiyanti, I., & Aliza, D. (2016). Kajian hubungan panjang berat dan factor kondisi ikan nila
(Oreochromis niloticus) dan ikan belanak (Mugil cephalus) yang tertangkap di Sungai Matang Guru, Kecamatan Madat, Kabupaten Aceh Timur. Jurnal Ilmiah Mahasiswa Kelautan dan Perikanan Unsyiah, 1(3), 397-403.
Nugraha, B., Mardlijah, S., & Rahmat, E. (2010).
Komposisi ukuran cakalang (Katsuwonus Pelamis) hasil tangkapan hutate yang didaratkan di Tulehu, Ambon. Jurnal BAWAL, 3(3), 199-207.
Nurdin, E., Taurusman, A. A., & Yusfiandayani, R. (2012). Struktur ukuran, hubungan panjang-bobot dan faktor kondisi ikan tuna di Perairan Prigi, Jawa Tengah. Jurnal BAWAL, 4(2), 67-73.
Nursinar, S., & Panigoro, C. (2015). Analisis kelompok umur dan pertumbuhan Decapterus macrosoma di Perairan Sekitar Gorontalo. Jurnal Ilmiah Perikanan dan Kelautan, 3(1), 7-10.
Pauly, D. (1984). Fish population dynamic in tropical waters: a manual for use with programmable calculators. Manila, Philippines: ICLARM.
Rochman, F., Nugraha B., & Wujdi, A. (2015). Pendugaan parameter populasi ikan cakalang (Katsuwonus Pelamis, Linnaeus, 1758) di Samudera Hindia Selatan Jawa. Jurnal BAWAL, 7(2), 77-85.
Satria, A. I. W. (2015). Parameter dinamika populasi ikan cakalang (Katsuwonus Pelamis Linnaeus, 1758) yang didaratkan di PPS Cilacap, Provinsi Jawa Tengah. Skripsi.
Bogor, Indonesia: Departemen Manajemen
Sumberdaya Perairan, Fakultas Perikanan dan Ilmu Kelautan, Institut Pertanian Bogor.
Sparre, P., & Venema, S. C. (1999). Introduction to tropical fish stock assessment - Part 1: Manual. Dalam Widodo, J., Merta, I. G. S., Nurhakim, S., & Badrudin, M. (Terj.), Introduksi pengkajian stok ikan tropis - Buku 1: Manual. Jakarta, Indonesia: Pusat Penelitian dan
Pengembangan Perikanan. (Buku asli diterbitkan 1998).
Tilohe, O., Nursinar, S., & Salam, A. (2014). Analisis parameter dinamika populasi ikan cakalang yang didaratkan di Pangkalan Pendaratan Ikan Kelurahan Tenda Kota Gorontalo. Jurnal Ilmiah Perikanan dan Kelautan, 2(4), 140-145.
Uktolseja, J. C. B., Gafa, B., Bahar, S., & Mulyadi, E., (1989). Potensi dan penyebaran sumberdaya ikan laut Perairan Indonesia. Jakarta, Indonesia: Direktorat Jenderal
Perikanan.
Walpole, R. E. (1992). Pengantar Statistika. (Edisi ke-3). Jakarta, Indonesia: Gramedia Pustaka Utama.
Zamani, N. P., Wardianto, Y., & Nggajo, R. (2011). Strategi pengembangan pengelolaan sumberdaya ikan ekor kuning (Caesio cuning) pada ekosistem terumbu karang di Kepulauan Seribu. Jurnal Saintek Perikanan, 6(2), 38-51.
© 2019 by the authors; licensee Udayana University, Indonesia. This article is an open access article distributed under the terms and conditions of the Creative Commons Attribution license (http://creativecommons.org/licenses/by/3.0/).
J. Mar. Aquat. Sci. 5: 211-218 (2019)
Discussion and feedback