Hybrid Method Implementation Fuzzy K-Nearest Neighbor (FK-NN) And Particle Swarm Optimization (PSO) for Classification of Liver Disease
on
p-ISSN: 2301-5373
e-ISSN: 2654-5101
Jurnal Elektronik Ilmu Komputer Udayana
Volume 11, No 3. February 2023
Hybrid Implementation
Fuzzy K-Nearest Neighbor (FK-NN) And Particle Swarm Optimization (PSO) Methods for Classification of Liver Disease
I Gede Bagus Semara Wijaya a1, Luh Gede Astutia2, I Putu Gede Hendra Suputraa3, I Dewa Made Bayu Atmaja Darmawan a4, I Wayan Santiyasaa5, I Gede Santi Astawaa6
aDepartement of Informatics, Faculty of Mathematics and Natural Science, Udayana University Jl. Raya Kampus Universitas Udayana Bukit Jimbaran, Badung, Bali
-
2 lg.astuti@unud.ac.id 3hendra.suputra@unud.ac.id 4dewabayu@unud.ac.id 5santiyasa67@gmail.com 6santi.astawa@cs.unud.ac.id
Abstract
Liver disease is a disease that attacks the liver or liver where this disease is caused by viral infections, toxic materials and bacteria, causing inflammation of the liver and causing the liver to not function properly. Therefore, the author will conduct research to make a Liver Disease Classification program. This research will use Fuzzy K-Nearest Neighbor (FK-NN) and Particle Swarm Optimization (PSO) methods. Fuzzy K-Nearest Neighbor is a classification method that combines fuzzy and k-nearest neighbor algorithms. Particle Swarm Optimization is a simple optimization technique to apply and modify several parameters. This research will implement the application design to the lines of web-based program code using the Python language and the Django framework. This study resulted in the value of the accuracy range obtained by the PSO-FKNN hybrid method is 66 to 74 (in percent) compared to the range of accuracy values of FKNN without the hybrid method is 64.90% to 68.29% (in percent), the difference in the accuracy values obtained by PSO-FKNN FKNN is affected by changes in the position of the training and testing data in each test.
Keywords: Liver Disease, Fuzzy K-Nearest Neighbor (FK-NN), Particle Swarm Optimization (PSO)
Liver disease is a disease that attacks the liver or liver where this disease is caused by viral infections, toxic materials, and bacteria, causing inflammation of the liver and causing the liver to not function properly. There are several types of liver disease including hepatitis, liver cirrhosis, and liver cancer. People with the liver disease generally experience fatigue, loss of appetite, sudden weight loss, and abdominal pain. If left unchecked, these symptoms can cause several disorders in the liver to cause diseases such as hepatitis, liver cirrhosis, and liver cancer which can end in death. Many researchers research to classify whether a person suffers from liver disease or not. Research on liver disease was previously conducted by Rahmawati in 2015 with the title "Comparative Analysis of the Naïve Bayes Algorithm and C4.5 for Predicting Liver Disease" where this study used the Naïve Bayes algorithm and C4.5 to predict liver disease.
This study tested the Naïve Bayes and C4.5 algorithms using the cross-validation and split presentation methods and then measured using a confusion matrix. The results obtained an
accuracy value of 69.828% on the C4.5 algorithm and 63.362% on the Naïve Bayes algorithm [1]. One method that can also be used for classification is Fuzzy K-Nearest Neighbor (FK-NN).
Fuzzy K-Nearest Neighbor is a classification method that combines fuzzy and k-nearest neighbor algorithms. Research on Fuzzy K-Nearest Neighbor has been conducted previously by Shanti, Hidayat, and Wihandika in 2018 entitled "Implementation of the F-KNN (Fuzzy K-Nearest Neighbor) Method for Dog Disease Diagnosis". This study resulted in the highest accuracy obtained from the test results when K = 5 with a value of 98.67% [2]. The advantage of Fuzzy K-Nearest Neighbor compared to K-Nearest Neighbor is that the relationship between data and class is not rigid because each data has a certain membership value from each class. But Fuzzy K-Nearest Neighbor also has a weakness where the parameters k (neighborhood value) and m (fuzzy power of weight) are fundamental factors that affect the classification results. In determining these parameters it is often difficult to control because it is not certain what the exact values of k and m are so other methods are needed to improve accuracy [3]. The way that can be done is by using a hybrid method that uses 2 methods on a problem. One method that can be used to implement the hybrid method is Particle Swarm Optimization (PSO).
Particle Swarm Optimization is a simple optimization technique to apply and modify several parameters. PSO is also widely used for weight optimization and feature selection. Research on the hybrid method with Particle Swarm Optimization (PSO) has been carried out previously by Muhammad Ridwan Lubis in 2017 entitled Hybrid Particle Swarm Optimization - Neural Network Backpropagation Method for Predicting the results of Football Matches that produce better results on each test with a percentage 0.03% [4].
Next is the research conducted by Siringoringo and Perangin-angin in 2017 as well as their research, namely Hybridization of the Fuzzy K-Nearest Neighbor Method with the Modified Particle Swarm Optimization Method on Classification of Soybean Plant Diseases. This study proves that the application of MPSO to FK-NN can improve performance with the resulting accuracy of 84% for MPSO and FK-NN and 81% for FK-NN only [3].
From the results of the implementation that has been carried out in previous research regarding the hybrid method, this study will conduct research on the Implementation of the Hybrid Fuzzy K-Nearest Neighbor (FK-NN) and Particle Swarm Optimization (PSO) Method for Classification of Liver Disease. PSO here is used to find the optimal k and m parameter values which will then be used in the Fuzzy K-Nearest Neighbor method. This research will conduct a test to get the best combination of parameters produced by PSO and FK-NN. The next test is to compare the accuracy results between the hybrid Fuzzy K-Nearest Neighbor (FK-NN) and Particle Swarm Optimization (PSO) methods without using the hybrid method.
Classification is a technique for designing functions based on observations of the data and attributes of the data so that it can be done mapping of data that does not have a class into data that has been classified according to the rules given. There are many algorithms used to classify data, including fuzzy, artificial neural network, support vector machine and K-nearest neighbor. Classification using these algorithms is generally carried out based on 3 stages:
-
1. Model Design
The process of building solutions to solve problems based on data that has been classified (training data).
-
2. Model Implementation
The process of determining the class for test data is based on the function model and data parameters that have been determined at the design stage.
-
3. Model Evaluation
The process aims to evaluate the results of the implementation of the function model in classifying test data based on predetermined parameters [6].
Fuzzy K-NN is a classification method that combines fuzzy and K-NN techniques. This method differs from other methods in that it explicitly predicts which class the test data follows based on the closest K comparison. The basis of the FK-NN algorithm is the assignment of membership values, which is a function of the K-NN's distance vector and the membership of their neighbors to possible classes.
This approach plays an important role in disambiguating classification. Furthermore, the instances in each class have a certain membership value, so it gives the instance more strength or confidence to be a class [7]. This procedure is performed using Equation (2.2) before computing the membership value in the fuzzy K-NN.
Uij =
(0.51+ Q)* 0.49, if j = 1
..................................................................................(1)
' O0∙4<W j≠1
Descriptions:
= The number of members of class j in a training data n
n = Amount of training data used
j = Data Class
Then calculate the membership value of each class with the formula (2).
fL_f11__j-jj___f_
(2)
i(x) = ∑‰1CHχ-χjH-2×<m-1)
Descriptions:
uij = fuzzy membership value in the test sample (x, xj)
k = nearest neighbor value
j = test data membership data variables
m = power to the power of magnitude m > 1
Particle Swarm Optimization (PSO for short) is based on the behavior of a swarm of insects such as ants, termites, bees or birds. The PSO algorithm mimics the social behavior of these creatures. Social behavior includes the behavior of individuals and the influence of others in the group. The word "particle" refers to an individual, such as a bird in a flock. Each individual or particle uses its intelligence (intelligence) to behave in an interrelated manner and is also influenced by the behavior of the collective group. So if a particle or a bird finds a short path to a food source, other members of the group will be able to follow that path quickly, even if they are far away in the group.
This study uses secondary data obtained from the UCI Machine Learning Repository. This data consists of 583 data records, with a percentage of 71.3% (416 records) for the class with liver disease and 28.7% (167 records) for the class without liver disease. The following is an attribute table for liver disease data:
Table 1 Liver Disease Dataset Features
|
Attribute |
Domain |
|
Age |
4 – 90 |
|
Gender |
0, 1 |
|
Total bilirubin |
0 – 75 |
|
Direct Bilirubin |
0– 13.07 |
|
Total Proteins |
63 - 2110 |
|
Albumin |
10 – 2000 |
|
Albumin and Globulin Ratio |
11 – 4929 |
|
Alamine aminotransferase |
2.07 – 9.06 |
|
Aspartate aminotransferase |
0 – 5.05 |
|
Alkaline Phospotase |
0 – 2.08 |
|
Is_Patients |
1 for liver disease, 2 for not liver disease |
The data used in this study has several types of data values that differ in each of its features, such as the values of tens, hundreds, and decimals, for this reason, normalization will be carried out at the preprocessing stage of the data before use. The normalization technique used in this study is min-max normalization[8]. The following is an example of unnormalized data:
Table 2 Example of unnormalized data (part 1)
|
age |
gender |
tot_bilirubin |
direct_bilirubin |
Tot_proteins |
albumin |
ag_ratio |
|
65 |
0 |
0,7 |
0,1 |
187 |
16 |
18 |
|
62 |
1 |
10,9 |
5,5 |
699 |
64 |
100 |
|
62 |
1 |
7,3 |
4,1 |
490 |
60 |
68 |
|
58 |
1 |
1 |
0,4 |
182 |
14 |
20 |
|
72 |
1 |
3,9 |
2 |
195 |
27 |
59 |
Table 3 Example of unnormalized data (part 2)
|
sgpt |
sgot |
alkphos |
is_patients |
|
6,8 |
3,3 |
0,9 |
1 |
|
7,5 |
3,2 |
0,74 |
1 |
|
7 |
3,3 |
0,89 |
1 |
|
6,8 |
3,4 |
1 |
1 |
|
7,3 |
2,4 |
0,4 |
1 |
Then after the normalization process, the data will look like the following:
Table 2 Example of normalized data (part 1)
|
age |
Gender |
tot_bilirubin |
direct_bilirubin |
Tot_proteins |
albumin |
ag_ratio |
|
0,709302 |
0 |
0,004021 |
0,007692 |
0,060576 |
0,003015 |
0,001423 |
|
0,674419 |
1 |
0,140751 |
0,423077 |
0,310699 |
0,027136 |
0,018097 |
|
0,674419 |
1 |
0,092493 |
0,315385 |
0,208598 |
0,025126 |
0,01159 |
|
0,627907 |
1 |
0,008043 |
0,030769 |
0,058134 |
0,00201 |
0,00183 |
|
0,790698 |
1 |
0,046917 |
0,153846 |
0,064485 |
0,008543 |
0,00976 |
Table 3 Example of normalized data (part 2)
|
sgpt |
sgot |
alkphos |
is_patients |
|
0,685714 |
0,585366 |
0,352941 |
1 |
|
0,785714 |
0,560976 |
0,258824 |
1 |
|
0,714286 |
0,585366 |
0,347059 |
1 |
|
0,685714 |
0,609756 |
0,411765 |
1 |
|
0,757143 |
0,365854 |
0,058824 |
1 |
The PSO process will go through the initial stages, namely the initialization of parameters and training data, and data testing. This PSO process will produce optimal values of the parameters k and m used in the F-KNN process. This optimal parameter value will be used in the process of testing the F-KNN method to obtain classification results.
In the F-KNN process, the optimal k and m parameter values are obtained from the PSO process. The parameters obtained are the optimal combination to get the best accuracy results which will later be used as the fitness value in the PSO process. Each combination of k and m parameters will be tested on the F-KNN method until the stopping condition has been met, namely the maximum iteration or convergent value. The results of this test will be used to obtain the results of the classification in the F-KNN method.
3.
3.1.
Result and Discussion
Application Interface Design
This research will implement the application design to the lines of web-based program code
using the Python language and the Django framework. Furthermore, this program will be run on a PC device with an interface that has input from the researcher as the user. The following is the system interface design which can be seen in Picture 1, and Picture 2 below.
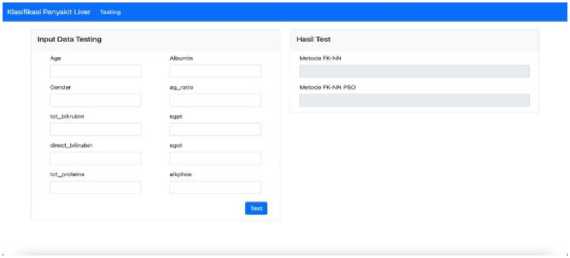
Picture 1 Testing interface display
Picture 3 is the page used to test the classification of liver disease. On this page, the user (researcher) is asked to input parameters and 10 features of the data to be tested. Furthermore, the system will provide feedback in the form of classification results obtained from each method.
Picture 4 is the main page of the classification system. This page consists of 2 parts, namely on the left side is a form that functions to input the parameters needed from the FKNN and PS methods for the training process. On the right side is the result of the accuracy of the classification of the implementation of different methods, namely the hybrid FKNN and PSO methods compared
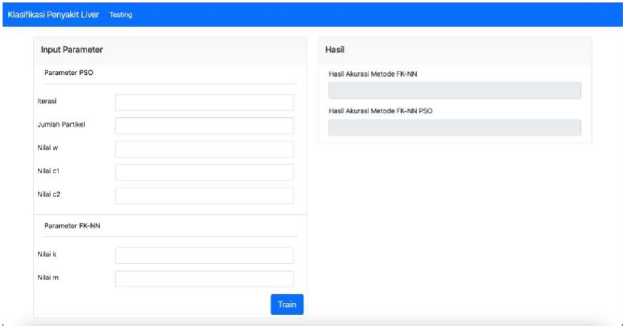
Picture 2 Training interface display
to the FKNN method without the hybrid method. The train button is a button to bring up a table of test results for all training data presented in full.
The values of k and m are the parameters used in the FKNN method to determine the effect of the parameter w, then the experiment is carried out 10 times with the values of k and m using different combinations and the value of w is 0.5, C1 = 0.7 and C2 = 1.3 with 100 iterations.
Table 6 FKNN Parameter Test Results
|
Number |
K |
M |
FKNN Accuracy |
|
1 |
18 |
20 |
65% |
|
2 |
14 |
10 |
70% |
|
3 |
14 |
11 |
70.10% |
|
4 |
16 |
4 |
71.92% |
|
5 |
17 |
6 |
69.29% |
|
6 |
18 |
2 |
72.80% |
|
7 |
13 |
20 |
68.42% |
|
8 |
10 |
10 |
66.66% |
|
9 |
6 |
19 |
64.91% |
|
10 |
4 |
20 |
63.15% |
Table 6 shows that the smaller the M value used, the greater the accuracy is inversely proportional to the K value, whereas the larger the K value used, the greater the accuracy value. The best accuracy results are obtained when K has a value of 18 and M has a value of 2 with an accuracy of 72.80%.
The value of w is a parameter used to control the velocity given by the particle. To determine the effect of the w parameter, the w value will be used as an independent parameter, where the w value to be tested has a range between 0.3 to 0.8. The tests carried out were 10 trials with 100 iterations, based on the results of experiments that have been carried out, the average accuracy and iteration can be seen in Table 7 below.
Table 7 Parameter Test Results W
|
W |
0.5 |
0.3 |
0.6 |
0.7 |
0.8 |
|
Mean Accuracy |
74% |
71% |
66% |
73% |
72% |
Table 7 shows the value of w 0.5 has the highest average accuracy value in this experiment with a value of 74%. This is due to changes in the position of the testing and training data during the experiment. The difference in the average value of accuracy can be seen in Picture 3 below.
Comparison Value Accuracy
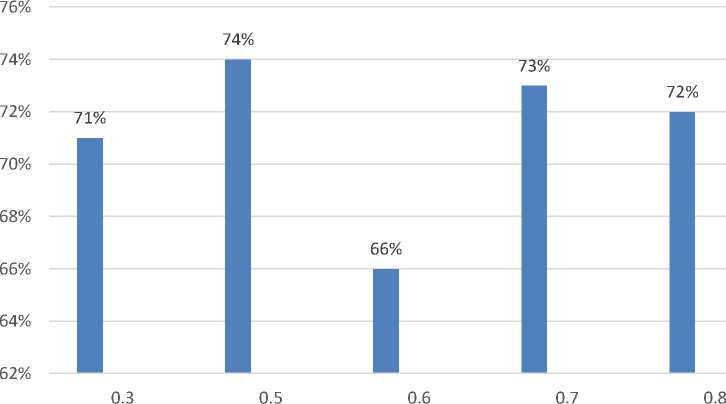
Picture 3 W Accuracy Value Comparison
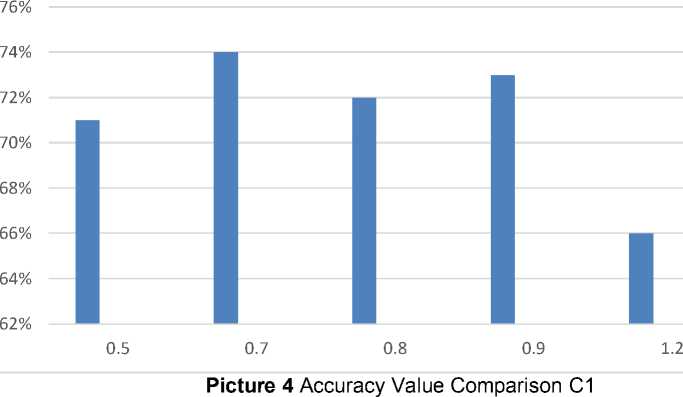
Testing the c1 parameter, in this test the c1 parameter is an independent parameter whose test value is in the range of 0.1 to 1.5. The results of the average accuracy and iteration can be seen in table 8 below.
Table 8 Parameter Test Results C1
|
Nilai C1 |
0.5 |
0.7 |
0.8 |
0.9 |
1.2 |
|
Mean Akurasi |
71% |
74% |
66% |
73% |
72% |
Based on table 8 shows the value of C1 0.7 has the highest average accuracy value in this experiment with a value of 74%. This is also caused by the displacement of the testing and training data positions during the experiment. The difference in the average value of accuracy can be seen in Picture 4 below.
Average Accuracy Score
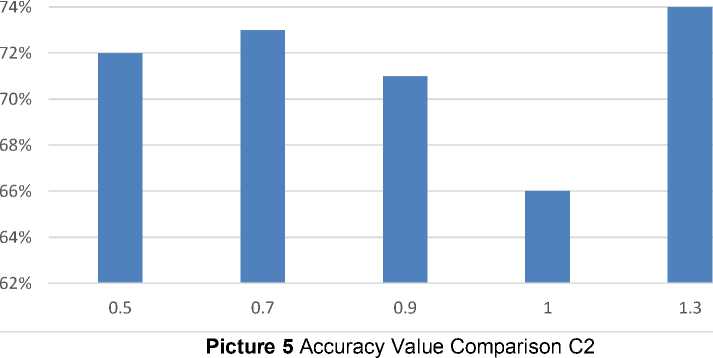
Testing the c2 parameter, in this test the c2 parameter is an independent parameter whose test value is in the range of 0.1 to 1.5. The results of the average accuracy and iteration can be seen in table 9 below.
Table 9 Parameter Test Results C2
|
C1 |
0.5 |
0.7 |
0.9 |
1 |
1.3 |
|
Mean Accuracy |
72% |
73% |
71% |
66% |
74% |
Based on table 9 shows the value of C1 1.3 has the highest average accuracy value in this experiment with a value of 74%. This is also affected by the displacement of the testing and training data positions during the experiment. The difference in the average value of accuracy can be seen in Picture 5 below.
Average Accuracy Score
76%
The results of testing the best parameters for PSO and FKNN will be used as parameter values for PSO-FKNN to obtain optimal parameter values for liver disease classification so as to get the best accuracy results for classifying liver disease. Based on the test results obtained, the best value of the parameter w is 0.5, c1 is 0.7 and the value of c2 is 1.3. Furthermore, the best combination of parameters for FKNN is when k = 18 and m = 2. The test to compare the accuracy values of the PSO-FKNN and FKNN hybrid methods is carried out with 5 test scenarios where each test scenario is carried out 10 times with 100 iterations, training data and testing on each test will change its position. The results of the comparison of the average accuracy of the PSO-FKNN hybrid method with FKNN can be seen in table 10 below.
Table 10 Comparison of Accuracy Results of PSO-FKNN and FKNN Hybrid Methods
|
NO. |
Used Methods | |
|
FKNN |
PSO-FKNN | |
|
1. |
68.29% |
74% |
|
2. |
66.74% |
71% |
|
3. |
66.57% |
66% |
|
4. |
67.53% |
73% |
|
5. |
64.90% |
72% |
|
Average |
66.80% |
71.2% |
Based on table 10, shows that the average results obtained from the overall PSO-FKNN hybrid method experiment were 4.4% higher which got an average accuracy value of 71.2% compared to FKNN which only got 66.80% accuracy. The highest accuracy value obtained by the PSO-FKNN hybrid method is 74% and the lowest accuracy value is 66%. Changes in accuracy are also obtained due to changes in the position of the training and testing data on each test while the highest accuracy value for FKNN is 68.29% and the lowest accuracy is 64.90 % this is also due to the displacement of the training and testing data positions in each test.
In the research that has been done, the conclusions obtained are as follows.
-
1. The effect of the PSO parameter on the results of liver disease classification is when the
value of w 0.5 has the highest average accuracy value, the value of C1 0.7 has the highest average accuracy value, indicating that the value of C2 1.3 has the highest average accuracy value, The effect of the FKNN parameter is also obtained when the K value is 18 and the M value is 2 in this experiment resulting in the best accuracy.
-
2. The PSO-FKNN hybrid method for weight optimization of FKNN can increase the accuracy
of the FKNN classification process. This is shown in the comparison of the accuracy of FKNN compared to the PSO-FKNN hybrid method, which increased by 4.4 (in percent) for the average accuracy of the PSO-FKNN hybrid method. By using the PSO-FKNN hybrid method, there is an increase in accuracy for the classification of liver disease when compared to the classification of liver disease using the FKNN method.
-
3. The accuracy range value obtained by the PSO-FKNN hybrid method is 66 to 74 (in
percent) compared to the FKNN accuracy value range is 64.90 to 68.29 (in percent), the difference in the accuracy value obtained by PSO-FKNN is influenced by changes in data-position training and testing in each test. The final result of the accumulated average value of the PSO-FKNN hybrid method is 71.2% and for FKNN is 66.80%, so the increase obtained is 4.4% after using PSO.
References
-
[1] Rahmawati, E. (2015). Analisa Komparasi Algoritma Naïve Bayes dan C4.5 Untuk
Prediksi Penyakit Liver. Jurnal Techno Nusa Mandiri.
-
[2] Satria Dwi Nugraha, R. R. (2017). Penerapan Fuzzy K-Nearest Neighbor (FK-NN) Dalam
Menentukan Status Gizi Balita. Jurnal Pengembangan Teknologi Informasi dan Ilmu Komputer, hlm. 925-932, 8.
-
[3] Rimbun Siringoringo, R. P.-a. (2017). Hibridisasi Metode Fuzzy K-Nearest Neighbor
Dengan Metode Modified Particle Swarm Optimization Pada Pengklasifikasian Penyakit Tanaman Kedelai. Jurnal & Penelitian Teknik Informatika.
-
[4] Wildan Gita Akbari, N. H. (2019). Diagnosis Penyakit Cabai Menggunakan Metode Fuzzy
K-Nearest Neighbor (FKNN). Jurnal Pengembangan Teknologi Informasi dan Ilmu Komputer, hlm. 1070-1074.
-
[5] Wafiyah, F., Hidayat, N., & Perdana, R. S. (2017). Implementasi Algoritma Modified K-
Nearest Neighbor (MKNN) untuk Klasifikasi Penyakit Demam. Jurnal Pengembangan Teknologi Informasi dan Ilmu Komputer, 1210-1219.
-
[6] Dizka Maryam Febri Shanti, N. H. (2018). Implementasi Metode F-KNN (Fuzzy K-Nearest
Neighbor) Untuk Diagnosis Penyakit Anjing. Jurnal Pengembangan Teknologi Informasi dan Ilmu Komputer, hlm. 7401-7407.
-
[7] Yunus, W. (2018). Algoritma K-Nearest Neighbor Berbasis Particle Swarm Optimization
Untuk Prediksi Penyakit Ginjal Kronik. Jurnal Teknik Elektro CosPhi.
-
[8] Darnisa Azzahra Nasution, H. H. (2019). Perbandingan Normalisasi Data Untuk
Klasifikasi Wine Menggunakan Algoritma K-NN. CESS (Journal of Computer Engineering System and Science).
644
Discussion and feedback