Implementation of Natural Feature Tracking in Eclipse Applications Using Augmented Reality
on
p-ISSN: 2301-5373
e-ISSN: 2654-5101
Jurnal Elektronik Ilmu Komputer Udayana
Volume 11, No 3. February 2023
Solar Eclipse Augmented Reality Application Using Natural Feature Tracking Method
Diky Rizky Awana1, Agus Muliantaraa2, I Gede Arta Wibawaa3, Cokorda Rai Adi Pramarthaa4, Ida Bagus Gede Dwidasmaraa5, I Putu Gede Hendra Suputraa6
aInformatics Department, Faculty of Mathematics and Natural Sciences, Udayana University South Kuta, Badung, Bali, Indonesia 1dikyrizkyawan@gmail.com
2muliantara@unud.ac.id 3gede.arta@unud.ac.id 4cokorda@unud.ac.id 5dwidasmara@unud.ac.id 6hendra.suputra@unud.ac.id
Abstract
An eclipse is a phenomenon that occurs when a celestial body moves into the shadow of another celestial body, be it a solar eclipse or a lunar eclipse. In the process of understanding this phenomenon, people do not understand what is meant by the eclipse phenomenon. Because of this, we need a teaching aid to help us understand the material.
The application will apply Augmented Reality technology using the Natural Feature Tracking (NFT) method. The application in this research will be made in the form of a native website. With python 3.7.0 64-bit programming language using the IDE (integrated development engineer), namely Visual Studio Code. This application will take advantage of the flask frameworks. This website will be native. Application implementation using native website templates with HTML (Hypertext Markup Language), CSS (Cascading Style Sheets), and Javascript. This application will be intended for a platform website resolution of 16:9 with a breakdown of 1920 x 1080 pixels. However, this ratio will be able to adjust because it applies the bootstrap 4 framework. From some tests conducted, the percentage of accuracy of the percentage of 3D object appearance is 52% on objects performing in the correct position, 34% on objects performing in the wrong position, and 10.67% on objects not appearing. In terms of functions, it has been running and meets the requirements with black box testing with 100% accuracy which is carried out based on 9 functions in the use case diagram.
Keywords: Solar Eclipse, Augmented Reality, Natural Feature Tracking
An eclipse is a phenomenon that occurs when a space object moves into the shadow of another space object, including a solar eclipse or lunar eclipse [1]. A solar eclipse is a phenomenon when the moon is right between the sun and the earth so that the moon blocks the sun's rays from reaching the earth causing the sun not visible from the earth because it is covered by the moon's shadow [2].
In the process of understanding this phenomenon, people do not understand what is meant by the eclipse phenomenon because the eclipse is a fairly rare phenomenon because the frequency of eclipses with identical configurations is quite long repeatedly using the Saros cycle period which will occur every 18 years and 10 days [3]. And in his explanation in the book, only contains theories and images that can only be seen in two dimensions. Because of this, people tend to feel bored quickly and less interested so they have difficulty in understanding and reduce interest in learning about the eclipse phenomenon. Because of this, we need a prop to help in understanding the material.
Augmented Reality (AR) is the combination of real and virtual objects or two-dimensional or threedimensional virtual in a real environment that runs interactively in real-time, where the virtual objects are integrated into the real world [4]. Natural Feature Tracking (NFT) is one of the image tracking methods to detect and track features naturally in images from angles, lines, or blobs [5].
NFT itself has many algorithms in its application such as the SIFT algorithm, SURF, ORB, BRISK, and others. This study uses the ORB algorithm because the ORB algorithm is a binary descriptor algorithm that is fast and has high resistance in feature detection so it is suitable for applying to AR applications [6].
The merging of real and virtual objects is possible with the appropriate display technology, interactivity is possible through certain input devices, and good integration requires effective tracking. AR allows users to see the real world equipped with virtual objects that are combined with the real world. AR plays a role in complementing reality rather than completely replacing it. This helps users bring up the desired objects as if the virtual and real objects coexist in the same space [4].
The initial process of NFTs is to rely on a Point of Interest (POI), where objects visible in the environment can be applied directly to detect the feature [7]. After going through the detection process, a feature description will be carried out which gets results in the form of floating-point or binary-based vectors, then continued by matching features that match the image in the database which aims to extract every six degrees of freedom (6DoF) pose which is used as a reference in the freedom of movement of an object. Then, a feature matching process is carried out where the two descriptors on the image will be matched. The matching of each camera frame must be calculated by the descriptor. If a sufficient connection is found between the features in the database and the camera frame, then the pose of the 6DoF camera can be calculated as well as determine the position of the visual object in the real environment.
The detection feature is used to search for and identify objects in the image [8]. Feature detection must meet several requirements including fast computational time, stability of changing lighting conditions, and image defocusing, stability to observations from different points of view and invariant scale [7]. The ORB algorithm for feature detection uses an application based on the FAST corner detection algorithm with the initial image that has been converted to grayscale. Here is the flow of the feature detection process in the FAST algorithm. It first determines the p point on the image with the starting position (x,y) and the threshold value [9]. Then determine the radius of 3 pixels from point p so that 16 pixel points are obtained. Next, determine the location of 4 points of 16 pixels. The first point on the coordinates (xp, yp+3), the second point on the coordinates (xp+3, yp), the third point on the coordinates (xp, yp-3), and the fourth point on the coordinates (xp-3, yp). It then compares the intensity of the center point p with the reference of the previous four points for up to 16-pixels. The center point p is the angular point when there are at least 3 points without normal intensity. These categories include as in equation (1).
!Dark, lp → x ≤ lp — t
Normal, lp — t < lp → x <lp + t........................................................................(1)
Light, lp + t ≤ lp → x
Where :
Sp→ : Intensity of the center point (p point)
Ip→ : Pixel intensity x (neighbor intensity point)
t : threshold
The descriptor aims to describe a region around a key point to generate a description vector because the descriptor describes each detected feature as a vector of a fixed length [6]. The ORB algorithm uses the basis of the improved BRIEF algorithm to calculate the descriptor for each point and the descriptor vector consists of the numbers 0 and 1 because the algorithm is of binary type. To increase the resistance to digital noise, gaussian filtering was first carried out on the image. The binary test can be formulated as in equation (2).
= { 1,p(χ)<p(y) (7λ
-
τ (;,) lθ,p(χ)≥p(y)(2)
Where (x) is the gray value in the x plane around the image feature point, and (y) is the gray value in the y plane around the image feature point. Then, determine a patch with a size of S × S and randomly select N which usually amounts to 256. Then, the brightness value of each pair of points is compared according to the equation and binary assignment. Obtained an N-dimensional vector consisting of a binary string N as in equation (3).
f N(P) = ∑ι≤i≤N 2i-1 τ (PWi).....................................................................................................................................(3)
Where fN (p) is an N-dimensional vector that stores binary values from patches that are 2i-1 in size. The ORB algorithm uses the Steer BRIEF algorithm to calculate the main direction of each feature point because the BRIEF descriptor has no invariants to the rotation, causing easy data loss when the image is rotated.
The feature point-based matching method is the main method for image matching because of its simple, fast, high-accuracy calculations, and has invariants to grayscale scales, lighting, and graphic distortions [10]. Feature matching is performed to determine which characteristics are represented in the descriptor of the two images according to the criteria that can be matched using a brute-force matcher.
The data used in this study is divided into two types, namely image data and virtual object data. There are two kinds of reference imagery data, namely those obtained from camera photos and camera frames in real-time. Virtual object data is component data from an eclipse that is used as a reference in making 3D modeling objects. This data is obtained through books and library sources. That is solar eclipse data which is when the eclipse has a sun-moon-earth configuration on one straight line and a total solar eclipse is when the solar eclipse and the entire sun are covered by the moon.
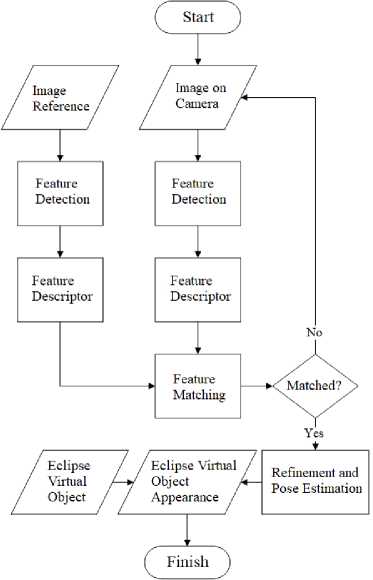
First, the image on the camera and the reference image is inputted, followed by the feature detection process for both images. Then after the image is detected the feature is continued with the feature description process. Then, the two features are matched and when the two features match, it is continued by estimating the image pose. Then proceed with the process of displaying virtual objects in a real environment. If the two features do not match then the process will be repeated on the camera image. The process flow can be seen in figure 1.

Figure 1 Flowchart
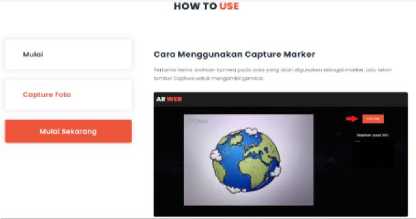
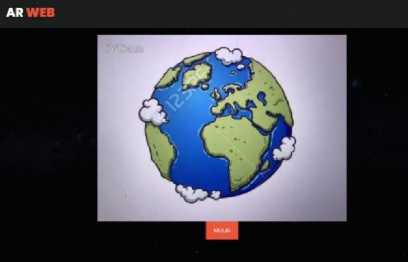
This interface design was created using Adobe Illustrator CC 2017 as a design maker or application design framework and implemented in the form of a native website. This design implementation uses a native website template with HTML (Hypertext Markup Language), CSS (Cascading Style Sheets), and Javascript. This design is intended for website platforms with a resolution of 16:9 with a resolution of 1920 x 1080 pixels. This interface design consists of 5 pages, namely the home page that can be seen in figure 2, how to use that can be seen in figure 3, about that can be seen in figure 4, new marker that can be seen in figure 5, and AR that can be seen in figure 6.

Figure 3 Home Page

Figure 2 How to Use

Figure 5 About

Figure 4 New Marker

Figure 6 Augmented Reality
This test, it was carried out at a distance of 10 cm, 12 cm, 14 cm, and 16 cm. Tests are performed with a range of 30 frames on each test which in each frame will be counted as points. Then the points of the number of successful tests will be totaled and divided by the total number of tests and the result will be multiplied by 100%.
Table 1 Distance Aspect Virtual Object Testing Results
|
No |
Result |
Distance |
Total Point |
Percentage | ||||
|
8 cm |
10 cm |
12 cm |
14 cm |
16 cm | ||||
|
1 |
The object appears correctly positioned |
30 |
29 |
15 |
4 |
0 |
78 |
52% |
|
2 |
The object appears incorrectly positioned |
0 |
1 |
15 |
21 |
14 |
51 |
34% |
|
3 |
Object not displaying |
0 |
0 |
0 |
0 |
16 |
16 |
10.67% |
In table 1, it can be seen that the farther the distance, the more likely the accuracy of the object decreases. Testing the objects of this system produced quite good results, judging from the 3D objects that continue to appear at close range, although at long distances they get quite poor results. All points are summed up and divided by the overall test amount and multiplied by 100%. Testing for objects to perform correctly positioned earned a percentage of 52%. Meanwhile, testing for objects to appear incorrectly positioned got a percentage of 34%. The last test for non-performing objects got a percentage of 10.67%.
Figure 7 Virtual Object Testing Graph
VIRTUAL OBJECT TESTING
40
30
20
10
0
30 29
15 15 21 14 16
40 01 0000
The object appears correctly positioned
Object appears Object not displaying
incorrectly positioned
■ 8 cm ■ 10 cm 12 cm ■ 14 cm ■ 16 cm
This test will be carried out by testing the 9 functions already described in the use case diagram. This test will be performed on several people and each test will be recorded Test Results obtained from each function tried, whether it has been successful or not. Black box testing of this system can be seen in table 2.
Table 2 Black Box Testing
|
No |
Use Case Function |
Description |
Result |
|
1 |
Running NFTs with the ORB algorithm |
It is the main process of the system which is to apply the ORB method In the NFT process series. This process is used to apply Augmented Reality technology |
True |
|
2 |
View the Home page |
It is a process of displaying the home that will appear when the application first runs which has 3 main buttons, namely How to Use, About, Start |
True |
|
3 |
Display the How To use page |
It is a process of displaying a How to use page that contains the steps to use the application so that users do not have difficulties. |
True |
|
4 |
Display the About page |
It is a process of displaying an about page containing an application description and author biodata |
True |
|
5 |
Displaying 3D objects |
Is the process of displaying 3D objects above a predetermined target as an application of Augmented Reality |
True |
|
6 |
Displays marker turnover |
It is the process of displaying the marker substitution page that was used when the first start process appeared |
True |
|
7 |
View an AR page |
It is the process of displaying a page that is used to turn on the camera and display 3D objects |
True |
|
8 |
Turning on the Camera |
It is the process of turning on the camera so that it can be used to see the target and make 3D objects appear in Real-Time |
True |
|
9 |
Retrieving and storing markers |
Is a process to retrieve marker data entered by the user. Then the marker is saved as a new marker by the system |
True |
The results of the black box testing of this system are very satisfactory. This can be seen from each function that the 9 functions in the use case diagram can fit all. It can be concluded that this black box test was successful with 100% accuracy.
From the research that has been carried out, several conclusions can be drawn as follows:
-
1. From virtual object testing, it can be seen that the farther the distance, the more likely the accuracy of the object decreases. Testing the objects of this system produced quite good results, judging from the 3D objects that continue to appear at close range, although at long distances they get quite poor results. Testing for objects to perform correctly positioned earned a percentage of 52%. Meanwhile, testing for objects to appear incorrectly positioned got a percentage of 34%. The last test for non-performing objects got a percentage of 10.67%.
-
2. From the black box test, it can be concluded that it gets 100% accuracy because the overall functional features of the application tested through the application can run as expected. Features tested according to the features described in the 9-feature Use Case diagram.
References
-
[1] Sulaiman, R. (2017). Gerhana dan Keharusan Kosmologis Manusia: Tinjauan Filsafat Wujud. Jurnal Kependidikan Dan Sosial Keagamaan.
-
[2] Khazin, M. (2004). Ilmu Falak Dalam Teori dan Praktek. Yogyakarta: Buana Pustaka.
-
[3] Siregar, S. (2017). Fisika Tata Surya.
-
[4] Azuma, R. T. (1997). A Survey of Augmented Reality. Malibu: Hughes Research Laboratories.
-
[5] Ćuković, S., Gattullo, M., Pankratz, F., & Devedžić, G. (2015). Marker Based vs. Natural Feature Tracking Augmented Reality Visualization of the 3D Foot Phantom.
-
[6] Hamidia, M., Zenati-Henda, N., Belghit, H., & Bellarbi, A. (2015). Object Recognition Based on ORB Descriptor for Markerless Augmented Reality. 9ème Conférence sur le Génie Electrique.
-
[7] Carmigniani, J., & Furht, B. (2011). Handbook Of Augmented Reality. Florida: Springer-Verlag New York.
-
[8] Jakubovic, A., & Velagic, J. (2018). Image Feature Matching and Object Detection Using BruteForce Matchers. Conference: 2018 International Symposium ELMAR. Zadar: Institute of Electrical and Electronics Engineers ( IEEE ).
-
[9] Wahyudi, N., Harianto, R. A., & Endang Setyati, D. I. (2019). Augmented Reality Marker Based Tracking Visualisasi Drawing 2D ke dalam Bentuk 3D dengan Metode FAST Corner Detection. Journal of Intelligent Systems and Computation.
-
[10] Luo, C., Yang, W., Huang, P., & Zhou, J. (2019). Overview of Image Matching Based on ORB Algorithm. ICSP 2019. Weihai: IOP Publishing
This page is intentionally left blank.
652
Discussion and feedback