Analysis of Medical Image Resizing Using Bicubic Interpolation Algorithm
on
p-ISSN: 1979-5661
e-ISSN: 2622-321X
Jurnal Ilmu Komputer VOL. 14 No. 2
Analysis of Medical Image Resizing Using Bicubic Interpolation Algorithm
Bambang Krismono Triwijoyoa1, Ahmat Adila2
aDepartment of Computer Science, Bumigora University
Jl. Ismail Marzuki Mataram, Indonesia
1bkrismono@universitasbumigora.ac.id
2ahmat.adil@universitasbumigora.ac.id
Abstract
Image interpolation is the most basic requirement for many image processing tasks such as medical image processing. Image interpolation is a technique used in resizing an image. To change the image size, each pixel in the new image must be remapped to a location in the old image to calculate the new pixel value. There are many algorithms available for determining the new pixel value, most of which involve some form of interpolation between the closest pixels in the old image. In this paper, we use the Bicubic interpolation algorithm to change the size of medical images from the Messidor dataset and then analyze it by measuring it using three parameters Mean Square Error (MSE), Root Mean Squared Error (RMSE), and Peak Signal-to-Noise Ratio (PSNR), and compare the results with Bilinear and Nearest-neighbor algorithms. The results showed that the Bicubic algorithm is better than Bilinear and Nearest-neighbor and the larger the image dimensions are resized, the higher the degree of similarity to the original image, but the level of computation complexity also increases.
Keywords: Image Interpolation, image resizing, bicubic Interpolation,
Image interpolation is a term used for image processing but is often used with different terminology in literature such as image scaling, and image resizing. There are many algorithms currently used to resize digital images. Most reproduce visually appealing replicas of the original. As technology requires a smaller display area to be viewable on multiple devices, the image size is generally lowered to produce thumbnails. Enlarge the image generally for viewing on a large screen monitor or television [1] as well as the face detection system based on facial images from CCTV cameras[2]. When enlarging an image, it is impossible to find more information about the image than there is already, and the image quality is poor. However, there are several methods for increasing the number of pixels contained in an image, which can be created from the original pixels. This method is often referred to as an image interpolation algorithm.
There are various algorithms currently used to interpolate digital images. Some of the common interpolation algorithms are bicubic, bilinear, and nearest neighbor [3]. This algorithm uses a high-order interpolator which takes into account more pixels around it, thus requiring more computation time. The interpolation method retains most of the image details after interpolation and is very useful for correcting distorted images.
In this paper, there are three interpolation algorithms, namely bicubic, bilinear, and nearestneighbor interpolation to change the size of medical images and analyze the resizing results using parameters Mean Square Error (MSE), Root Mean Squared Error (RMSE), and Peak Signal-to-Noise Ratio (PSNR).
Digital image interpolation is the process of generating a continuous intensity surface from a sample of discrete image data. There are many types of interpolation methods, each producing a different look to the final image. So, it is best if the quality, or the difference seen for each pixel, is maintained during the interpolation function [4].
In general, almost every geometric transformation such as translating, rotating, scaling, and warping requires interpolation to be carried out on an image. Such transformations are essential for commercial digital image processing software. The interpolated image quality is affected by several problems such as edge sharpness, freedom from artifacts, and high-frequency detail reconstruction [5].
The interpolation function is performed by convolutional operations which involve many additions and multiplication operations. Therefore, it is necessary to consider the computational complexity and image quality of the interpolated results [6]. The various interpolation algorithms discussed in this paper are Bicubic, Bilinear, and Nearest-neighbor.
The Bicubic interpolation method considers the known 4x4 neighboring pixels totaling 16 pixels. Closer pixels are given a higher weight in calculations and are the ideal combination of processing time and output quality. For this reason, this method is standard in many image editing programs including Adobe Photoshop, printer drivers, and in-camera interpolation [7].
Bilinear interpolation takes the weighted average of the four nearest neighboring pixels to compute the final interpolation value. The result is an image that is much smoother than the original image. When all known pixel distances are equal, the interpolation value is divided by four. This technique interpolates in both directions, horizontally and vertically [8].
The nearest neighbor method is the simplest method and requires the least processing time of all interpolation algorithms. The nearest neighbor selects the closest pixel value by rounding the coordinates of the desired interpolation point. Using this method one finds the closest suitable pixel in the source (original) image for each pixel in the destination image [9]. The new pixel is made equal to the other closest pixels. The pixels or dots of color are duplicated to create new pixels as the image grows. It creates pixels or edges that break the curve into steps or jagged edges. This form of interpolation produces the usually unacceptable effect of zooming in and out of an image [10].
This study, using input data from MESSIDOR (Methods to evaluate segmentation and indexing techniques in the field of retinal ophthalmology) [11]. Messidor is a research program funded by the French Ministry of Research and Defense within a 2004 TECHNO-VISION program. Messidor is an open-access database that can be used for research and educational purposes. Messidor database consists of 1200 eye fundus color digital images of the posterior pole, which were acquired by three ophthalmologic departments, using a color video 3CCD camera on a Topcon TRC NW6 non-mydriatic retina graph with a 45 degrees field of view. The images are saved in uncompressed TIFF format there is three kinds of image sizes at 1440x960, 2240x1488, or 2304x1536 pixels resolution. The fundus is part of the visual system, which is located at the back of the eye. The fundus camera is a device with special abilities that functions for fundus photographs, which can visualize the central part of the retina, macula, and optic disk. Data samples in the form of color retinal images with the RGB format (Red, Green, Blue) form a 3-
dimensional structure of 256 x 256 x 3 pixels. The RGB format was chosen because it retains original image information and in the absence of compression methods, making it easy to process.
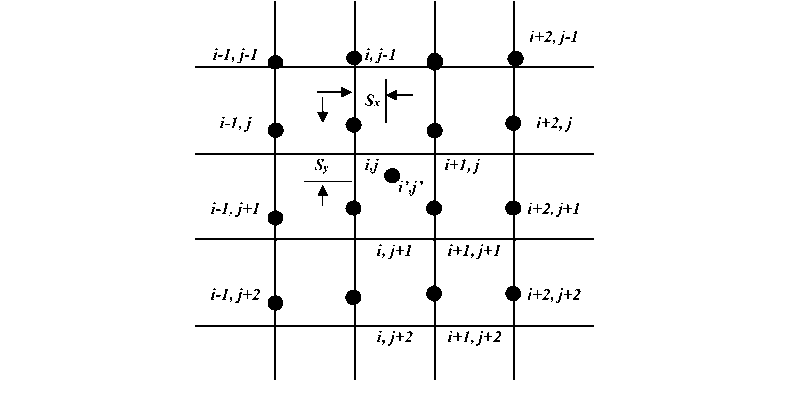
The original input image is resized to 256 x 256 x 3 size. The image size of 256 x 256 x 3 pixels chosen to reduce the complexity of the original image size. This input data format was obtained through the image resizing process using bicubic interpolation [12]. This method is selected because the result is finer at the edges than the bilinear interpolation. Bicubic is an ideal combination of process time and quality output. The bicubic interpolation uses a distance of 16 neighboring pixels (4x4) as sampling (S) to estimate the pixels in the (i', j') positions, as illustrated in Figure 1.

Figure 1. Sampling Interpolasi Bicubic at Position (i’, j’)
Bicubic Interpolation is calculated using equation 3.1. until 3.5. as follows:
fu = [w-1(Sy)Wo(Sy)W1(^^
|
fi-ι,j-ι |
fι,j-1 |
ft + 1,j-1 |
fi + 2,j-1^ |
\ W-1 |
(Sx)↑ |
|
f-1,] |
fi,J |
fi+1,j |
fi+2,j j |
Wo |
(Sx) |
|
fi-ιj+ι |
fl,j + 1 |
fι+1,j+1 |
fl + 2,j+1 |
W1 |
(Sx) |
|
-fi-1,j + 2 |
fι,j+2 |
fi+1,j + 2 |
fl+2,j+2- |
LW2 |
(Sx)J |
(1)
Where:
Sy = j’ – j, Sx = i’ - i
fi,j = pixel value at position (i, j)
3-C2
Figure 2 is an algorithm of image resizing using the bicubic interpolation method:
Input: Original Image
Output: Resized Image
-
1: For x = 1 to image width in pixels
-
2: For y = 1 to image height in pixels
Arrange augmented y matrix using equation 6.
3:
4:
5:
6:
7:
8:
9:
I1 Iy1 yi2 yħ
i y y2 y2
1 y≡ y2 y∣
1 Ly4 yl yl∖
pi}
P2 p3 - Pl-1
Apply the Gauss Jordan elimination method using equation 7. p = a0 + a1y + a2y2 + a3y3
Enter the y value of the pixels to searched equation 7
Arrange augmented x matrix using equation 8.
[ 1] ∣X
1 lχ3
L 1-∣ [Xl
xl X22 χ32 xl
x3l rPi] x23L P2
X33I H
3 ⅛l∣
Xl
Apply the Gauss Jordan elimination method using equation 9. p = a0 + a1x + a2x2 + a3x3
Enter the x value of the pixels to searched equation 9
(6)
(7)
(8)
(9)
10: End
-
11: Perform rounding on each pixel value
Figure 2. Algorithm 1. Resizing The Image Using Bicubic Interpolation.
To analyze the results of the resizing process used by three parameters, the Mean Square Error (MSE), Root Mean Squared Error (RMSE), and Peak Signal-to-Noise Ratio (PSNR) to measure the similarity between two images [13]. These parameters are used to compare the results of resizing the image with the initial image or original image. MSE and RMSE do not have unit values while PSNR is had decibels (dB) as a unit value, more similar between two images, then MSE and RMSE values are getting closer to zero. Whereas in PSNR, two images have a low level of similarity if the PSNR value is below 30 dB. To calculate the three parameters using equation 10 until 12 as follows:
MSE = ^^^[/a j') -g(i, j)]2
RMSE = √MSE
(10)
(11)
PSNR =10
2552
^10 MSE
(12)
where m is the image height, n is the image width, f(i, j) is the original image, and g(i, j) is the resizing image. The result of resizing 20 images from 1380x1380 pixels to 1024x1024 pixels using the bicubic interpolation method was measured based on the MSE, RMSE, and PSNR values and compared with the other two bilinear interpolation methods and the nearest neighbor interpolation method.
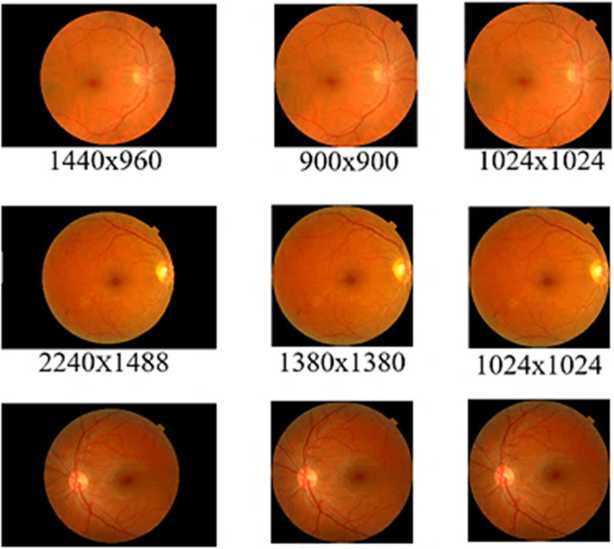
There are three kinds of resolution sizes from 20 input images, 1440 x 960 pixels, 2240 x 1488 pixels, and 2304 x 1536 pixels. Resizing input images is needed to reduce the complexity of input data. In this study, all input images were resized to 1024 x 1024 using Bicubic Interpolation. In the following paragraphs, the implementation code of the bicubic interpolation resizing algorithm. First, crop the original image to remove the left and right parts of the background image, more focused on the retinal image, and to reduce the complexity of the image process. The cropping process changes the original image size from 1440x960 pixels to 900x900 pixels, from 2240x1488 pixels to 1380x1380 pixels, and from 2304x1536 pixels to 1452x1452 pixels. After the cropping process, then the three sizes of cropped images are resizing to one dimension of 1024x1024 pixels.
Figure 3 shows an input image from the Messidor dataset in original size, cropped image, and resized image using a bicubic interpolation resizing algorithm. Figure 3 (a) shows the original image from the Messidor dataset. There are three image sizes of 1440x960, 2240x1488, and 2304x1536. Then figure 3 (b) shows the results of the cropping process to remove the black backgrounds on the right and left sides of the image while changing the width and height of the image to be the same so that the size is 900x900, 1380x1380, and 1452x1452. Figure 3 (c) shows the results of resizing the image to equalize three different image sizes into a uniform size of 1024x1024 pixels.

2304x1536 1452x1452 1024x1024
(a) (b) (c)
Figure 3. (a) Original Images, (b) Cropped Images, (c) Resized Images
Table 1. Shows the results of measuring the image resizing process using the bicubic interpolation of 20 color images, for each color channel Red (R), Green (G), and Blue (B) calculated MSE, RMSE, and PSNR indicators and averages (AVG) for all channels color. The calculation results of 20 color images from the Messidor database has been obtained. The average MSE value for the red channel is 0.706871, for the green channel is 0.646374, for the blue channel is 0.75686, and the MSE average of all channels is 0.703369.
Table 1. Measurement Results of Image Resizing Uses The Bicubic Interpolation Method
|
Im g |
MSE MSE MSE MSE RMS RMS RMS RMSE PSNR PSNR PSNR PSNR (R) (G) (B) AVG E (R) E (G) E (B) AVG (R) (G) (B) AVG |
|
1 |
1.415 1.288 1.507 1.403 1.189 1.135 1.227 1.1841 46.656 47.064 46.382 46.701 375 405 250 677 695 079 701 59 08 27 95 10 |
|
2 |
0.400 0.359 0.408 0.389 0.633 0.599 0.639 0.6240 52.135 52.607 52.049 52.264 840 535 816 730 119 612 387 40 09 39 52 00 |
|
3 |
1.011 0.879 1.059 0.983 1.005 0.938 1.029 0.9910 48.116 48.720 47.912 48.249 253 849 904 669 611 003 516 43 20 72 13 68 |
|
4 |
0.854 0.888 1.045 0.929 0.924 0.942 1.022 0.9632 48.845 48.678 47.971 48.498 892 352 635 626 604 524 563 30 68 95 00 54 |
|
5 |
0.878 0.902 1.056 0.945 0.937 0.949 1.027 0.9716 48.726 48.612 47.927 48.422 629 025 194 616 352 750 713 05 74 61 36 24 |
|
6 |
0.417 0.383 0.433 0.411 0.646 0.618 0.658 0.6412 51.955 52.332 51.792 52.026 796 007 728 510 371 876 580 76 16 73 63 84 |
|
7 |
0.413 0.372 0.425 0.403 0.642 0.610 0.652 0.6351 52.001 52.451 51.878 52.110 395 707 194 765 958 497 069 75 14 13 93 40 |
|
8 |
0.411 0.375 0.425 0.404 0.641 0.612 0.652 0.6356 52.020 52.416 51.873 52.103 542 713 749 335 516 954 494 55 66 24 27 39 |
|
9 |
0.419 0.385 0.435 0.413 0.647 0.620 0.660 0.6428 51.937 52.309 51.769 52.005 546 057 997 533 724 529 301 51 01 55 96 51 |
|
10 |
0.877 0.782 0.930 0.863 0.936 0.884 0.964 0.9284 48.734 49.232 48.479 48.815 098 021 122 080 535 319 428 28 32 62 40 45 |
|
11 |
0.879 0.784 0.924 0.862 0.937 0.885 0.961 0.9283 48.724 49.218 48.503 48.815 056 515 932 834 580 729 734 47 63 78 70 71 |
|
12 |
0.405 0.370 0.421 0.399 0.636 0.608 0.649 0.6315 52.084 52.476 51.918 52.159 582 573 335 164 853 747 103 68 01 06 52 53 |
|
13 |
0.401 0.365 0.414 0.393 0.633 0.604 0.644 0.6274 52.126 52.537 51.986 52.216 645 346 830 940 754 438 073 22 38 76 10 75 |
|
14 |
0.398 0.358 0.417 0.391 0.631 0.598 0.646 0.6254 52.161 52.619 51.954 52.245 395 503 813 570 185 751 385 4 66 87 98 51 |
|
15 |
0.414 0.377 0.431 0.407 0.643 0.614 0.657 0.6384 51.990 52.395 51.811 52.065 368 524 897 930 714 43 188 44 93 36 00 76 |
|
16 |
1.446 1.306 1.546 1.433 1.202 1.142 1.243 1.1964 46.560 47.004 46.271 46.612 954 226 468 216 894 902 571 56 25 62 39 09 |
|
17 |
0.851 0.758 0.914 0.841 0.922 0.871 0.956 0.9167 48.861 49.363 48.552 48.925 716 841 649 735 885 115 373 91 85 29 26 80 |
|
18 |
0.890 0.789 0.934 0.871 0.943 0.888 0.966 0.9329 48.667 49.191 48.460 48.773 620 465 090 392 727 518 483 09 87 47 91 42 |
|
19 |
0.665 0.593 0.693 0.650 0.815 0.770 0.832 0.8062 49.933 50.433 49.754 50.040 396 105 472 658 718 133 750 00 99 48 51 66 |
|
20 |
0.683 0.606 0.709 0.666 0.826 0.778 0.842 0.8158 49.818 50.334 49.657 49.937 327 714 133 391 636 919 100 85 52 96 53 00 |
|
Av g |
0.706 0.646 0.756 0.703 0.820 0.783 0.846 0.8168 50.102 50.500 49.845 50.149 871 374 860 369 022 791 726 46 91 09 40 47 |
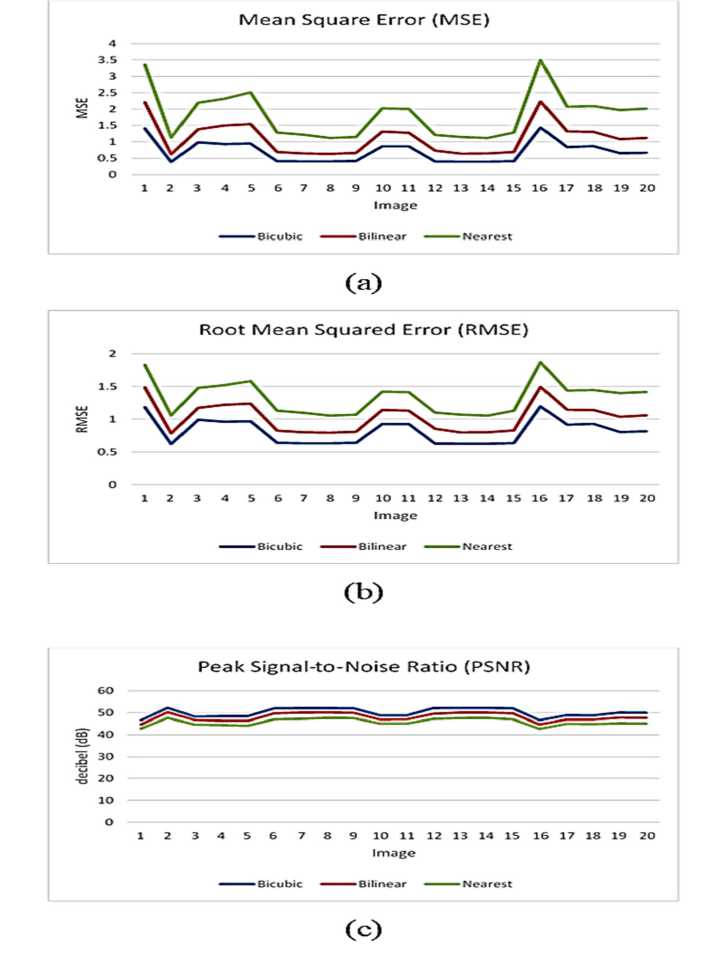
Figure 4 shows a graph of (a) Mean Square Error (MSE), (b) Root Mean Squared Error (RMSE), and (c) Peak Signal-to-Noise Ratio (PSNR) of 20 images. The blue line is the value MSE from the resizing process using the bicubic interpolation method, the orange color line is the MSE value from the resizing result using the bilinear interpolation method, and the green color line is the MSE value from the resizing result using the nearest neighbor method. Based on the three graphs in figure 4, the bicubic interpolation method has the smallest error level for image resizing compared to the other two methods, bilinear interpolation, and nearest-neighbor interpolation.

Figure 4. The Value of (a) MSE, (b) RMSE, and (c) PSNR of 3 Methods of Image
Table 2 shows the average MSE value, the difference between bilinear interpolation and bicubic interpolation method is 0.4079402, the difference between the bicubic interpolation method and the nearest neighbor interpolation is 1.1331529. On the average RMSE value, the difference between the bicubic interpolation method and bilinear interpolation is 0.21283, the difference between the bicubic interpolation method and the nearest neighbor interpolation is 0.3010377. Whereas in the average PSNR value, the difference between the bicubic interpolation method and the bilinear interpolation method is -2.036891 dB and the difference between the bicubic interpolation and the nearest neighbor interpolation method is -4.309458.
Table 2. The Comparison of Three Resizing Methods
Img AVG MSE AVG RMSE AVG PSNR
Bicubic Bilinear Nearest Bicubic Bilinear Nearest Bicubic Bilinear Nearest
1 1.403677 0.8059487 1.9547068 1.184159 0.301988 0.3461743 46.70110 -1.975558 -3.795064
2 0.389730 0.2296074 0.7413119 0.624040 0.162343 0.2744503 52.26400 -2.005375 -4.590311
3 0.983669 0.4019058 1.2128898 0.991043 0.185369 0.3049173 48.24968 -1.490873 -3.493563
4 0.929626 0.5654474 1.3868259 0.963230 0.259268 0.2991764 48.49854 -2.077049 -3.978363
5 0.945616 0.5945904 1.5624762 0.971605 0.269234 0.3424178 48.42224 -2.130268 -4.246046
6 0.411510 0.2766394 0.8710738 0.641276 0.187954 0.3018655 52.02684 -2.232241 -4.920887
7 0.403765 0.2396569 0.8123945 0.635175 0.166638 0.2993258 52.11040 -2.023569 -4.769308
8 0.404335 0.2286862 0.7162258 0.635655 0.159547 0.2615503 52.10339 -1.943547 -4.403010
9 0.413533 0.2451334 0.7357309 0.642851 0.168279 0.2592482 52.00551 -2.017735 -4.417902
10 0.863080 0.4466805 1.1574013 0.928428 0.215375 0.2771476 48.81545 -1.812700 -3.699264
11 0.862834 0.4162830 1.1466124 0.928347 0.202138 0.2863876 48.81571 -1.712348 -3.673422
12 0.399164 0.3360404 0.8161617 0.631568 0.225864 0.2446610 52.15953 -2.658636 -4.836504
13 0.393940 0.2459119 0.7568650 0.627422 0.172370 0.2717054 52.21675 -2.110250 -4.641335
14 0.391570 0.2513219 0.7303810 0.625440 0.176180 0.2567653 52.24551 -2.158067 -4.566842
15 0.407930 0.2815349 0.8778774 0.638444 0.191813 0.3024558 52.06576 -2.284359 -4.973836
16 1.433216 0.7965692 2.0646900 1.196456 0.296307 0.3772475 46.61209 -1.924254 -3.882967
17 0.841735 0.4749181 1.2288910 0.916791 0.230226 0.2916622 48.92580 -1.949029 -3.918526
18 0.871392 0.4349321 1.2224564 0.932909 0.209539 0.3040186 48.77342 -1.761525 -3.811545
19 0.650658 0.4311360 1.3194653 0.806200 0.233232 0.3609993 50.04066 -2.206297 -4.781401
20 0.666391 0.4558605 1.3486206 0.815885 0.242931 0.3585785 49.93700 -2.264133 -4.789055
Averag 0.4079402 1.1331529 0.212830 0.3010377 -2.036891 -4.309458
e
From Table 2, it can conclude that the error rate of the bicubic interpolation method is lower than the bilinear interpolation method and the nearest neighbor interpolation for image resizing cases, so this research uses the bicubic interpolation method.
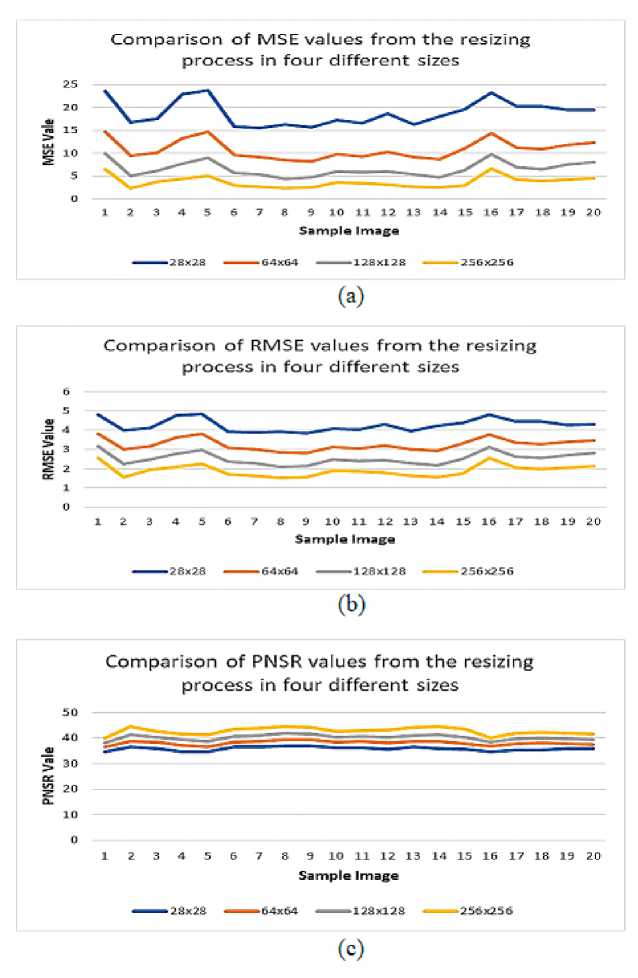
Determination of the input image size of 256 x 256 pixels, based on the measurement results of MSE, RMSE, and PNSR values from 20 color images of size 1380 x 1380 pixels, each resizing into 4 different sizes 28x28, 64x64, 128x128, and 256x256 using a bicubic interpolation method. Figure 5 (a) shows a graph of the Mean Square Error (MSE) results of resizing 20 image samples into 4 different image sizes using the bicubic interpolation method. The yellow line is the MSE value of 20 color images resizing into 256x256 pixels are best because the Mean Square Error (MSE) value is the smallest.
Figure 5 (b) shows the graph of the value of Root Mean Square Error (RMSE) results of resizing 20 color images into 4 different image sizes using the bicubic interpolation method. The yellow line is the RMSE value of 20 color images resizing into 256x256 pixels are best because the Root Mean Square Error (RMSE) value is the smallest. Whereas Figure 5 (c) shows a graph of Peak Signal-to-Noise Ratio (PSNR) results of resizing 20 color images into 4 different image sizes using
the bicubic interpolation method. The yellow line is the PNSR value of 20 image samples resized into a size of 256x256 pixels are best because the Root Mean Square Error (RMSE) value is the largest, meaning that the resized image has the highest level of similarity with the original image.

Figure 5. The Value of (a) MSE, (b) RMSE, and (c) PSNR of Image Resizing Into 4 Different Sizes Using Bicubic Interpolation Method
The conclusion of the research on image resizing analysis using the Bibubic interpolation method is that the results of the analysis of the experimental results show that first, the Bicubic interpolation method produces a much sharper image than the bilinear interpolation method and the closest neighbors. Second, The bicubic interpolation method has the smallest error rate for image resizing compared to the other two methods, namely bilinear interpolation, and nearest-
neighbor interpolation. Third, the larger the dimensions of the resized image, the higher the level of similarity to the original image, however, the level of computational complexity also increases.
References
-
[1] D. Vaquero, M. Turk, K. Pulli, M. Tico, and N. Gelfand, “A survey of image retargeting techniques”, SPIE Optical Engineering+ Applications, pp. 779814-779814, Aug. 2010.
-
[2] I.N.T.A. Putraa, and E.D. Krisnaa, “Implementasi Sistem Surveillance Berbasis Pengenalan Wajah pada STMIK STIKOM Indonesia”, Jurnal Ilmu Komputer, Vol. 8, No 2, pp. 65-72, 2015.
-
[3] R. C. Gonzalez, Digital image processing. Pearson Education India; 2009.
-
[4] V. Patel and K. Mistree, “A Review on Different Image Interpolation Techniques for Image Enhancement”, International Journal of Emerging Technology and Advanced Engineering, Vol. 3, pp. 129-13, Dec. 2013.
-
[5] S.D. Ruikar and D.D. Doye, “Image Denoising using Tri Nonlinear and Nearest Neighbour Interpolation with Wavelet Transform”, International Journal of Information Technology and Computer Science, Vol.4, pp. 36-44, Aug.2012.
-
[6] C. Singh, S. Singh, R. Saini, and A. K Saini, “A Comparative Analysis of Image Scaling Algorithms”. International Journal of Image, Graphics and Signal Processing, pp.55-62, April. 2013.
-
[7] P. S. Parsania and P. V. Virparia, “A Review: Image Interpolation Techniques for Image Scaling”, International Journal of Innovative Research in Computer and Communication Engineering, Vol. 2, Issue 12, pp. 7409-7413, Dec. 2014.
-
[8] A. Prajapati, S. Naik and S. Mehta, “Evaluation of Different Image Interpolation Algorithms”, International Journal of Computer Applications, Vol.58, Issue.1, pp. 6-12, Jan. 2012.
-
[9] P. Miklo., “Image interpolation techniques”, In 2nd SiberianHungarian Joint Symposium on Intelligent Systems. Oct. 2004.
[10]
. Patel and K. Mistree, “A Review on Different Image Interpolation Techniques for Image Enhancement”, International Journal of Emerging Technology and Advanced Engineering, Vol. 3, pp. 129-13, Dec. 2013.
-
[11] Messidor, “Methods to evaluate segmentation and indexing techniques in the field of retinal ophthalmology”. 2004, http://www.adcis.net/en/third-party/messidor/ , [Access Date: January 14, 2021].
-
[12] J. Titus and S. Geroge. “A comparison study on different interpolation methods based on satellite images”, International Journal of Engineering Research & Technology, Vol 2, Issue 6, pp. 82-85, 2013.
-
[13] H.S. Prashanth, H.L. Shashidhara, and B.M. KN. “Image scaling comparison using universal image quality index”. In 2009 International Conference on Advances in Computing, Control, and Telecommunication Technologies, Bangalore, India, 2009, pp. 859-863.
29
Discussion and feedback