Application of the K-Means Algorithm to Segmentation of Consumer Interest in Silver Craft 'Kreasi Slaka Bali'
on
p-ISSN: 2301-5373
e-ISSN: 2654-5101
Jurnal Elektronik Ilmu Komputer Udayana
Volume 9, No 4. May 2021
Application of the K-Means Algorithm to Segmentation of Consumer Interest in Silver Craft "Kreasi Slaka Bali"
I Gusti Ayu Widiantari Putria1, Ida Bagus Gede Dwidasmarab2
aInformatics Department, Udayana University Bali, Indonesia 1ayutari16@gmail.com 2dwidasmara@unud.ac.id
Abstract
Kreasi Slaka Bali is a company engaged in the silver handicraft sector. Each stage of the process is still done manually, starting from material preparation, handmade work, until making the packaging for delivery. Certainly, this requires more time to be able to produce an item of the same quality in each production. The need for extra time and business in product manufacturing, the company needs a marketing strategy that can be seen from consumer interest in the product. So this research discusses consumer interest based on transaction data by forming clusters based on purchases amount with other attributes, namely the product price, product size, product weight, and level of difficulty. The data used is transaction data for 2 transactions in 2019. The algorithm used is K-Means with the Elbow Method to determine the number of clusters. There are clusters of k = 3 with the cluster that has the most data in the first cluster (k = 0) with a total purchase of 326 products with an average price of US $ 62.579423.
Keywords: Silver, Consumer interest, Clustering, K-Means Algorithm, Elbow Method
Handicraft is a familiar activity in the community. This is because it can become a routine in carrying out a hobby as well as developing a marketable product. One of the handicrafts that are known especially in Bali, namely silver. Kreasi Slaka Bali is a company engaged in the silver handicraft sector and has been established since 2003. This company develops its product by taking the real concept of Balinese life so that all products have their own philosophy and make their own characteristics for the company. Product marketing is carried out locally and internationally, especially in the United States (US). The whole production process still using conventional methods, where the process starts with calculating the product to processing and creating packages for shipping products. This causes the need for extra time and also the stable ability of each worker. The need for qualified skills is useful to ensure that each product has the same good quality.
However, there are also failures in production, especially if the work is still carried out conventionally so that it requires precision and strategy at each stage of production in order to pay attention to the needs and demands of consumers. Not only that, in order to maintain quality, it is necessary to measure the right materials, and also when processing it requires process stability from both the craftsman and the supporting tools. The maintenance of each production process made this company known as having product with high selling value, in terms of quality. It's just that, there is a saying that there is a price for a product that can rightly make this company labeled a company that has a price that can be categorized as expensive compared to other companies.
The recognition of the company by the community makes them think about production and sales. As well known, the production process that still using conventional methods will certainly take a relatively longer time than done by machines or non-conventional ones. At times, this becomes an obstacle for companies in developing their business. Moreover, the production in this company can be categorized as having a high selling value, but not all levels of society can buy this product. Many people consider this product as a product that has a fairly heavy mass with a price category above average. Many think that the production conditions are the same as for other companies, so they are generalized
about the price and quality. Indeed, all people would want a lower price, but it does not rule out the price that is categorized as expensive cannot be sold because every product must have a supporting aspect in determining the price of an item and has a relationship with consumer interest. Therefore, the author want to discuss the segmentation of silver handicraft products which is a case study at the Slaka Bali Creation Company with data clustering so that the company is be able to find out the appropriate strategy in producing a product based on consumer interest.
That way the company is able to improve its performance and be able to increasingly compete competitively competitors in developing its business. This research is expected to facilitate the production of goods which will have an impact on the efficiency of time production and the effectiveness of materials production. In this study is using the K-Means algorithm which will form a data cluster so that consumer interest can be found based on the number of purchases with other attributes, namely quantity, product size, product weight, level of work complexity, and product price. Previously, the K-Means algorithm was used by Rony Setiawan to determine a new student promotion strategy which was a case study at the LP31 Jakarta Polytechnic. In his article, he used the CRISP-DM method with the implementation of the process using Rapid Miner 7.0 by producing a total of 4 clusters (k = 4). Based on the results of clustering, it is known that prospective students are dominated by low and middle economic communities. There is also research from J S Pasaribu which uses K-Means to predict consumer interest in ordering food according to the season. As for the results of this study, it can be concluded that the data obtained from the K-Means calculation can be used as a menu recommendation for customers, later customers can find out the menu recommendations at the restaurant.
Data Mining is a process of applying methods by revealing hidden patterns of data so that it can become an information. In this research, data mining techniques is used, namely clustering techniques using the K-Means algorithm which can be interpreted as a grouping problem-solving algorithm to minimize multiple errors [2]. The K-Means algorithm uses a centroid model in making clusters by measuring the shortest distance from the centroid as a reference for forming a cluster.
The K-Means algorithm is a non-hierarchical method that will group data using a partition system. In its use, data with numeric type are used, then the data will be grouped into several clusters. In each cluster, there will be characteristics depending on the distribution of the data. The usage of this algorithm has been widely used because it is easy to implement, it's just that it is very sensitive to cluster initialization. The work stages of the K-means algorithm are shown in Figure 1. Flowchart of the K-Means Algorithm with the following an explanation:
-
• First, determine the number of clusters to be formed. To determine the number of clusters can be done randomly or using the elbow method.
-
• Determine the k-centroid (cluster center point) randomly.
-
• Calculate the distance of each data to the centroid. The formula that can be used is the Euclidean Distance formula which can be seen in equation (1).
D(X,πi)= ∑LχΛ-i)f (1)
Explanation :
i : iteration
n : number of cluster centers
x : data
π : centroid
-
• Grouping data based on the closest distance to the centroid.
-
• Determine the new centroid value by calculating the cluster average using equation (2).
Ck = 1 ∑xi nk
(2)
Explanation :
Ck : the centroid of k-cluster
nk : the amount of data in k-cluster
xi : the q data in the k-cluster
-
• Repeat step c - e until there are no changes in the members of the cluster.
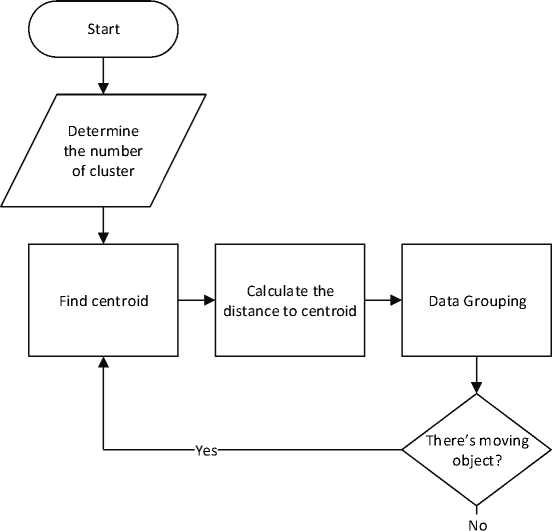
Figure 1. K-Means Algorithm Flowchart
The Elbow Method is a method that can help determine the cluster value based on the cluster relationship graph with the reduction in error [1]. If the K value increases, the graph will decrease to form an angled curve which is a stable result of K. Here is an elbow method based on the sum of square error (SSE).
K
SSE=∑∑IlXi -CkIl2 (3)
K =1 x ∈z
Explanation :
K : total cluster
Xi : data-i
Ck : the centroid of k-cluster
The results of the calculation of SSE (SUM of Square Error) will have several K values that have decreased the most, then the results of the K value will gradually decrease until stable. A drastic drop will form the elbow which is the ideal cluster k.
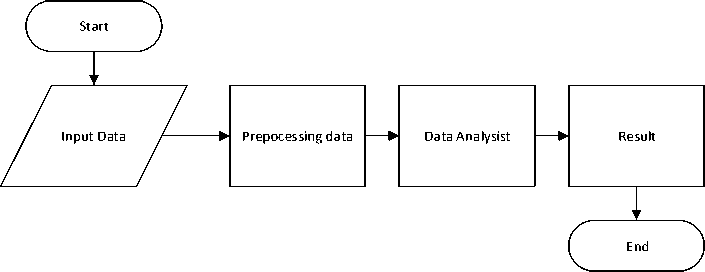
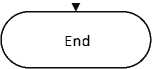
Figure 2. Design System Flowchart
The following is an explanation of design flowchart system:
-
a. Input data : is a step to enter data which at the beginning is in the form of manual data from transaction data including quantity, product size, product weight, level of difficulty in processing, and product price.
-
b. Preprocessing data : data processing stages is to see the quality of the data to be analyzed. Data prepocessing is important and has several techniques. If there is a noise data or data that is inconsistent or irrelevant, data cleaning can also be used, data selection can also be used to select the appropriate data to be analyzed and taken from the database and there are still several other techniques.
-
c. Data analysis : is the process of analyzing data to produce information. In this study, the K-Means algorithm is used to form clusters based on the number of product purchases and there are also several attributes to support grouping. Clusters will be formed by determining the number of clusters and calculating the distance of each data to the centroid. Furthermore, several clusters will be formed which contain data.
-
d. Result : is the result after the algorithm is ran and produced information in the form of several clusters based on the number of product orders. The other attributes will help in grouping based on the proximity of the k-centroid
As for this study, using transaction data as much as 2 transactions in 2019, namely on May 14th 2019 and August 26th 2019. From this data, the number of data was obtained as many as 131 orders with the initial attributes consisting of product code, description, quantity, product size, product weight, level of difficulty in processing, product price, total price, and the type of stone or gem used. Data is obtained in manual form and then processed into excel so that data is formed in the form of tables with sample data such as Table 1. Initial Data.
Table 1. Initial Data
|
Code |
Total Unit Total Description QTY Stone Size o a n o a Difficulty p Weight Price Price y |
|
BLKL 115 BSTR 738-S BSTR 738-S |
SILVER 12 8.5 371.00 54.62 655.44 1 Sll VFR SILVER 12 BZ 7 557.00 95.56 1146.72 5 BRACELETS SILVER 11 BZ 7.5 544.00 98.31 1081.41 5 SILVER |
|
BSER 117-G |
BRACELETS 1 9.5 90.00 163.68 163.68 5 ACCENTS) |
In data processing, data selection is carried out because there are several attributes not needed, beside that, data cleaning techniques are carried out to remove data that can cause noise and in this study focused on using product transaction data in the form of bracelets only. The results of preprocessing data obtained as many as 91 data in the form of data as in Table 2. Data Testing. To determine the level of difficulty, an unstructured interview was conducted with the company. The division is divided into 5 categories as shown in Table 3. Difficulty level.
|
Table 2. |
Data Testing | |||
|
Id |
Qty |
Size |
Weight Difficulty |
Harga |
|
1 |
3 |
8 |
263 2 |
84.16 |
|
2 |
3 |
8.5 |
282 2 |
90.24 |
|
3 |
3 |
8 |
322 1 |
103.04 |
|
4 |
3 |
9 |
359 1 |
114.88 |
|
Table 3. Difficulty Level | ||||
|
Difficulty |
Range Nilai Explanation | |||
|
1 |
1 – 2.9 |
Easy | ||
|
2 |
3 – 4.9 |
Quite easy | ||
|
3 |
5 – 6.9 |
Usual | ||
|
4 |
7 – 8.9 |
Difficult | ||
|
5 |
9 - 10 |
Very difficult | ||
The next stage, namely the data analysis process using the K-Means algorithm, which begins with importing the necessary libraries while the implementation using the python programming language. Then read the data file in .csv format with the file name Iris1.csv as shown in Figure 3. Read.csv.
dl = pd.readcsv("Irisl.csv")
dl.drop(,IdlJaxis=Ijinplace=True)
df = dl.values[:, 0:5]
df2 = pd.DataFramefdl)
df = pd.DataFrame(df)
-
Figure 3. Read.csv
Then the calculation is done to determine the cluster using the elbow method. In the calculation of the elbow method, to get the cluster value, it is necessary to calculate the total value of the distance between each point and its nearest centroid which is often called inertia. In this study, the inertia calculation was started from 1 to 10. Which in the x-axis is the number of clusters (k) that will be formed based on the graph by looking at the k value starting to flatten and forming an elbow. The results of the determination of the number of clusters, namely k = 3 which has a difference value of 315879.62, is shown in Figure 4. Elbow Method and Figure 5. Difference in each Cluster. To find the difference between each cluster by reducing the previous cluster to the next cluster with the second largest difference. The next step is to initialize the number of clusters,
which is k = 3 and a data graph will be obtained which contains the distribution of the centroid or center point and can be seen in Figure 6. Centroid Chart.
Figure 4. Elbow Method
Cluster 1 Inertia 1505884.5584813189
Cluster 2 Inertia 717715.5404237179 difference 788169.018057601
Cluster 3 Inertia 401835.9113050367 difference 315879.62911868125
Cluster 4 Inertia 268749.3453345955 difference 133086.5659704412
Cluster 5 Inertia 198786.5989502332 difference 69962.74638436228
Cluster 6 Inertia 159915.2681890658 difference 38871.330761167395
Cluster 7 Inertia 129573.37167491057 difference 30341.896514155233
Cluster 8 Inertia 106941.57448327544 difference 22631.797191635123
Cluster 9 Inertia 91813.10939821425 difference 15128.465085061194
Figure 5. Difference in each Cluster
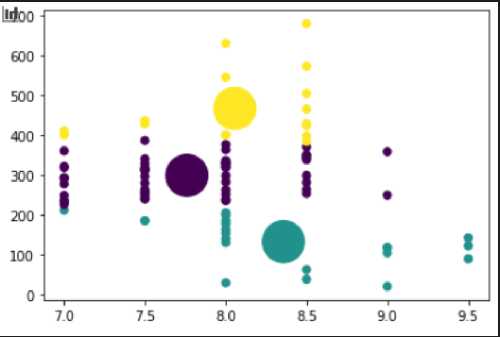
Figure 6. Centroid Chart.
In Figure 6. Centroid Chart is a two-dimensional graph with an x-axis in the form of size attributes starting from 7 cm to 9.5 cm and the y-axis in the form of weight attributes starting from 0 grams to 700 grams based on the data collected.
3.4 Result
After data analysis is done, the next step is the results stage where the cluster results will be displayed from the data used as many as 91 data with a table display which can be seen in Figure 7. Results. That way 3 clusters are starting from 0 to 2, where the most data goes into the first cluster (k = 0) with a total purchase of 326 products and the size that often orders is 7.75 with an average price per product of US $ 62.579. The number of purchases in each cluster is shown in Figure 8. The number of purchases per cluster, with the total goods in each
cluster is shown in Figure 9. Cluster predictions and the average yield in each cluster are shown in Figure 10. The average for each cluster.
|
id |
Qty Size |
Weight |
Difficulty Price |
cluster | ||
|
0 |
3 |
8.0 |
263 |
2 |
84.16 |
0 |
|
1 |
3 |
8.5 |
282 |
2 |
90.24 |
0 |
|
2 |
3 |
8.0 |
322 |
1 |
103.04 |
0 |
|
3 |
3 |
8.5 |
343 |
1 |
109.76 |
0 |
|
4 |
3 |
9.0 |
359 |
1 |
114.88 |
0 |
|
5 |
6 |
8.0 |
329 |
1 |
52.64 |
0 |
|
6 |
6 |
7.0 |
292 |
1 |
46.72 |
0 |
|
7 |
6 |
7.5 |
312 |
1 |
49.92 |
0 |
|
8 |
3 |
8.0 |
164 |
1 |
52.48 |
1 |
|
9 |
3 |
8.0 |
283 |
2 |
90.56 |
0 |
|
10 |
3 |
8.5 |
299 |
2 |
95.68 |
0 |
Figure 7. Result
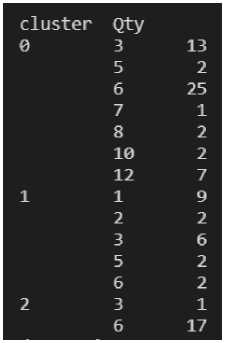
Figure 8. The Number of purchases per cluster
|
cluster |
Qty |
Size |
Weight |
Difficulty |
Price |
|
0 |
326 |
403.5 |
15563 |
100 |
3254.13 |
|
1 |
53 |
175.5 |
2796 |
54 |
1743.77 |
|
2 |
105 |
145.0 |
8413 |
54 |
1742.02 |
Figure 9. Cluster Prediction
Qty Size Weight Difficulty Price
cluster
θ 6.269231 7.759615 299.288462 1.923077 62.579423
1 2.523810 8.357143 133.142857 2.571429 83.036667
2 5.833333 8.055556 467.388889 3.000000 96.778889
Figure 10. The average of each cluster
The following is the result of the identification of each cluster contained in table 4. Cluster identification:
Table 4. Cluster Identification
|
Cluster |
Explanation |
|
Cluster 0 |
The first cluster is the cluster that has the most consumer interest, consisting of 326 total purchases, with an average size of 7.75 with an average weight of 299 grams and an average price of US $ 62.579. The average difficulty level of the product is 1.92, which means it is easy to work with. |
|
Cluster 1 |
The second cluster is a cluster with 53 purchases, with an average size of 8.3. The average weight and price in this cluster are 133 grams and US $ 83.03. The product difficulty level is around 2.57, which means it's easy to work on. |
|
Cluster 2 |
The third cluster is the cluster that has the least consumer interest, consisting of 105 orders, with an average size of 8.05 with an average weight and price of 467.3 grams and US $ 96.77. The product difficulty level is around 3.00, which means it's quite easy to work on. |
The use of the K-Means algorithm and the Elbow method as data analysis from the silver handicraft transaction data at the Kreasi Slaka Bali Company obtained a cluster value of k = 3 starting at a value of k = 0 to k = 2. The most data entered into the cluster (k = 0 ). With the results of grouping it can be concluded that the first cluster (k = 0) is the most enthusiasts with a total purchase of 326 products with an average price of US $ 62.579 and an average difficulty level of 1.92 which means it is not difficult in the process manufacture. Based on the first cluster data, the company can focus on that production, but does not rule out the possibility of producing products in other clusters. Meanwhile, if take from the whole cluster, the production results have a difficulty level between the range 1 to 4.9 which is in the easy and fairly easy levels.
References
-
[1] Fitria, Anita Febrianti, Hornay, Antonito Cabral and Anuraga, Gangga, “K-Means Clustering Dengan Metode Elbow Untuk Pengelompokan Kabupaten Dan Kota Di Jawa Timur Berdasarkan Indikator Kemiskinan”. SNHRP-1. 2018.
-
[2] Qolbi, A. A., “Penerapan Metode Clustering K-Means Terhadap Dosen Berdasarkan Publikasi Jurnal Nasional Dan Internasional”, Universitas Negeri Semarang, 2016.
-
[3] Pasaribu, J S, “Appilication of K-Means algorithm to predict consumer interest according to the season on place reservation and food online software” Journal of Physics : Conference Series. 2020.
-
[4] Resi, Bayu Indrawan. “Penerapan Algoritma K-Means Clustering Untuk Menentukan Strategi Promosi Universitas Islam Negeri Sunan Kalijaga Yogyakarta”. Yogyakarta. 2018.
-
[5] Setiawan, Rony, “Penerapan Data Mining Menggunakan Algoritma K-Means Clustering Untuk Menentukan Strategi Promosi Mahasiswa Baru (Studi Kasus : Politeknik LP3I Jakarta).” Jurnal Lentera ICT. vol.3, no.1, p. 76, 2016.
-
[6] Syakur, M. A., et al. "Integration k-means clustering method and elbow method for identification of the best customer profile cluster." IOP Conference Series: Materials Science and Engineering. Vol. 336. No. 1. IOP Publishing, 2018.
-
[7] Tegar, Rahman Aulia, Wiranto and Anggrainingsih, Rini, “Coal Trade Data Clusterung Using K-Means (Case Study PT. Global Bangkit Utama)” ITSMART : Jurnal Ilmiah Teknologi dan Informasi, vol. 6, no. 1. 2017.
548
Discussion and feedback