Classification of Pop and RnB (Rhythm and Blues) Songs with MFCC Feature Extraction and K-NN Classifier
on
p-ISSN: 2301-5373
e-ISSN: 2654-5101
Jurnal Elektronik Ilmu Komputer Udayana
Volume 9 No. 4, May 2021
Classification of Pop And RnB (Rhythm And Blues) Songs With MFCC Feature Extraction And K-NN Classifier
Zhaqy Hikkammi Gullam Ramadhana1, I Made Widiarthaa2
aInformatics Department, Faculty of Math and Science, Udayana University Bali, Indonesia
1gulamrmd25@gmail.com 2madewidiartha@unud.ac.id
Abstract
Classification is a technique for designing functions based on observations of attributes in a data so that data can be mapped that do not have a class which in this study can be called genres, into data that has been classified according to the given rules. In this research, music classification is conducted to determine whether the class or genre of music is pop or RnB (Rhythm and Blues) by using MFCC as the feature extraction method and K-NN as the classification method. The test results in this study obtained an accuracy of 77.5% with an optimal value of k = 31 as a parameter in K-NN.
Keywords: MFCC, K-NN, Pop, RnB, Genre, Accuracy.
Genre of music is a classification done by someone based on the similarity of rhythm, harmony, and various contents of the music. However, manual music classification like this takes a lot of time because you have to listen to the music one by one, giving genres to music is done manually by an expert [1]. So a more effective classification or classification is needed.
Music genre is the most common way to organize digital music databases [2i]. Associating a genre with a piece of music can help music listeners find the music they're looking for in a huge music catalog. The introduction of musical genres is an important thing that has been studied deeply by the Music Information Retrieval (MIR) community since 2002 [3].
Now that there is an increasing number of music in circulation, manually assigning genres to appear online will take time and expertise. Automatic giving of genres can help, reduce, or replace the role of humans in giving genres to a music
There are 2 types of music that are currently being favored by various groups, starting from teenagers or adults today, namely pop music and RnB (Rhythm and Blues). When we're having a bad day we can listen to some quick pop to get the spirits up. When we are angry and need to feel better, we can listen to soothing songs, in other words pop that can be used according to the mood for the listener because pop prioritizes lyrics that are easy to digest with the listener's mood and tones that are easy to sing. Meanwhile, RnB has a lot to look for because it's simple and easy listening is the same as the pop music genre, but there is no difference. Pop music focuses on easy-to-sing lyrics and notes, RnB prioritizes the lyrics and the beats are sung with rhythm.
Many are both types of music, but visuals are also difficult to distinguish. Music that is in the same genre usually has certain similar characteristics related to instrumentation, rhythmic structure, and musical pitch [1]. Different for music composers, both music can be classified by them. But for ordinary people, it will be difficult to reduce visuals that are very similar, so that is the
background for me to classify fatigue. Own kind of pop music. Because it contains many songs with various tempo.
Music needs to be extracted before it can be classified in order to obtain data in the form of values from the music itself. The mel frequency cepstrum coefficient (MFCC) method can be used to extract features from music. MFCCis a series of short-term power spectrum in the audio file. MFCC models the characteristics of the human voice. The feature vector output from this extraction reaches up to 39 feature vectors [1]. From the results of the extraction, the classification was carried out using K-Nearest Neighbor (K-NN).K-NN is a method that is easy to learn and in terms of learning, this method has the nature of supervised learning, which means this method uses training data which is used as information for classification in later test data [2].
In the research entitled "Classification of Music Genres Using the Mel Frequency Cepstrum Coefficients (MFCC) Method and K-Nearest Neighbors Classifier" There are 5 genres with 50 audio data in each genre. The best accuracy obtained from this study is 52.4% with K = 13 [7]. Then in a study entitled "Music Genre Classification Using MFCC, K-NN and SVM Classifier" comparisons of two classification methods, namely K-NN and Support Vector Machine (SVM) of 5 music features (MFCC, Chroma frequencies, spectral center, spectral roll. -off and zero crossing rate) with data from 900 songs divided into 9 music classes or genres (100 songs per class) [3].
From some of the studies above, this study will adopt the MFCC and K-NN methods to classify pop and RnB genres and measure how high the accuracy will be with the proportion of training data, test data, and predetermined k parameters.
In this study, the audio data to be classified are secondary data obtained from the GTZAN dataset. Two genres were taken, namely RnB and pop with 100 songs for each genre which can be seen in Table 1.
Table 1. Data on genre classification research
|
No. |
Genre |
Song title |
|
1 |
RnB |
Rnb.00000.wav - Rnb.00099.wav |
|
2 |
Pop |
pop.00000.wav - pop.00099.wav |
Then, the research process is shown in a flow chart regarding the genre classification process which can be seen in Figure 1.
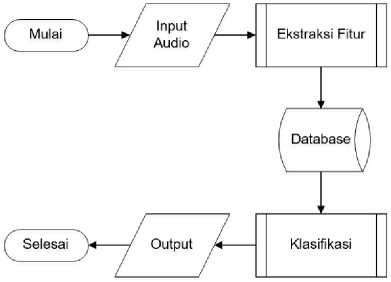
Figure 1. Music genre classification flow chart
The purpose of the feature extraction stage is to obtain new data with feature vectors obtained from the extraction of audio data. Several steps are required for the MFCC feature extraction:
-
a. Frame Blocking
Frame Blockingis the process of splitting sound into several frames and each frame consists of several samples. The purpose of frame blocking is to form a non-stationary signal into a quasi-stationary signal so that it can be converted from a time domain signal to a frequency domain signal using the Fourier transform.
-
b. Windowing
Windowing is a process to minimize discontinuous signals at the beginning and end of each frame. The concept of windowing is tapering the signal to zero at the beginning and end of each frame which is done like equation (1).
y1 = x1 (n) ω (n)
(1)
Where:
y1 represents the windowing signal sample value, x1 (n) is the sample value of the ith signal frame, ω is a window function and,
n represents the length of the frame.
c.
Fast Fourier Transform (FFT)
The FFT converts each Nth frame of the sample from the time domain into the frequency domain as in equation (2).
2πjkn xk= ∑n-ixne ~
(2)
Where:
xkis the number of k frequencies in the signal.
N represents the number of samples
n is an iteration of the sample starting at 0
-
d. Mel Frequency Wrapping
Equation approach for calculating mel in frequency f (Hz) like equation (3).
mel(f) = 2595 xlogιo(1+⅛ (3)
Where f is the sample rate.
-
e. Cepstrum
Converts log mel spectrum to time domain. This result is called the mel frequency cepstrum coefficient (MFCC). Equation (4) is the calculation method.
Cn =∑K=ι(log Sk)cos [n(k -1) ^]
(4)
The new data obtained from MFCC feature extraction will be used as data for later classification. Because the output of this feature vector can reach up to 39, in this study, the first 13 feature vectors were taken based on and referenced from a previous study[3]. The representation of the vector data that will be obtained from the MFCC feature extraction can be seen in Figure 2.
Figure 2. The first 10 datasets obtained from MFCC feature extraction
|
J 1 |
mfcc seti |
1 |
J K |
M |
N | ||||||||
|
mfcc_set2 |
mfcc_set3 |
mfcc_set4 |
mfcc_set5 |
mfcc_set6 |
mfcc_set7 |
mfcc_set8 |
mfcc_set9 |
mfcc seti mfcc seti |
mfcc_setl |
mfcc_setlgenre | |||
|
2 |
64.58803 |
24.88193 |
18.0494 |
17.14164 |
11.86315 |
14.99372 |
11.67058 |
12.72655 |
10.94159 |
11.21129 9.839917 |
8.6171 |
8.443376 |
0 |
|
B |
73.69475 |
37.97397 |
29.93076 |
22.2399 |
18.29775 |
18.15099 |
14.82486 |
13.698 |
13.77611 |
12.17482 10.65445 |
10.41456 |
10.77897 |
0 |
|
4 |
53.91877 |
24.4209 |
13.48785 |
12.49249 |
10.16486 |
10.61788 |
9.116996 |
7.481346 |
7.463811 |
8.099452 7.971764 |
7.952763 |
8.324249 |
0 |
|
5 |
52.38286 |
35.04981 |
22.50965 |
19.21233 |
11.92769 |
13.51561 |
10.2434 |
9.472735 |
9.601945 |
8.89978 8.383839 |
7.740423 |
7.620057 |
0 |
|
6 |
35.69613 |
22.30297 |
19.49447 |
13.12669 |
10.18766 |
11.49882 |
8.80513 |
6.970142 |
7.141929 |
7.063309 6.∞9691 |
6.210162 |
5.872766 |
0 |
|
7 |
141.0836 |
21.35714 |
28.84341 |
14.03005 |
10.09728 |
12.17564 |
9.767021 |
11.3447 |
10.25246 |
11.22731 9.463563 |
9.072463 |
7.846376 |
0 |
|
8 |
70.04388 |
24.04498 |
18.81369 |
13.50171 |
7.872255 |
10.24444 |
7.975812 |
6.55442 |
6.088174 |
6.69709 7.519865 |
6.710766 |
6.911629 |
0 |
|
9 |
60.70252 |
44.83849 |
26.29202 |
25.90134 |
13.48231 |
14.61763 |
11.97436 |
11.52304 |
10.70504 |
13.35045 13.34196 |
14.15349 |
15.48106 |
0 |
|
10 |
47.19563 |
24.55001 |
25.40399 |
12.68524 |
10.92387 |
12.07507 |
9.236416 |
7.749003 |
8.267956 |
7.489103 7.757733 |
6.921389 |
6.348581 |
0 |
The classification stage is carried out after obtaining a new dataset from feature extraction.
Several steps in the classification with K-NN are:
-
a. Input Dataset
The dataset that has been obtained from feature extraction will be the input of the classification process.
-
b. Pre-processing
Data normalization is carried out with min-max normalization with equation (5) to obtain a balance of comparison values between data [4]
minRange + (x — minValue)(maxRang e — minRange) , .
norm(x) =--------------——---- . τ. ,--------------- (5)
maxvalue — mιnvalue
Where norm (x) is data x that has been normalized, minRange is the minimum limit that we give, maxRange is the maximum limit we give, then minValue and maxValue are the smallest and largest values of all data that have not been normalized, and x is the data which has not been normalized.
There are many distance calculations in the K-NN method, one of which is Euclidean. The purpose of the calculation is to define the distance between two points, namely the point on the training data (x) and the point on the testing data (y). Calculation of the euclidean distance can be done with equation (6).
d(xi,yi) = √
n
∑(χi-y)2 (6)
i=0
Where, d is the distance between the points on the training data x and the testing data points y that will be classified, then x, y and i represent the attributes and n is the attribute dimensions.
The sorting process is carried out after all the distances have been obtained. In the K-NN method, a sorting process is carried out based on the smallest (closest) distance value.
The process of determining the class or genre of music from the previous calculation process. Obtained the output of the class or genre results from the test data through this determination process.
The test scenario is carried out to determine the best accuracy resulting from several different K values which will be tested by the K-NN method against the classification of music genres. The values or parameters of K to be tested are 3, 7, 11, 21, 31, 41, 51, and 61. The proportion of training data and test data in this study is 80:20 based on research on the classification that has been done [5]. Testing using the distribution of the proportion of training data and 80:20 test data with several different K parameters can be seen in Table 3.
In this study, the Accuracy calculation was performed from the classification results to measure the level of accuracy. Accuracy is the accuracy or accuracy of the amount of data that is predicted correctly which is obtained by equation (5) [6].
TP + TN Accuracy = ———————— TP + FN + FP + TN
(5)
Where:
TP = Number of positive objects that are correctly classified (True Positive).
TN = Number of misclassified negative objects (True Negative).
FP = Number of negative objects that are correctly classified (False Positive).
FN = Number of incorrectly classified positive objects (False Negative).
Table 2. Accuracy Testing with the proportion of 80:20
|
Training Data |
Test Data |
K value |
K-NN accuracy |
|
80 |
20 |
3 |
70% |
|
7 |
72.5% | ||
|
11 |
72.5% | ||
|
21 |
72.5% | ||
|
31 |
72.5% | ||
|
41 |
72.5% | ||
|
51 |
60% | ||
|
61 |
55% | ||
|
71 |
50% |

Figure 3. Line graph of test accuracy
Based on the results of successful research, it can be concluded that the MFCC and K-NN Classifier feature extraction method used to classify Pop and RnB songs with the proportion of 80:20 can produce the highest accuracy of 77.5% with a value of k = 31. From the graph shown on Figure 3 shows an increase occurred at the value of k = 31 and after that there was a significant decrease. It is hoped that in future studies, because not all possible values for the k parameter are tested, the accuracy can be further improved by optimizing the K parameter by methods such as genetic algorithms and others.
References
-
[1] George Tzanetakis, Perry Cook, “Musical Genre Classification of Audio Signal” IEEE Transactions On Speech and Audio Processing, Vol.10, No.5, July 2002.
-
[2] Loris Nannia, Yandre M. G. Costab, Alessandra Lumini, Moo Young Kim,Seung Ryul Baek, “Combining visual and acoustic featuresfor music genre classification” Expert System with Applications, Volume 45, pp. 108-117.
-
[3] Gst. Ayu Vida Mastrika Giri, “Klasifikasi dan Retrieval Musik Berdasarkan Genre” Jurnal
Ilmiah, Ilmu Komputer, Universitas Udayana, Vol X, No. 1, April 2017.
-
[4] Sayf A. Majeed, Hafizah Husain, Salina Abdul Samad Tariq F. Idbeaa, “Mel Frequency
Cepstral Coefficients (MFCC) Feature Extraction Enhancement In The Application Of Speech Recognition: A Comparison Study” Theoretical and Applied Information Technology, Vol. 79, No. 1, pp. 38-56, September 2015.
-
[5] Tri Holomoan Simanjuntak, Wayan Firdaus Mahmudi, and Sutrisno, "Implementation of Modified K-Nearest Neighbor with K-Value Automation in Soybean Plant Disease Classification" Development of Information Technology and Computer Science, Vol. 1, No. 2, pp. 75-79, February 2017.
-
[6] Nilesh M. Patil, and Dr. Milind U. Nemade, “Music Genre Classification Using MFCC, K-NN, and SVM Classifier” Computer Engineering in Research Trends, Vol. 4, Issue 2, pp. 43-47, February 2017.
-
[7] Darnisa Azzahra Nasution, Hidayah Husnul Khotimah, and Nurul Chamidah, "Comparison of Normalized Data for Classification of Wine Using K-NN Algorithm" Computer Engineering Systems and Science, Vol. 4, No. 1, pp. 78-82, January 2019.
-
[8] Nanang Wahyudi, Sri Wahyuningsih, and Fidia Deny Tisna Amijaya, "Optimization of Coal Classification Based on Calorie using Genetic Modified K-Nearest Neighbor (GMK-NN)" in Exponential, Vol. 10, No. 2, pp. 103-111, November 2019.
-
[9] Yogiek Indra Kurniawan, and Tiyssa Indah Barokah, "Classification of Credit Card Application Determination Using K-Nearest Neighbor" in MATRIK Scientific Journal, Vol. 22, No. 1, pp73-82, April 2020.
524
Discussion and feedback