Implementation Of The K-Nearest Neighbor (KNN) Algorithm For Classification Of Obesity Levels
on
p-ISSN: 2301-5373
e-ISSN: 2654-5101
Jurnal Elektronik Ilmu Komputer Udayana
Volume 9, No 2. November 2020
Implementation Of The K-Nearest Neighbor (KNN) Algorithm For Classification Of Obesity Levels
Ayu Made Surya Indra Dewia1, Ida Bagus Gede Dwidasmaraa2
aInformatics Department, Udayana University Bali, Indonesia 1ayuindra182@gmail.com 2dwidasmara@unud.ac.id
Abstract
Obesity or overweight is a health problem that can affect anyone. In research in several journals, it was found that obesity can be influenced by many factors, but the most dominant factors are lifestyle and diet. Obesity should not only be considered as a consequence of an unhealthy lifestyle, but obesity is a disease that can lead to other dangerous diseases. Therefore, it is important to know the level of obesity in order to take early prevention.
To determine the level of obesity, a classification method is used, namely K-Nearest Neighbor (KNN) to classify the level of obesity. In this study, classification was carried out with 16 test parameters, namely Gender, Age, Height, Weight, Family History With Overweight, FAVC, FCVC, NCP, CAEC, Smoke, CH2O, SCC, FAF, TUE, CALC, Mtrans and 1 class attribute, namely Nobesity. From tests carried out using the KNN algorithm, the results obtained are 78.98% accuracy with a value of k = 2.
Keywords: Obesity, Lifestyle, Disease, KNN, Classification
Obesity or more commonly known as overweight is a familiar health problem and has become one of the major health problems in the social environment. [1] defines obesity as a condition in which the body has excessive accumulation of fat, in other words obesity is a disorder or disease characterized by excess fat accumulation. The main cause of obesity is not clearly known, however [2] states that the tendency for obesity is closely related to diet, social status, imbalance between body activity and food consumption. Obesity does not only have medical, psychological, and social impacts, but obesity has a major impact on sufferers. People who are obese have a high risk of developing diseases, one of which is hypertension or high blood pressure. According to WHO, a person is said to be obese when the BMI (Body Max Index) is more than normal, namely BMI> 25.0 [2]. BMI is a number obtained from dividing the weight and height.
There are many factors that cause obesity, but obesity is mostly caused by an unhealthy lifestyle in which the sufferer eats too much, does too little activity or it could be caused by both [2]. Obesity should not only be considered as a consequence of an unhealthy lifestyle. Obesity should be considered as a disease that can pose a risk factor for other diseases. Therefore, early detection of obesity levels is important to avoid risk factors for other diseases. Classification in data mining can be used to predict and classify the level of obesity based on lifestyle and diet. Several studies that have been conducted using data mining in the classification process include by [3]. [3] conducted a classification comparison to predict hepatitis using the K-Nearest Neighbor (KNN) algorithm, Naive Bayes, and Neural Network. From the research conducted, the best accuracy was obtained using the K-Nearest Neighbor algorithm, which was 97%.
Based on the explanation above, the KNN algorithm will be used in this study to classify the level of obesity based on eating habits and physical conditions. This method was chosen because KNN is tough on noisy training data and is also effective for large training data [4]. Other than that, [5] in [6] mentions that KNN is commonly used in the health world to find solutions from new patients based on the closeness of cases to old patients.
In this study, we used a simulation application, namely RapidMiner Version 9.7, where the data we obtained from www.kaggle.com those who have already passed preprocess data are first inputted into the existing database on Rapid Miner. Then the calculation will be carried out using the KNN algorithm and looking for the most optimal K value. After that, validation and evaluation of the results and level of accuracy will be carried out. In this study, the k values to be tested were from k = 1 to k = 15 to see the best performance. Validation in this study will use 10 folds cross validation. This validation process has been widely applied in other studies because this process has been proven to be good and produces a stable level of accuracy [7]. To measure the accuracy, a configuration matrix is used by comparing predictions with the original class of input data. After calculating the accuracy of each k parameter selection, the accuracy level will be recorded to see the most optimal k value. Figure 1 is the research flow that will be carried out.
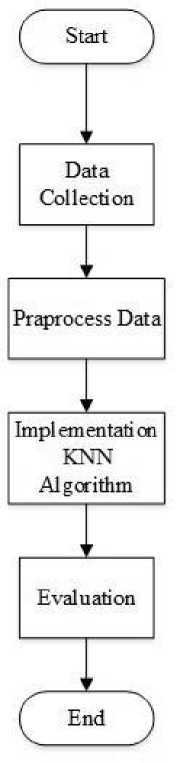
Figure 1. Research Flow
The data used in this study is secondary data, namely data on the level of obesity based on diet and physical conditions obtained from www.kaggle.com. This dataset has 16 attributes used to
detect a person's obesity level, namely Gender, Age, Height, Weight, Family History With Overweight, FAVC, FCVC, NCP, CAEC, Smoke, CH2O, SCC, FAF, TUE, CALC, Mtrans and 1 attribute. class namely Nobesity. The total data that will be used in the classification process is 2085 from 2111 data. Table 1 is an explanation of each attribute in the dataset. In the table, it can be seen that the attributes of FAVC, FCVC, NCP, CAEC, CH2O, and CACL are attributes related to eating habits and the attributes of SCC, FAF, TUE, and Mtrans are attributes related to physical conditions.
|
Table 1. Data Attributes | ||
|
Attribute |
Description |
Criteria |
|
Gender |
Gender (Female, Male) |
-Male -Female |
|
Age |
Age |
14 - 61 |
|
Height |
Height |
145 - 198 |
|
Weight |
Weight |
39 - 173 |
|
Family |
Family history of obesity |
1 = No. |
|
History With Overweight |
2 = Yes | |
|
FAVC |
Attributes that indicate frequent |
1 = No. |
|
consumption of foods with high calories |
2 = Yes | |
|
FCVC |
An attribute that shows the frequency |
1 = Never |
|
of consumption of vegetables |
| |
|
NCP |
The number of staple foods consumed |
1 = one |
|
every day |
| |
|
CAEC |
Frequency of food consumption |
1 = No. |
|
between meals |
| |
|
Smoke |
Smoker or not |
|
|
CH2O |
The amount of water to drink every |
1 = Less than a liter |
|
day |
| |
|
SCC |
Monitor calories consumed every day |
|
|
FAF |
Frequency of physical activity |
0 = I do not have 1 = 1 0r 2 days 2 = 2 or 4 days 3 = 4 or 5 days |
|
TUE |
Time to use the device |
0 = 0 - 2 hours
|
|
CALC |
Frequency of drinking alcohol |
|
|
MTrans |
Transportation that is often used every |
1 = Automobile |
|
day |
| |
NObesity Class Attributes
Insufficient Weight
-
- Normal Weight
-
- Overweight Level I
-
- Overweight Level II
-
- Obesity Type I
-
- Obesity Type II
-
- Obesity Type III
After collecting data, the next step is to preprocess the data. In this preprocess data, duplicate data will be cleaned up. After cleaning the data, the amount of data used is 2085 from 2111 data. Then, the cleaned data will be transformed into numerical form. Data that already has a weight will be inputted into the Rapid Miner database to be processed using the KNN algorithm.
The K-Nearest Neighbor (KNN) algorithm is one of the classification methods in data mining, where KNN classifies a set of data based on learning data that has been classified or labeled. KNN is included in the supervied learning group, namely the results of newly classified query instances based on the majority of proximity to existing categories in KNN [8].
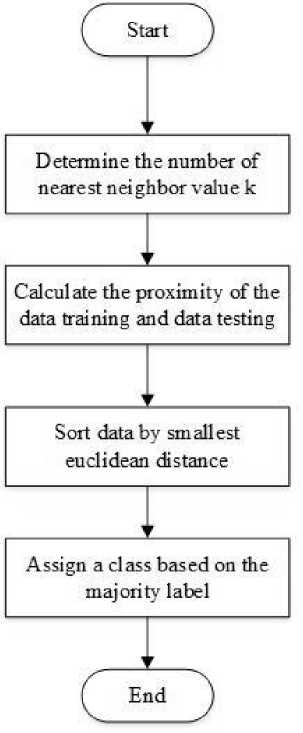
Figure 2. KNN Algorithm Algorithm
The steps in classifying using the K-Nearest Neighbor (KNN) algorithm are as follows [9]:
-
1. Specifies the k parameter
-
2. Calculating the distance between training data and testing data. The most commonly used distance calculation in the calculation of the KNN algorithm is the calculation of Euclidean Distance with the formula in equation (1)
euc =√∑"=ι(pi - <?02 (1)
Where : pi = training data qi = data testing i = data variable n = dimension of data
-
3. Sort the distances formed
-
4. Determines the closest distance to the sequence K
-
5. Pair the appropriate class
-
6. Finds the number of classes from the closest neighbors and assigns the class as the data class to be evaluated
From several experiments using the Rapid Miner tool, results are obtained as in table 2. In table 2 there are several uses of the K parameter starting from k = 1 to k = 15 to see the best performance in the calculation of the KNN algorithm.
Table 2. Accuracy Results of the KNN Algorithm
|
K |
Accuracy |
+/- |
Micro |
|
1 |
78.89% |
2.50% |
78.89% |
|
2 |
78.98% |
2.39% |
78.98% |
|
3 |
77.30% |
1.53% |
77.30% |
|
4 |
77.06% |
2.12% |
77.06% |
|
5 |
75.77% |
1.47% |
75.77% |
|
6 |
75.14% |
1.71% |
75.14% |
|
7 |
74.66% |
2.39% |
74.66% |
|
8 |
73.51% |
2.87% |
73.51% |
|
9 |
72.55% |
3.12% |
72.55% |
|
10 |
71.78% |
2.82% |
71.78% |
|
11 |
70.92% |
3.29% |
70.92% |
|
12 |
70.06% |
3.11% |
70.06% |
|
13 |
69.62% |
3.51% |
69.63% |
|
14 |
69.19% |
2.98% |
69.19% |
|
15 |
68.14% |
3.26% |
68.14% |
In this study, 10 folds cross validation was used to carry out the validation process. Where the dataset will be divided into 10 parts with 1 part for testing data and 9 other parts for training data. The process will be repeated 10 times so that the entire data has a one-time opportunity to become testing data.
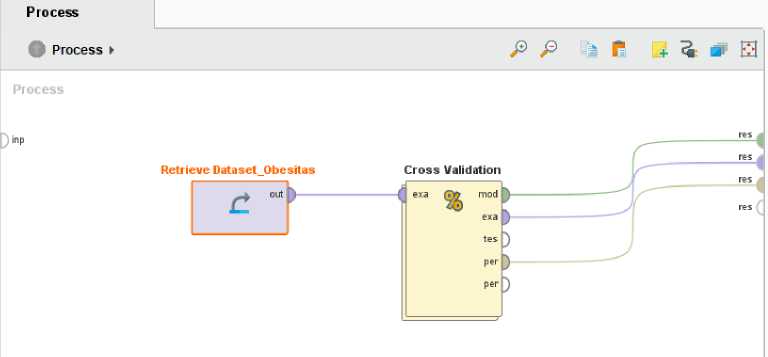
Figure 3. Validation Process Using Cross Validation
Figure 3 is the process of validation using the rapidminer tools. Where in the image there is a dataset of obesity that was previously imported with the .csv format. The output from the dataset will enter the validation process. In the validation process, there is an implementation of the KNN algorithm as seen in Figure 4
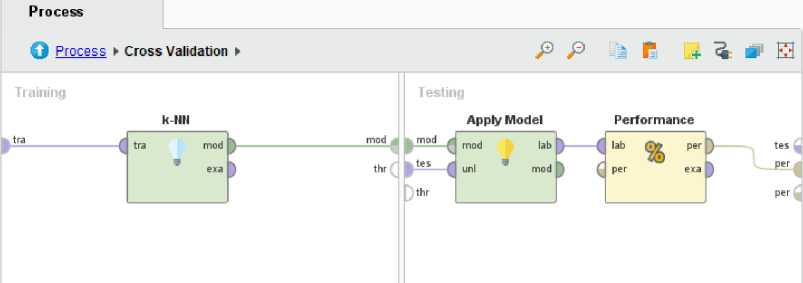
Figure 4. Implementation of the KNN Algorithm
In Figure 4, you can see the process that is in the validation process. Where the KNN algorithm is used for training and applying the model and performance is used in testing using the accuracy test confussion matrix. The results of the confussion matrix will be displayed and the average value of the 10 attempts in the validation process is taken. From 10 experiments with different K parameters, from the range k = 1 to k = 15, it is obtained if k = 2 has the best level of accuracy, which is 78.98%.
Figure 5 is the result of the output from Rapidminer in the form of the accuracy generated using the parameter k = 2.
accuracy: 78.98% +/- 2.39% (micro averaflθ: 78.98%)
|
true Norma... |
true Overw... |
true Overw... |
true Obesit.. |
true Insuffi... |
true Obesit... |
true Obesit... |
class preci. | |
|
pred. Norm... |
101 |
17 |
10 |
19 |
16 |
3 |
1 |
60.48% |
|
pred. Over... |
40 |
217 |
21 |
12 |
2 |
2 |
5 |
72.58% |
|
pred. Over... |
37 |
9 |
226 |
11 |
8 |
10 |
3 |
74.34% |
|
pred. Obes... |
38 |
15 |
15 |
297 |
6 |
6 |
3 |
78.16% |
|
pred. Insuff |
43 |
6 |
6 |
1 |
223 |
1 |
1 |
79.36% |
|
pred. Obes... |
17 |
12 |
8 |
7 |
6 |
275 |
1 |
84.36% |
|
pred. Obes... |
6 |
0 |
4 |
4 |
6 |
O |
307 |
93.88% |
|
class recall |
35.82% |
78.62% |
77.93% |
84.62% |
83.52% |
92.59% |
95.64% |
-
Figure 5. Accuracy results with k = 2
From the results that have been achieved, it can be concluded that the KNN algorithm can classify the level of obesity based on eating habits and physical condition quite well. This is proven by the achievement of an accuracy of 78.98% with the parameter k = 2 in the simulation using Rapid Miner.
Future developments will focus on implementing other algorithms to improve accuracy in predicting obesity levels so that later it can be used as a reference in making a system that is precise and accurate.
References
-
[1] T. Sudargo, H. F. LM, F. Rosiyani and N. A. Kusumayanti, Pola Makan Dan Obesitas, Yogyakarta : Gadjah Mada University Press, 2014.
-
[2] Misnadiarly, Obesitas Sebagai Faktor Resiko Beberapa Penyakit, Edisi 1., Jakarta: Yayasan Pustaka Obor, 2007.
-
[3] Sulastri, K. Hadiono, M. T. Anwar, “Analisis Perbandingan Prediksi Penyakit Hepatitis Dengan Menggunakan Algoritma K-Nearest Neighbor, Naive Bayes Dan Neural Network” DINAMIK, vol. 24, no. 2, p. 82 – 91, 2019.
-
[4] O, Musa and Alang, “Analisis Penyakit Paru – Paru Menggunakan Algoritma K_Nearest Neighbors Pada Rumah Sakit Aloei Saboe Kota Gorontalo” ILKOM Jurnal Ilmiah, vol. 9, no, 3 p. 348 – 352, 2017.
-
[5] A. Fitria and H. Azis, “Analisis Kinerja Sistem Klasifikasi Skripsi menggunakan Metode Naïve Bayes Classifier,” Pros. Semin. Nas. Ilmu Komput. dan Teknol. Inf., vol. 3, no. 2, pp. 102– 106, 2018
-
[6] Hasran, “Klasifikasi Penyakit Jantung Menggunakan K-Nearest Neighbor” Indonesian Journal Of Data And Science, vol. 1, no. 1, pp. 06 – 10, 2020.
-
[7] S. W. Binabar and Ivandari, “Optimasi Parameter K Pada Algoritma Untuk Deteksi Penyakit Kanker Payudara” IC-Tech, vol. XII, no. 2, 2017.
-
[8] A. Wanto, M. N. H. Siregar, A. P. Windarto, D. Hartama, N. L. W. S. R. Ginantra, D. Napitupulu, E. S. Negara, M. R. Lubis, S. V. Dewi and C. Prianto, Data Mining: Algoritma Dan Implementasi, Medan: Yayasan Kita Menulis, 2020.
-
[9] D. Cahyanti, A. Rahmayani and S. A. Husniar, “Analisis Performa Metode KNN Pada Dataset Pasien Pengidap Kanker Payudara” Indonesia Journal Of Data And Science, vol. 1, no. 2, 2020.
This page is intentionally left blank
284
Discussion and feedback