Mood Classification of Balinese Songs with the K-Means Clustering Method Based on the Audio-Content Feature
on
p-ISSN: 2301-5373
e-ISSN: 2654-5101
Jurnal Elektronik Ilmu Komputer Udayana
Volume 9 No. 3, February 2021
Mood Classification of Balinese Songs with the K-Means Clustering Method Based on the Audio-Content Feature
I Putu Bayu Wira Brataa1, I Dewa Made Bayu Atmaja Darmawana2 aInformatics Department, Faculty of Math and Science, Udayana University Bukit Jimbaran, Badung, Indonesia
1bayuwirabrata@student.unud.ac.id 2dewabayu@unud.ac.id
Abstrak
Bali is a province that has a diversity of arts and can not shunt from songs that come from Bali. Music in Balinese songs has a unique character, both in the variations of the tone that builds up a song and the lyrics contained in a Balinese song. Research on the classification of mood with energy and valence features of a song is often done, especially on western songs. Every music that is thought out has emotional energy that radiates and powerfully connects with human psychology. This research wants to explore whether the features used to classify western songs can also classify Balinese songs, which are rich in the sound of musical instruments according to the tastes of the Balinese themselves. Classification of songs is essential, considering that music is related to specific emotions and moods in humans. In this study, the mood classification of Balinese songs is performed using the Spotify API feature, namely energy and valence. Classification using K-means clustering based on energy and valence features is compared with the song mood data from ten respondents and produces the highest accuracy of 32%.
Keywords: k-means clustering, mood classification, Balinese songs, Spotify API, arousal, valence
Bali is a province with a diversity of arts, such as Balinese pop songs, with enchanting characteristics. Balinese songs are one of the essential media to help preserve Balinese culture. Besides, Balinese songs are also a vehicle for awakening the character of the young Balinese generation in the future. So do not be surprised if Balinese songs will have music that is rich in tones that can describe the diversity of Bali.
Music has become an area of research in applying information retrieval techniques that are interesting to research. Music Information Retrieval or MIR is a branch of music information retrieval technique that has developed rapidly in recent years, as evidenced by the existence of many studies examining how music can be categorized into several emotional states or human moods. Song mood classification is a challenge in the music information retrieval system [1]. Field research includes classification, music data clustering, and music analysis to represent the knowledge in it.
Balinese songs have a unique character, both the variations in the tone that make up the song and the lyrics found in Balinese songs. If Balinese songs are classified based on mood, it will make it easier for people if they want to listen to Balinese songs and choose what suits their mood. However, mood classification research is generally only conducted on popular western songs [2]. This study also challenges and an inquiry for researchers whether Western songs, especially the energy and valence used, can classify Balinese songs.
Much of the research on MIR has investigated the classification of emotions and moods in music, psychology, signal processing, machine learning, or model integration. MIR uses various data mining methods for grouping, including data classification and grouping such as K-NN, C4.5, decision trees, Support Vector Model (SVM), Artificial Neural Networks, Self Organization Map, K-Means, and so on.
This system will be built based on the grouping of mood parameters obtained using the K-Means algorithm. The advantage of this algorithm is that it can perform unsupervised learning by
minimizing variation between data in a cluster and maximizing variation with data in other clusters. The dataset used in this study is song feature data from the Spotify playlist. This research can be an engineering system model that can classify Balinese songs into four mood parameters to make it easier for Balinese people to choose songs according to their mood. This system is also able to make Balinese songs more loved by the local community.
The music grouping system for mood using the K-Means algorithm has two main components, namely the input component, the music classification system for mood, and the output component, namely the music mood type label, which can see in Figure 1.Figure 1. The input component obtained from the playlist data set Spotify, and the output is a mood type from one of the defined mood classes.
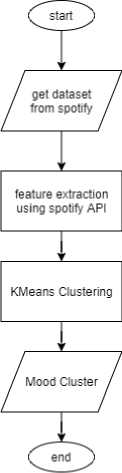
Figure 1. System overview
The mood class model used in song classification is the Thayer model, including happy, sad, relax, angry.
Arousal
Annoying
(high)
Excited
Angry
Nervous
Happy
Pleased
(negative)
Relaxed
Peaceful
Valence
(positive)
Sleepy
Figure 2. Mood Thayer model arousal-valence [3]
Figure 2 shows how emotions are represented by valence and arousal (energy). In this study, both features were obtained from the extraction with the Spotify API continuously with the data used. Spotify API, or previously known as the EchoNest API [4, 5], uses signal processing and machine learning to extract all features in music. This machine learning technique simulates how people hear music, combining the principles of psychoacoustics, musical perception, and adaptive learning to model the physical and cognitive processes of human hearing.
Balinese songs are an essential medium to help preserve Balinese culture. This song consists of several exciting instruments that characterize Balinese culture itself, such as flutes, drums, etcetera. At this time, Balinese song music has been combined with various modern musical instruments, making Balinese songs rich in musical instruments in them. The existence of Balinese songs in the 90s initially intends to preserve Balinese art and culture. Balinese song initially believes to be one of the educational media because Balinese song lyrics pay attention to the grammar known as unggah-ungguhing basa Bali [6]. The uniqueness of popular culture such as Balinese songs, among others, lies in the simplicity of their content so that they accept by the general public and are more entertaining. With these characteristics, pop songs that use Balinese accept by the Balinese speaking community (Balinese). Therefore, the researcher wants to map the Balinese song's mood so that it is easier for people to find the desired Balinese song based on their mood.
It was defining the problem that covers the background and problems that will support the system. Literature/report study is an essential stage in starting the research because it is related to theory and summarizes previous research that will form this research. The data acquisition stages in this study used a data set from the Spotify API website. The Spotify Web API provides user-related data, such as playlists and music, that a user stores in the user's music library. The access is activated via selective authorization by the user.
Research conducted by [7] suggests various stages in grouping types of songs based on mood. The first stage is preprocessing, in which feature selection will occur. The next stage of feature selection is feature extraction or feature extraction from a song file to find features that enter the next data processing stage. At this stage, a signal processing process requires using the Fourier transform, which functions to change the function or signal in the time domain to the frequency domain. The features used in this study use the features on the Spotify API. The Spotify API [8] uses signal processing and machine learning to extract features in a song. This machine learning technique simulates how people hear music, combining psychoacoustic principles, musical perception, and adaptive learning to model human hearing's physical and cognitive processes. Spotify API can retrieve the value of 11 music features, namely speechiness, energy,
danceability, loudness, tempo, mode, valence, instrumentals, acousticness, and liveliness). The features used in this study are the energy and valence features, as done by [9] as a feature representing the mood of a Balinese song used in the classification process.
The clustering process in this study uses the K-Means algorithm, where the data mining algorithm performs the modelling process without supervision (unsupervised learning) and is one of the algorithms that perform data grouping using the partition system [10]. The K-Means method attempts to classify existing data into several groups, where the data in one group have the same characteristics as each other and have different characteristics from the data in other groups [1]. In other words, this algorithm seeks to minimize variation between data in a cluster and maximize variation with data in other clusters.
The dataset used is 50 Balinese songs obtained from Spotify, where the first five datasets we use are:
Table 1. Footage of Balinese song datasheet
|
No |
Title |
Artist |
Energy |
Valence |
|
1 |
Jodoh |
Jun Bintang |
0.44 |
0.745 |
|
2 |
Song Brerong |
A. A. Raka Sidan |
0.487 |
0.489 |
|
3 |
Ketut Garing |
Emoni Bali |
0.317 |
0.827 |
|
4 |
Don Dapdape |
Puspa Dewi |
0.266 |
0.34 |
|
5 |
Tresna Terlarang |
Lebri Partami |
0.598 |
0.554 |
|
... 50 |
... Rindu Ngantosang Janji |
... Putri Bulan |
... 0.614 |
... 0.614 |
Valence and arousal are popular features in the introduction of emotions or moods in songs. The Valence-arousal model is a dimensional model that depicts various emotions in a 2dimensional plane [9]. The horizontal axis is the valence representing positive and negative, and the vertical axis is the stimulus representing joy and calm. In this study, the value we use is between 0 and 1, and each quadrant will describe the emotions of happy, sad, relaxed, and angry.
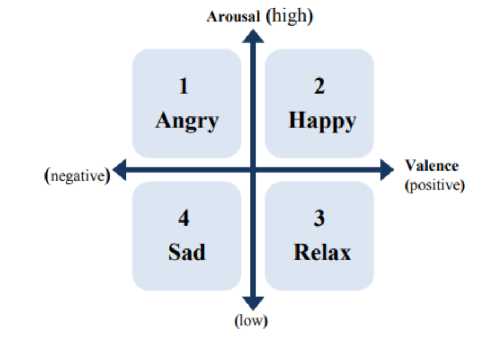
Figure 3. Primary emotion arousal-valence Thayer's model [7]
K-Means is a non-hierarchical data clustering method that attempts to partition existing data into one or more clusters/groups. The K-Means Clustering algorithm can help in improving the performance of researchers and saving time. Also, grouping aims to hide music information in several unique codes to hide music information.
The K-Means clustering stage begins with determining the number of clusters (k) to classify the test data as input data, grouped into several k clusters. For example, if there are 400 rows of data in the dataset, and need to form four mood clusters, k is four clusters. This algorithm then takes four data records randomly from the dataset to form the initial cluster. The steps for clustering using the K-Means method are as follows [11] :
-
a. Select the number of clusters k.
-
b. Cluster centre initialization can do in various ways. However, it can do randomly. The centre of the cluster is assigned an initial value with a random number.
-
c. Allocate all data/objects to the closest cluster. The proximity of two objects is determined based on the distance between the two objects. Likewise, data closeness to a particular cluster is determined by the distance between the data and the cluster centre. In this stage, it is necessary to calculate the distance of each data to each cluster centre. The most distance between one data and one particular cluster will determine which data is included in which cluster. The distance between the data to each cluster centre-point can be calculated using the Euclidean distance theory, which is formulated as follows :
D(l,j) = √(χιι - ^ij)2 + (X2l - X2j~)2 +-----+ (Xkl - Xkj)2 (1)
Where :
D(i,j) = distance of data to i to cluster centre j
Xkl = Data i to data attribute k
Xkj = The j centre of the k attribute
-
d. Recalculate cluster centres with current cluster membership. The cluster centre is the average of all data/objects in a particular cluster. Apart from the mean, the cluster median can be used because of the mean, not the only measure that describes the cluster's centre.
-
e. Assign each object again using the new cluster centre. If the cluster centre does not change again, the clustering process is complete. Alternatively, go back to step number three until the cluster centre does not change anymore.
Testing the k-means method in classifying the mood of Balinese pop songs is done by testing the accuracy of the data that respondents previously labelled. Respondents have often listened to Balinese songs before—seen as many as ten respondents to rate each mood for each Balinese song in the dataset according to 4 mood classes: angry, sad, happy, and relaxed. Respondents are given a questionnaire to fill in the angry, sad, happy, and relax scale values from 1-5 on a song, and the rating of each song will look for the highest class average for each song for all respondents.
The song data used in the test comprises 50 Balinese songs with their valence and energy features taken from the Spotify API. The songs will be listened to the respondents and asked to fill out an assessment questionnaire for each song. The mood label results of the respondent's assessment of each song will be compared with the classification results using K-Means clustering, and the accuracy is calculated based on false predictions and correct predictions from the classifier.
Data analysis of ten student respondents was made as a result of the research. The ten students correctly filled the song's mood objectively based on the audio content without paying attention to the lyrics or the respondent's mood. After seeing the data collection results, there is no single song with the highest average in the angry mood class, so the respondent's mood class data is only in the happy, relaxed, and sad classes. In response to this, the K-Means classification results will be compared with three clusters and four clusters. The feature mean scores for each cluster will be classified according to the dimensional mood model. The following is the average value of energy and valence in K-Means clustering with 3 clusters and 4 clusters.
Tabel 2. Average feature value with 3 clusters
|
Cluster |
Energy |
Valence |
Mood |
|
0 |
0.63 |
0.66 |
Happy |
|
1 |
0.50 |
0.51 |
Sad |
|
2 |
0.48 |
0.52 |
Relax |
|
Tabel 3. Average feature value with 4 clusters | |||
|
Cluster |
Energy |
Valence |
Mood |
|
0 |
0.49 |
0.57 |
Relax |
|
1 |
0.50 |
0.48 |
Sad |
|
2 |
0.52 |
0.54 |
Angry |
|
3 |
0.64 |
0.64 |
Happy |
The K-means algorithm is used in mood classification based on the Spotify API valence feature and energy list data for each cluster. The following is a sample of the data from the classification results using K-means clustering.
Tabel 4. Snippets of the classification results
|
Title |
Respondent Mood |
The highest class average score |
Mood 4 cluster |
|
Bedak Uling Bangli |
Sad |
3.14 |
Sad |
|
Buleleng Karangasem |
Happy |
4.29 |
Relax |
|
Dangap Dangap |
Happy |
4.57 |
Angry |
|
Depang Tiang Bagia |
Sad |
3.83 |
Angry |
|
Don Dapdape |
Relax |
4.00 |
Sad |
|
Formalin Sik Luh |
Relax |
3.43 |
Sad |
|
Gek Cantik |
Relax |
4.00 |
Relax |
|
Hubungan Tanpa Status |
Sad |
3.71 |
Relax |
|
Jenggot Uban |
Happy |
4.14 |
Happy |
|
Jodoh |
Happy |
3.43 |
Sad |
Following the test scenario, the results of song classification based on energy and valence features obtained from the Spotify API will be measured for their accuracy against the respondent's data. The results of the song classification will be calculated, which have the same class as the respondent's data so that its accuracy can be seen.
Classification using K-means clustering with 4 clusters has the same song class prediction as to the respondent's data of 16 songs from 50 songs in the dataset, resulting in an accuracy of 32%. This small accuracy happens because the respondents' survey of 50 Balinese songs did not have an angry mood. If the writer considers that Balinese songs cannot be described with an angry mood, then we will try an approach using only three mood clusters, namely happy, sad, and relaxed.
Tabel 5. Snippets of the classification results of 3 clusters and 4 clusters
|
Title |
Respondent Mood |
The highest class average |
Mood 4 cluster |
Mood 3 cluster |
|
score |
|
Bedak Uling Bangli |
Sad |
3.14 |
Sad |
Sad |
|
Buleleng Karangasem |
Happy |
4.29 |
Relax |
Relax |
|
Dangap Dangap |
Happy |
4.57 |
Angry |
Happy |
|
Depang Tiang Bagia |
Sad |
3.83 |
Angry |
Sad |
|
Don Dapdape |
Relax |
4.00 |
Sad |
Relax |
|
Formalin Sik Luh |
Relax |
3.43 |
Sad |
Sad |
|
Gek Cantik |
Relax |
4.00 |
Relax |
Relax |
|
Hubungan Tanpa Status |
Sad |
3.71 |
Relax |
Relax |
|
Jenggot Uban |
Happy |
4.14 |
Happy |
Happy |
|
Jodoh |
Happy |
3.43 |
Sad |
Sad |
The classification using K-means clustering with 3 clusters has the same song class prediction as to the respondent's data of 20 songs from a total of 50 songs in the dataset, resulting in an accuracy of 40%. If seen in table 4 above, there is a classification of class results with 4 clusters with angry class, and because the respondent data of the mood class are not angry, it causes several songs to enter the angry cluster. Whereas in the 3 clusters classification, several clusters that were previously classified as angry in 4 clusters had the correct prediction of the respondent data class.
Tabel 6. Comparison of the number of songs with the identified mood
|
Total songs with mood |
Type Classification | ||
|
Respondent Mood Total |
K-Means Clustering Mood total (4 clusters) |
K-Means Clustering Mood total (3 clusters) | |
|
Happy |
19 |
13 |
14 |
|
Relax |
16 |
13 |
18 |
|
Sad |
15 |
18 |
18 |
|
Angry |
0 |
6 |
0 |
|
Total |
50 |
50 |
50 |
This research has obtained song mood classifications based on audio features, namely energy, and valence obtained from the Spotify API dataset. This study was tested by comparing the K-means clustering classification results with subjective data from ten student respondents. The data taken is the scale value of 4 mood classes for each song. After taking the respondents' data, none of the 50 songs had an angry mood class, so the classification results with 3 clusters and 4 clusters are compared for accuracy.
Classification with 3 clusters resulted in an accuracy of 40 %. This accuracy is higher than the classification with 4 clusters, resulting in an accuracy of only 32 %. This is due to the data of respondents known for being happy, relaxed, and sad. However, it can be neglected that the features of the Spotify API and the song classification using K-means clustering with these features on the object of Balinese song research resulted in the highest of 40 %. As a suggestion for further research, use the features of the Spotify API in addition to the energy and valence features because the Spotify API provides various dataset features.
Reference
-
[1] I. G. Harsemadi and I. M. Sudarma, "Penggolongan Musik Terhadap Suasana Hati
Menggunakan Metode K-Means," E-Proceedings KNS&I STIKOM Bali, pp. 49-54, 2017.
-
[2] I. N. Mardika and I. D. P. Sumantra, "LAGU POP BALI DALAM PELESTARIAN BUDAYA
BALI," KULTURISTIK: Jurnal Bahasa dan Budaya, vol. 4, no. 1, pp. 74-81, 2020.
-
[3] Y.-H. Yang, Y.-C. Lin, Y.-F. Su, and H. H. Chen, "A regression approach to music emotion
recognition," IEEE Transactions on audio, speech, and language processing, vol. 16, no. 2, pp. 448-457, 2008.
-
[4] A. Lesmana, "Pemanfaatan Wearable Device Dan Spotify Api Untuk Merekomendasikan
Lagu Berdasarkan Mood Dan Aktivitas Pengguna Berbasis Android," Universitas Komputer Indonesia, 2019.
-
[5] G. A. V. M. Giri, "Klasifikasi Musik Berdasarkan Genre dengan Metode K-Nearest
Neighbor," Jurnal Ilmu Komputer, vol. 11, no. 2, pp. 103-108, 2018.
-
[6] L. S. Nyoman and S. Ni Wy, "Laporan Akhir Penelitian Dosen Pemula" Komodifikasi
Code-Mixing Bahasa Inggris Dalam Lirik Lagu POP Bali: Studi Kasus Lirik Lagu Kis Band," 2013.
-
[7] S. Pouyanfar and H. Sameti, "Music emotion recognition using two level classification,"
in 2014 Iranian Conference on Intelligent Systems (ICIS), 2014: IEEE, pp. 1-6.
-
[8] A. Spotify, "Spotify Developer," https://developer.spotify.com/Bali-Song's-Mood-
-
[9] S. Sangnark, M. Lertwatechakul, and C. Benjangkaprasert, "Thai music emotion
recognition based on western music," in Journal of Physics: Conference Series, 2019, vol. 1195, no. 1: IOP Publishing, p. 012009.
-
[10] Spotify-Emotions-Project. (2019).
-
[11] R. W. Sari, A. Wanto, and A. P. J. K. Windarto, "Implementasi Rapidminer Dengan
Metode K-Means (Study Kasus: Imunisasi Campak Pada Balita Berdasarkan Provinsi)," vol. 2, no. 1, 2018.
338
Discussion and feedback