The Effects of Different Kernels in SVM Sentiment Analysis on Mass Social Distancing
on
p-ISSN: 2301-5373
e-ISSN: 2654-5101
Jurnal Elektronik Ilmu Komputer Udayana
Volume 9 No. 2, November 2020
The Effects of Different Kernels in SVM Sentiment Analysis on Mass Social Distancing
Komang Dhiyo Yonatha Wijayaa1, AAIN Eka Karyawatia2
aInformatics Department, Faculty of Math and Science, Udayana University Bali, Indonesia 1komangdhiyo66@gmail.com 2eka.karyawati@unud.ac.id
Abstract
During this pandemic, social media has become a major need as a means of communication. One of the social medias used is Twitter by using messages referred to as tweets. Indonesia currently undergoing mass social distancing. During this time most people use social media in order to spend their idle time However, sometimes, this result in negative sentiment that used to insult and aimed at an individual or group. To filter that kind of tweets, a sentiment analysis was performed with SVM and 3 different kernel method. Tweets are labelled into 3 classes of positive, neutral, and negative. The experiments are conducted to determine which kernel is better. From the sentiment analysis that has been performed, SVM linear kernel yield the best score Some experiments show that the precision of linear kernel is 57%, recall is 50%, and f-measure is 44%.
Keywords: Sentiment Analysis, Tweet, SVM, Indonesia, Kernel
The need for social media has become part of Indonesian society. Moreover, in present that the current Covid-19 pandemic happen where social media are used as the main means to communicate due to social restrictions to prevent the spread of viruses. One of the social medias that used is the Twitter where users communicate using tweet as a message. This message can be used to see people thoughts about mass social distancing to further improve the quality of mass social distancing.
To find out the sentiment of the tweet whether it is positive, neutral, or negative can be done by applying sentiment analysis to the tweet. Sentiment analysis is a field of science that analyzes opinions, attitudes, evaluations, and assessments of an event, topic, organization, or individual [4]. In sentiment analysis we can use machine learning such as suport vector machine (SVM). Using the SVM method, researcher analyzed the sentiment to determine the sentiment of the tweet which can be positive, neutral, or negative sentiment. To find out how the performance of the sentiment analysis is performed, the scores of precision, recall, and f-measure are used as the performance values of the analysis.
The example of machine-learning-based sentiment analysis is a research carried out by [7]. The research conduct a study about classification using Naïve Bayes method of snack review and the performance in their research is 80.5% for the average accuracy score. Research of SVM have been carried out by[3]. The research conducted a study about text classification using SVM with multiple different kernel such as sigmoid, polynomial, rbf and linear. In their research Linear Kernel SVM have the best accuracy with 92.4381% score. The other research conducted a study carried by[6]. The research conducted a study about comparing RBF and linear kernel SVM in spam classification. In their research have the best accuracy with 96.6% score
Based on existing problems and related studies this research is conducted to compare the evaluation results (Precision, Recall and F-Measure) of three different kernel function of
SVM method. The three-kernel and RBF kernel function.
function are polynomial kernel function, linear kernel function,
The research is divided into several stages. These stages are the data gathering stage, the preprocessing stage, the sentiment analysis stage with SVM method, and the results evaluation phase. Here is the flowchart that show how the flow of the research done.
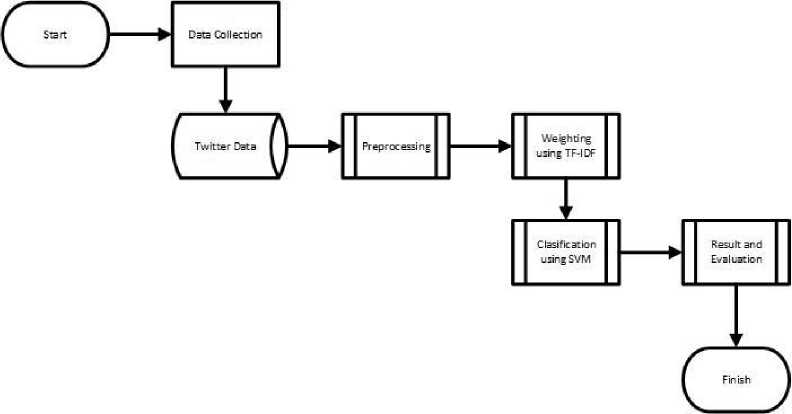
Figure 1. Research Stage
The data that being used is an indonesian tweet data. Data gathering is done using the Twitter API and tweepy library in Python. Data searching are performed by searching for specific words such as “PSBB” and “COVID-19” and filtering for retweets. The amount of the data that have been gathered is 300. The data is divided into 3 classes namely positive data, neutral data and negative data with the amount of data as much as 100 data each.
Preprocessing is a process to convert data that still does not have a meaning into data that has meaning and can be processed. The preprocessing stage is done to make the data "clean" so that errors in data processing can be reduced and make the process more efficient. Here are the flowchart that show how the stages in preprocessing.
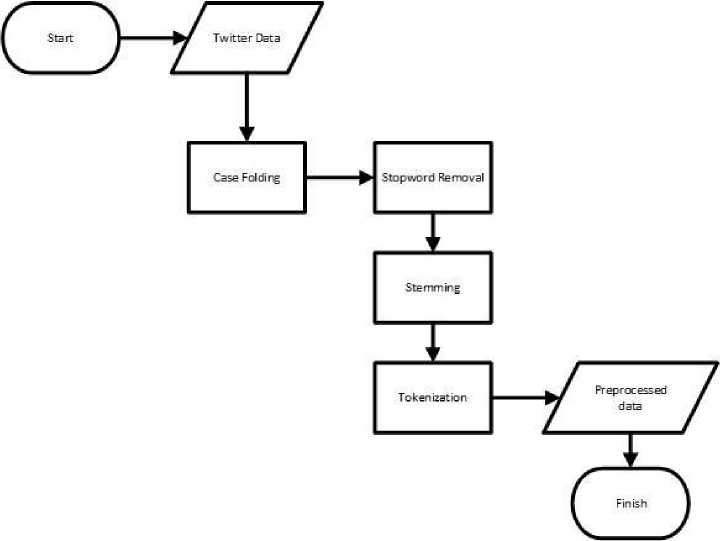
Figure 2. Preprocessing
Casefolding is a process to create the same form of data that contains only lowercase letters. Casefolding is done so that the existing data is equal. Stopword removal is a process for removing words that are very commonly used and have no meaning in performing sentiment analysis. Stopword removal is done to make the process run more efficiently. Stemming is the process of removing the prefix or suffix in the data so that it turns into a basic form. Stemming is done to equate data that has different writing. Tokenization is the process for creating tokens from the initial data. Tokens are a smaller part of the initial data. In this tokenization process also carried out the calculation of the number of words on the tweet which will be used in the process of sentiment analysis with SVM[5].
Term Frequency-Inverse Document Frequency (TF-IDF)is a method that is used to calculate the weight of extracted word. TF-IDF commonly used to find the common word in a document. TF-IDF is a method that integrate term frequency (TF), and inversed Document frequency model. Term frequency is used to calculate the appearance of term in one document, inversed document frequency (IDF) is used to calculate the appearance of terms in multiple document that is deemed as unimportant [5]. The stages of TF-IDF are as follows.
2.5
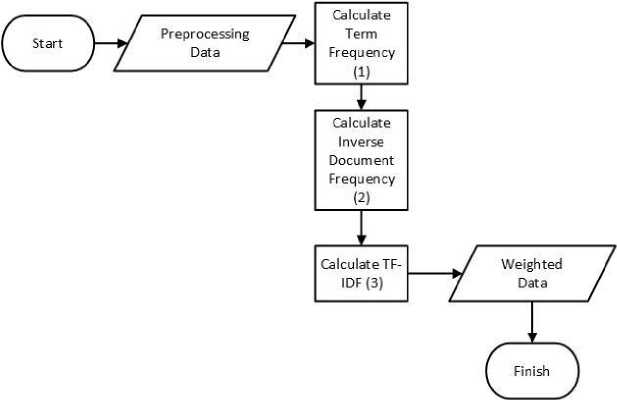
Figure 3. TF-IDF
a. Calculate term frequency (tft,d)
-
b. Calculate weighting term frequency (Wtf)
_ f 1 + log tft, d, jika tft, d > 0
Wtf = { 0,
-
c. Calculate document frequency (df)
d. Calculate weight of inverse document frequency (idf)
e. Calculate weight of TF-IDF
wt,d = wtft,d × idft
Description :
tft,d = term frequency
Wtf t,d = weight of term frequency df = document frequency of term N = total number of documents
Wt,d = weight TF-IDF
(1)
(2)
(3)
Support Vector Machine (SVM) Algorithm
SVM is a linear classification method. SVM's main role in classifying is to define a separator in the search space that can separate different classes. This separator is commonly referred to as a hyperplane. One of the advantages of this SVM method is that it is quite good at classifying high-dimensional data because the method tries to determine the optimal direction of discrimination in the feature space by examining the right feature combination [1]. The stages of sentiment analysis with SVM are as follows.
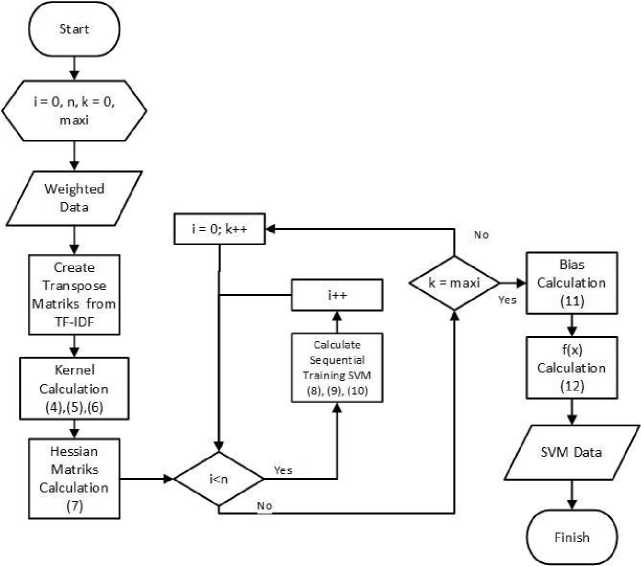
Figure 4. SVM
In determining the outcome of a decision, the SVM method uses kernel functions. The SVM kernels used in this study are polynomial, linear and RBF kernels with the following functional equations[2].
Polynomial Kernel
Linear Kernel
RBF Kernel
K (xt∣Xj) = eχp(-γ∣χi-χj∣2),γ > 0
The steps in using the SVM method are as follows:
-
a. Train the weighted data using Sequential Training SVM
-
b. Initiate parameter that will be used seperti αi, λ, γ, C, dan ε.
-
c. Calculate the hessian matrix using following equiation :
-
d. Starting from the 1st data to the nth data, perform the calculation iteration of the following equation[2].
δαi = min{max[γ(1 - Ei)∣-ai] ∣C - ai)(9)
-
e. From previous calculations, the largest αi value is sought and calculations are carried out to determine the bias using the following equation[2].
b = —1 [(∑f=1atyt K(χt,χ-)) + (∑tL1atyi K(χt,χ+))](11)
-
f. To find out the results of the classification, testing is performed using the calculation function f(x). Function f(x) is obtained from the following equation[2].
f(x) = ∑n=0alylK{xl,x-) + b (12)
Variabel Description:
-
αi = alfa, to find a vector support
-
γ = gamma, to control learning rate speed
C = variabel slack
-
ε = epsilon, to search for error values
Dij = value of hessian matrix
-
xi = i-th data
-
xj = j-th data
-
yi = i-th data class
-
b = bias value
f(x) = test function
-
K (xi, xd) = kernel function
exp = exponent
The evaluation is conducted to measure evaluation performance of the proposed method. Evaluation is done by calculating the score of precision, recall, and f-measure of each class and calculate the average. Here's how to find precision, recall, and f-measure values for each class.
|
Precision |
Sum of correct prediction Total sum of prediction (^) |
|
Recall |
_ Sum of correct prediction Totalamountofdata (^) 2*Pr ecision*Recall |
|
F-Measure |
= (15) Precision+Recall |
The average calculation is done by summing the precision, recall, or f-measure scores of all classes and divided by 3 because the amount of data of each class is already the same.
From sentiment analysis with SVM that has been done, the prediction results are obtained as follows.
|
Table 1. Precision, Recall, F-Measure of Linear Kernel | ||||
|
Positive |
Neutral |
Negative |
Average | |
|
Precision |
0.57 |
0.47 |
0.75 |
0.57 |
|
Recall |
0.21 |
0.92 |
0.19 |
0.50 |
|
F-Measure |
0.33 |
0.62 |
0.29 |
0.44 |
As can be seen from the Table 1, for positive class, the score of precision is 0.57 or 57%, recall’s score is 0.47 or 47%, and f-measure’ score is of 0.33 or 33%. For neutral class, the score of precision is 0.47 or 47%, recall’s score is 0.92 or 92%, and f-measure’s score is 0.62 or 62%. And for negative class, the score of precision is 0.75 or 100%, recall’s score 0.62 or 62%, and f-measure’s score is 0.33 or 33%. The average precision score is 0.57 or 57%, the average recall score is 0.62 or 62%, and the average f-measure score is 0.29 or 29%.
However, the results are not good enough (close to or below 50%) because there are still a lot of noise like unnormalized data in the dataset.
Table 2. Precision, Recall, F-Measure of Polynomial Kernel
|
Positive |
Neutral |
Negative |
Average | |
|
Precision |
1.00 |
0.39 |
1.00 |
0.78 |
|
Recall |
0.11 |
1.00 |
0.10 |
0.43 |
|
F-Measure |
0.20 |
0.56 |
0.18 |
0.33 |
As can be seen from the Table 2, for positive class, the score of precision is 1.00 or 100%, recall’s score is 0.11 or 11%, and f-measure’ score is of 0.20 or 20%. For neutral class, the score of precision is 0.39 or 39%, recall’s score is 1.00 or 100%, and f-measure’s score is 0.56 or 56%. And for negative class, the score of precision is 1.00 or 100%, recall’s score 0.10 or 10%, and f-measure’s score is 0.18 or 18%. The average precision score is 0.78 or 78%, the average recall score is 0.43 or 43%, and the average f-measure score is 0.33 or 33%. However, the results are not good enough (close to or below 50%) because there are still a lot of noise like unnormalized data in the dataset.
Table 3. Precision, Recall, F-Measure of RBF Kernel
|
Positive |
Neutral |
Negative |
Average | |
|
Precision |
1.00 |
0.41 |
1.00 |
0.77 |
|
Recall |
0.07 |
1.00 |
0.05 |
0.43 |
|
F-Measure |
0.13 |
0.59 |
0.09 |
0.30 |
As can be seen from the Table 3, for positive class, the score of precision is 1.00 or 100%, recall’s score is 0.07 or 7%, and f-measure’ score is of 0.13 or 13%. For neutral class, the score of precision is 0.41 or 41%, recall’s score is 1.00 or 100%, and f-measure’s score is 0.59 or 59%. And for negative class, the score of precision is 1.00 or 100%, recall’s score 0.05 or 5%, and f-measure’s score is 0.09or 9%. The average precision score is 0.77 or 77%, the average recall score is 0.43 or 43% and the average f-measure score is 0.30 or 30%. However, the results are not good enough (close to or below 50%) because there are still a lot of noise like unnormalized data in the dataset.
The evaluation result show that SVM with linear kernel function is better than other two methods. The evaluation results of linear kernel function show that precision score is 57%, recall score is 50%, and the f-measure score is 44%, as for polynomial kernel function the precision score is 78% recall score is 43% and f-measure score is 33%, lastly for rbf kernel function the precision score is 77%, recall score is 43%, and f-measure score is 30%. From that result can be concluded that simpler kernel function suits better for this experiment. However, the results are not good enough (close to or below 50%) because there are still a lot of noise like unnormalized data in the dataset.. This problem can be remedied by further normalization of the data. It also can be seen that the percision score of support vector machine with polynomial kernel is greater than two others. So, it can be concluded that the application of linear kernel on support vector machine yield better result than polynomial kernel and rbf kernel.
Reference
-
[1] Aggarwal, C. C., & Zhai, C. (2012). A survey of text classification algorithms. In Mining
text data (pp. 163-222). Springer, Boston, MA.
-
[2] C. A. A. Kaestner, “Support Vector Machines and Kernel Functions for Text
Processing,” Rev. Informática Teórica e Apl., vol. 20, no. 3, p. 130, 2013, doi:
10.22456/2175-2745.39702.
-
[3] L. Muflikhah and D. J. Haryanto, “High Performance of Polynomial Kernel at SVM
Algorithm for Sentiment Analysis,” J. Inf. Technol. Comput. Sci., vol. 3, no. 2, p. 194, 2018, doi: 10.25126/jitecs.20183260.
-
[4] Liu, B., 2012. Sentiment Analysis and Opinion Mining. In: Chicago: Morgan & Claypool
Publisher.
-
[5] Manning, C., Raghavan, P. & Schütze, H. (2009). An Introduction to
InformationRetrieval. Cambridge: Cambridge University Press.
-
[6] Pratiwi, S. N. D., & Ulama, B. S. S. (2016). Klasifikasi Email Spam dengan
Menggunakan Metode Support Vector Machine dan k-Nearest Neighbor. Jurnal Sains dan Seni ITS, 5(2).
-
[7] I. G. C. P. Yasa, N. A. Sanjaya ER, and L. A. A. R. Putri, “Sentiment Analysis of Snack
Review Using the Naïve Bayes Method,” JELIKU, vol. 8, no. 3, pp. 333–338, 2020.
168
Discussion and feedback